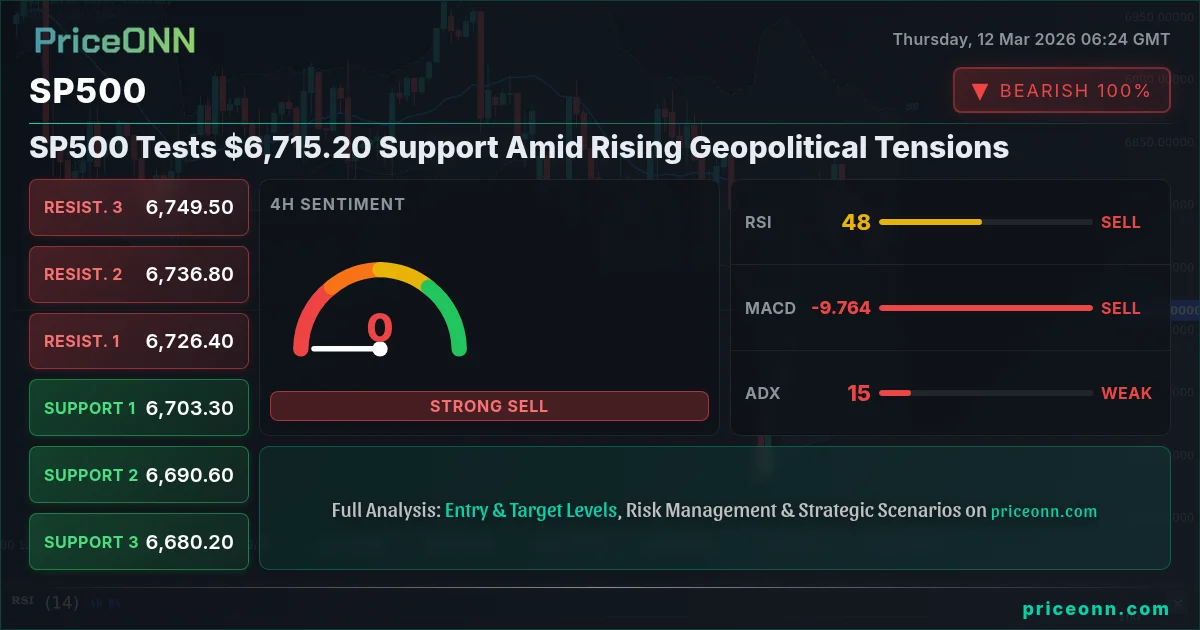
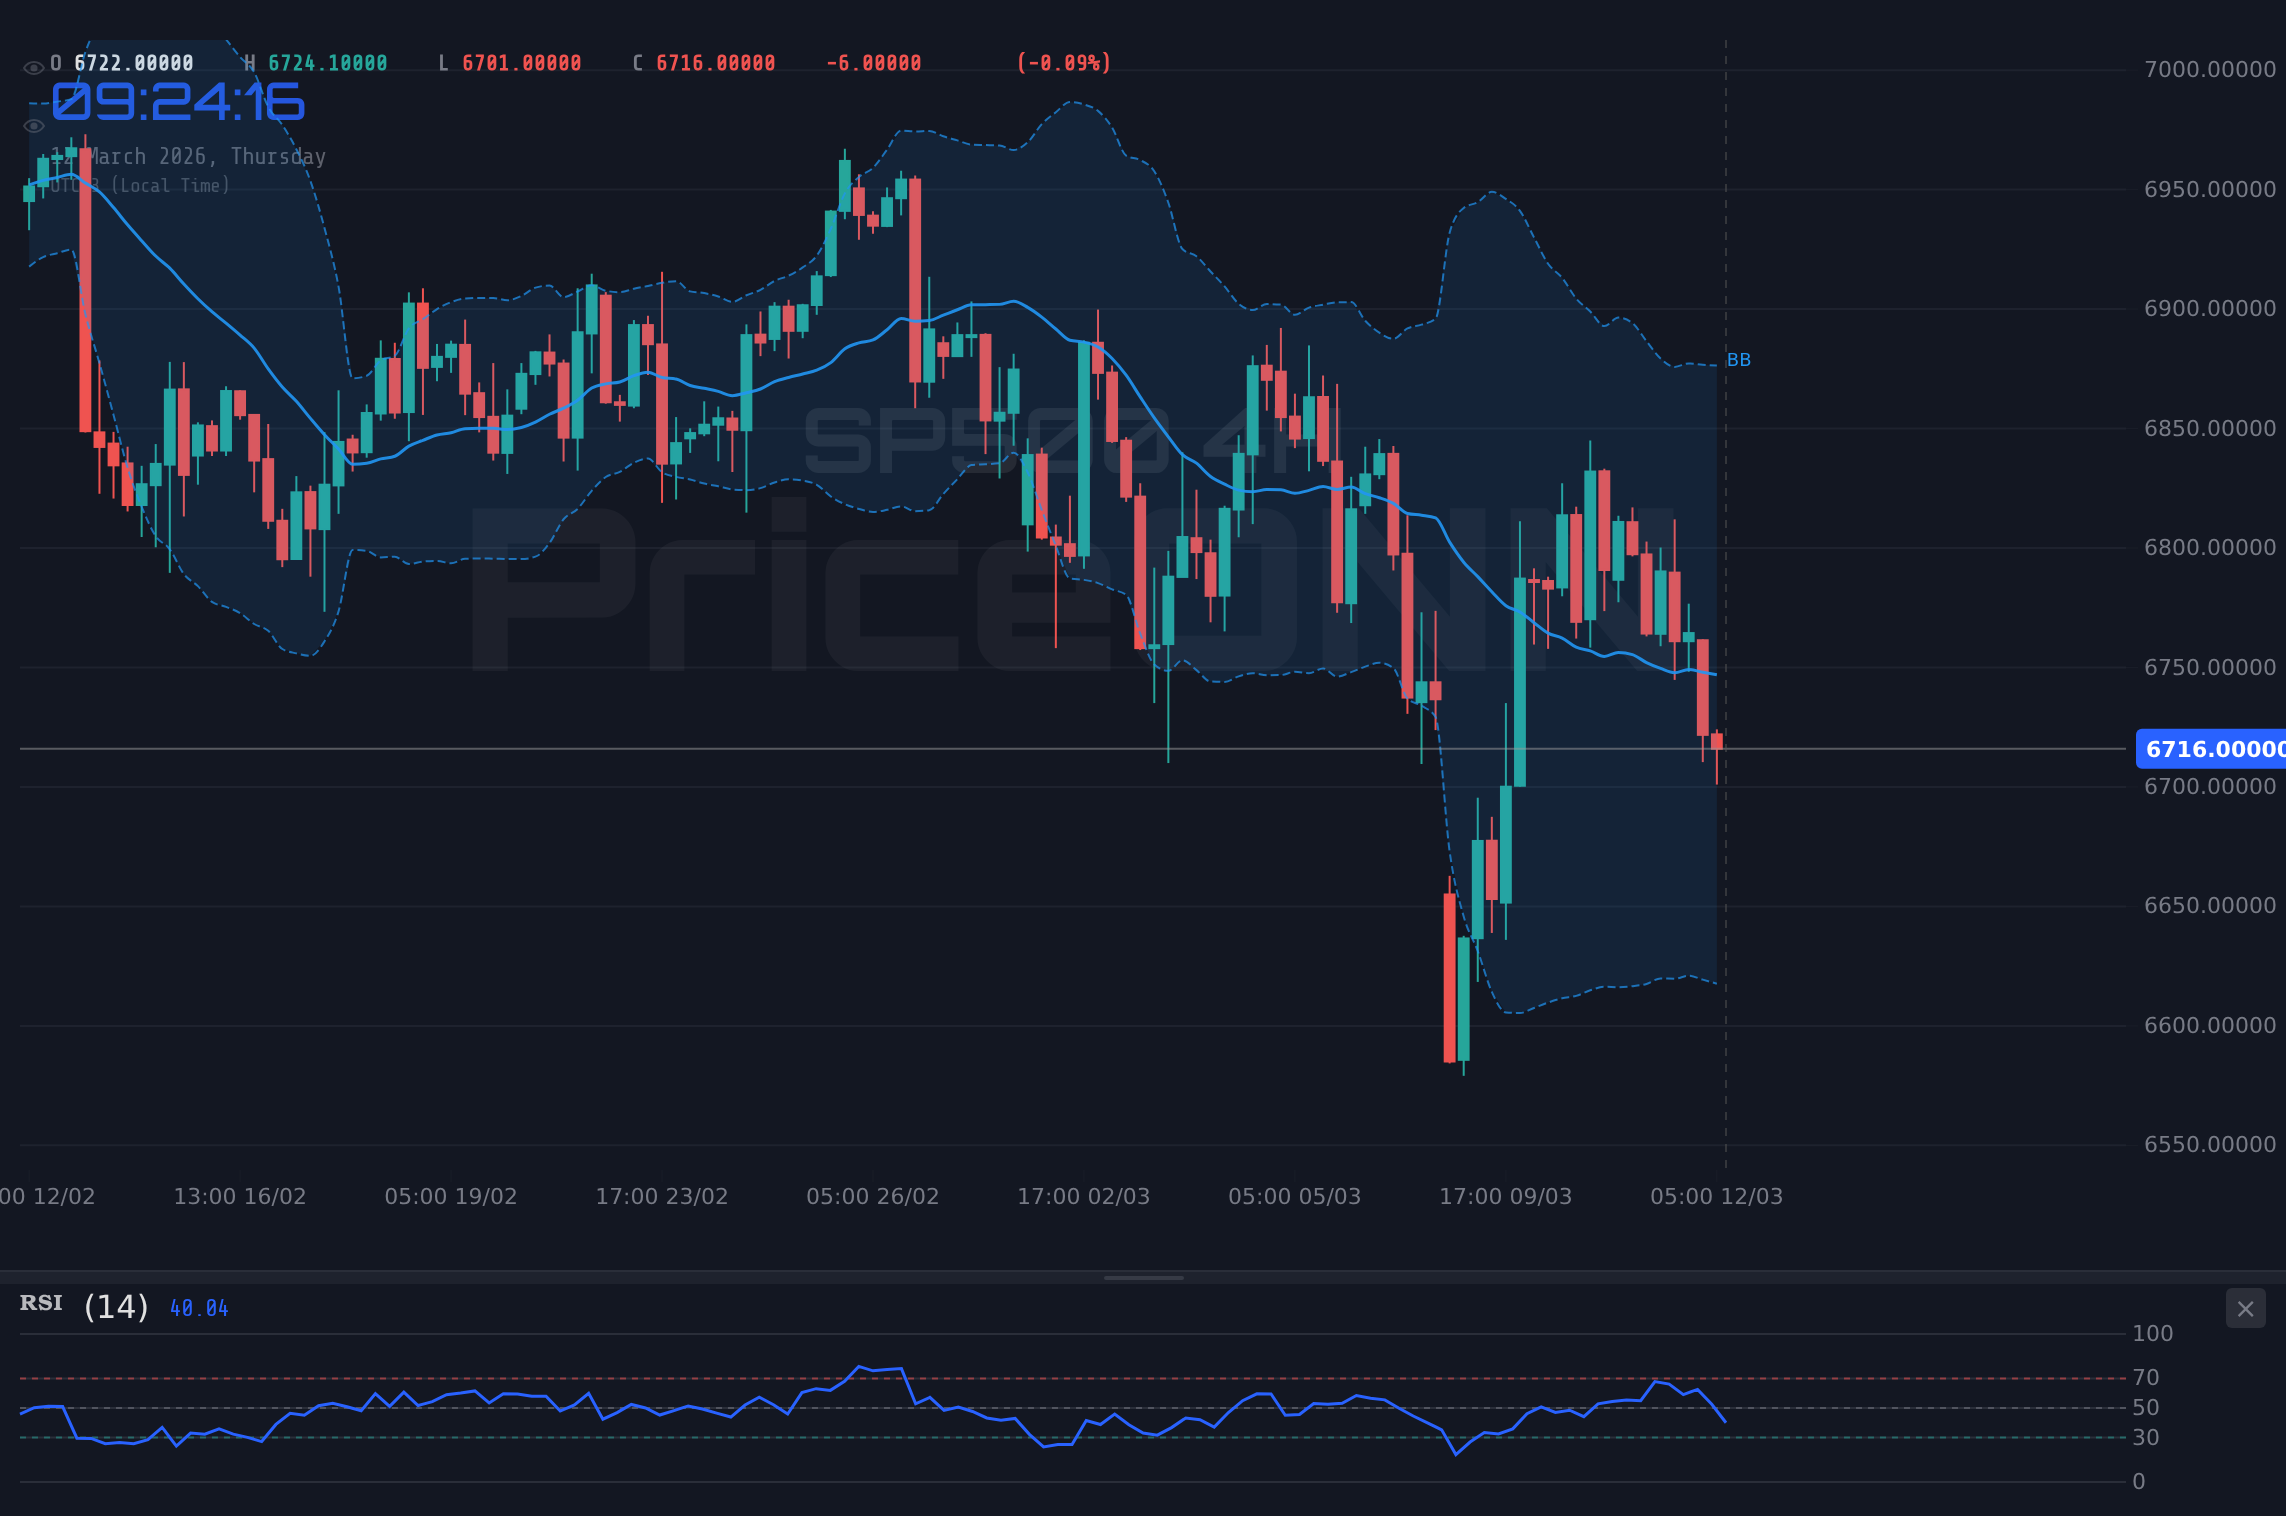
SP500 is currently trading near a critical juncture at $6,715.20, a level that could determine the market's short-term trajectory. The index is under pressure from a confluence of factors, including escalating geopolitical tensions and persistent inflation worries. The question now is whether this support level will hold, or if the bears will seize control and drive the index lower. SP500 today analysis reveals a market struggling to find its footing amidst global uncertainty.
- RSI at 37.5 on the 1-hour chart suggests increasing selling pressure.
- Critical support level at $6,701.73 is being tested, a break below could trigger further declines.
- MACD histogram indicates negative momentum is building, favoring bearish sentiment.
- Geopolitical tensions in the Middle East are driving risk-off sentiment and impacting SP500 correlation with DXY.
The current market environment is characterized by heightened risk aversion, fueled by escalating tensions in the Middle East. According to Reuters, attacks are fueling supply fears. This has led to a surge in oil prices, which in turn is exacerbating concerns about inflation. The SP500, being a broad market index, is particularly vulnerable to these macroeconomic headwinds. The DowJones30 is feeling the same pressure, down -0.9% today.
For investors and traders, understanding the potential scenarios and their associated triggers is crucial for navigating this volatile market. Let's examine the possible paths the SP500 could take in the near term.
The Bull's Roadmap: A Recovery Scenario
In a bullish scenario, the SP500 would need to establish a firm foothold above the immediate resistance at $6,712.03. This would require a significant shift in market sentiment, potentially driven by easing geopolitical tensions or a positive surprise in upcoming economic data. A successful breakout above this level could pave the way for a test of the next resistance at $6,718.57. If the SP500 can sustain momentum above this level, the bulls could target $6,722.33 as the next upside objective. This scenario hinges on a return of risk appetite and a weakening of the dollar index (DXY), which is currently showing strength. A move above the 61.8% Fibonacci retracement level, around $6730, could signal the start of a new bullish wave.
From a multi-timeframe analysis perspective, the 1-day chart reveals that the SP500 is currently trading below its 200-day moving average, a key technical indicator that often acts as a dynamic support or resistance level. A sustained move above this moving average would be a significant bullish signal. Scalpers might look for quick long opportunities above $6,712.03, while swing traders would likely wait for a confirmed breakout above $6,718.57 before committing to a longer-term position. Long-term investors might view a pullback to the 50-day moving average as a buying opportunity, provided that the overall macroeconomic outlook remains supportive.
Where Bears Take Control: A Downward Spiral
On the other hand, a bearish scenario would unfold if the SP500 fails to hold the critical support at $6,701.73. A decisive break below this level could trigger a wave of selling pressure, potentially driving the index down to the next support at $6,697.97. If the bears maintain control, the SP500 could then target $6,691.43 as the next downside objective. This scenario is predicated on continued geopolitical uncertainty, rising inflation, and a strengthening dollar. The RSI on the 4-hour chart is currently below 50, indicating that the bears have the upper hand in the short term. A break below the 61.8% Fibonacci extension level, around $6680, could signal the start of a new bearish wave.
The SP500 news impact is crucial here. Negative headlines regarding geopolitical tensions or economic data could exacerbate the selling pressure. From a technical perspective, a death cross formation (when the 50-day moving average crosses below the 200-day moving average) would be a major bearish signal. Scalpers might look for quick short opportunities below $6,701.73, while swing traders would likely wait for a confirmed breakdown below $6,697.97 before entering a short position. Long-term investors might consider reducing their exposure to equities if the bearish scenario unfolds.
The Waiting Game: A Range-Bound Scenario
A neutral or range-bound scenario would emerge if the SP500 remains trapped between the immediate support at $6,701.73 and the resistance at $6,712.03. In this scenario, the index would likely experience choppy trading with no clear directional bias. The ADX indicator, which measures the strength of a trend, is currently at 18.29 on the 1-hour chart, suggesting that the market is lacking a strong trend. The SP500 market sentiment would be indecisive, with bulls and bears battling for control. This scenario could persist until a major catalyst emerges to break the stalemate. The Stochastics indicator is showing oversold conditions, suggesting a possible bounce, but the overall trend remains weak.
This sideways action highlights the need for patience and selective trading. Traders should focus on identifying high-probability setups within the range, rather than trying to force trades. Scalpers can profit from the volatility within the range, while swing traders should wait for a confirmed breakout or breakdown before taking a position. Long-term investors might use this period of consolidation to rebalance their portfolios and assess their risk exposure.
Most Likely Scenario: Cautiously Bearish (60% Probability)
Considering the current market conditions, a cautiously bearish scenario appears to be the most likely outcome (60% probability). The escalating geopolitical tensions, combined with persistent inflation worries and a strengthening dollar, are creating a challenging environment for equities. The technical indicators also support this view, with the SP500 trading below its 200-day moving average and the RSI indicating increasing selling pressure. However, it's important to acknowledge that the market is dynamic, and unexpected events could quickly shift the balance of power. The overall trend is bearish, but there is a risk that the market could bounce from the oversold level. The key is to manage risk and wait for confirmation before taking a position.
The SP500 is highly correlated with other markets, including the DXY, bond yields, and oil prices. A stronger dollar (DXY at 99.22) typically puts downward pressure on the SP500, as it makes U.S. exports more expensive and reduces the earnings of multinational corporations. Rising bond yields also tend to weigh on the SP500, as they increase borrowing costs for companies and make equities less attractive relative to fixed-income investments. Oil prices, on the other hand, can have a mixed impact. While higher oil prices can boost the energy sector, they also contribute to inflation, which can erode consumer spending and corporate profits. As oil prices test $100, that is certainly a risk factor.
Key Triggers to Watch This Week
Several key events and data releases could influence the SP500's trajectory this week. On the economic front, the market will be closely watching the upcoming data. Any surprises in these reports could trigger a significant market reaction. Geopolitical developments will also remain a key focus, particularly any escalation or de-escalation of tensions in the Middle East. From a technical perspective, traders should pay close attention to the $6,701.73 support level and the $6,712.03 resistance level. A decisive break of either of these levels could signal the start of a new trend. The USD is also worth watching. If the dollar continues to strengthen, it could put further pressure on the SP500.
Key Levels
Support Levels
Resistance Levels
Technical Outlook Summary
| Indicator | Value | Signal |
|---|---|---|
| RSI (14) | 42.21 | Neutral |
| MACD Histogram | Negative | Bearish |
| Stochastic | 11.78 | Oversold |
| ADX | 18.29 | Weak |
| Bollinger | Middle Band | Neutral |
Frequently Asked Questions: SP500 Analysis
What happens if SP500 breaks below $6,701.73 support?
A break below the $6,701.73 support level could trigger a significant sell-off, potentially driving the SP500 down to $6,697.97 and then $6,691.43. This scenario would likely be driven by continued geopolitical uncertainty and rising inflation.
Should I buy SP500 at current levels of $6,715.20 given the RSI at 37.5?
While the RSI at 37.5 suggests oversold conditions, it's not a definitive buy signal. The overall trend is bearish, and the MACD indicates negative momentum. It's prudent to wait for a confirmed reversal before considering a long position, with a stop-loss below $6,701.73.
Is the negative MACD histogram a strong sell signal for SP500 right now?
The negative MACD histogram reinforces the bearish sentiment, suggesting that selling pressure is likely to persist. However, it's important to consider other factors, such as support levels and overall market sentiment, before making a trading decision. A confirmed breakdown below $6,701.73, combined with a negative MACD, would strengthen the sell signal.
How will the upcoming data affect SP500 this week?
The upcoming data could have a significant impact on the SP500. Strong data could ease concerns about a recession and support a rally, while weak data could exacerbate the selling pressure. Traders should pay close attention to these releases and adjust their positions accordingly.
Track markets in real-time
AI-powered analysis, technical indicators and real-time price data.
Join Our Telegram Channel
Breaking market news, AI analysis and trading signals instantly.
Join Channel