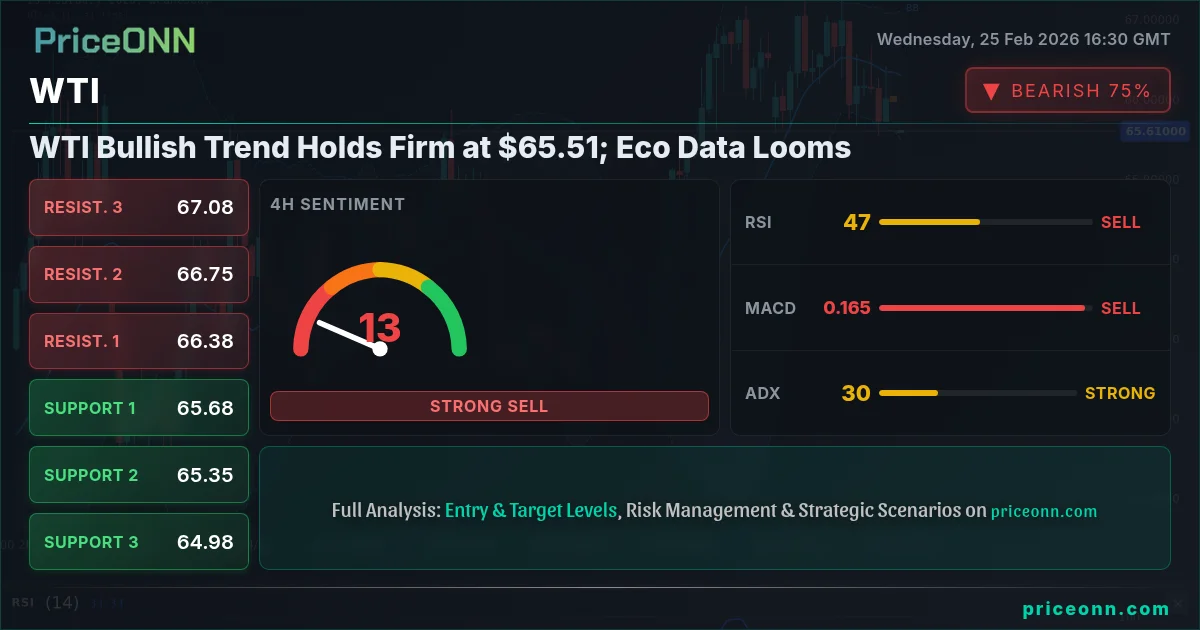
WTI Bullish Trend Holds Firm at $65.51; Eco Data Looms
WTI holds bullish trend at $65.51 after a dip, as traders eye upcoming economic data releases for further direction. Will the rally continue?
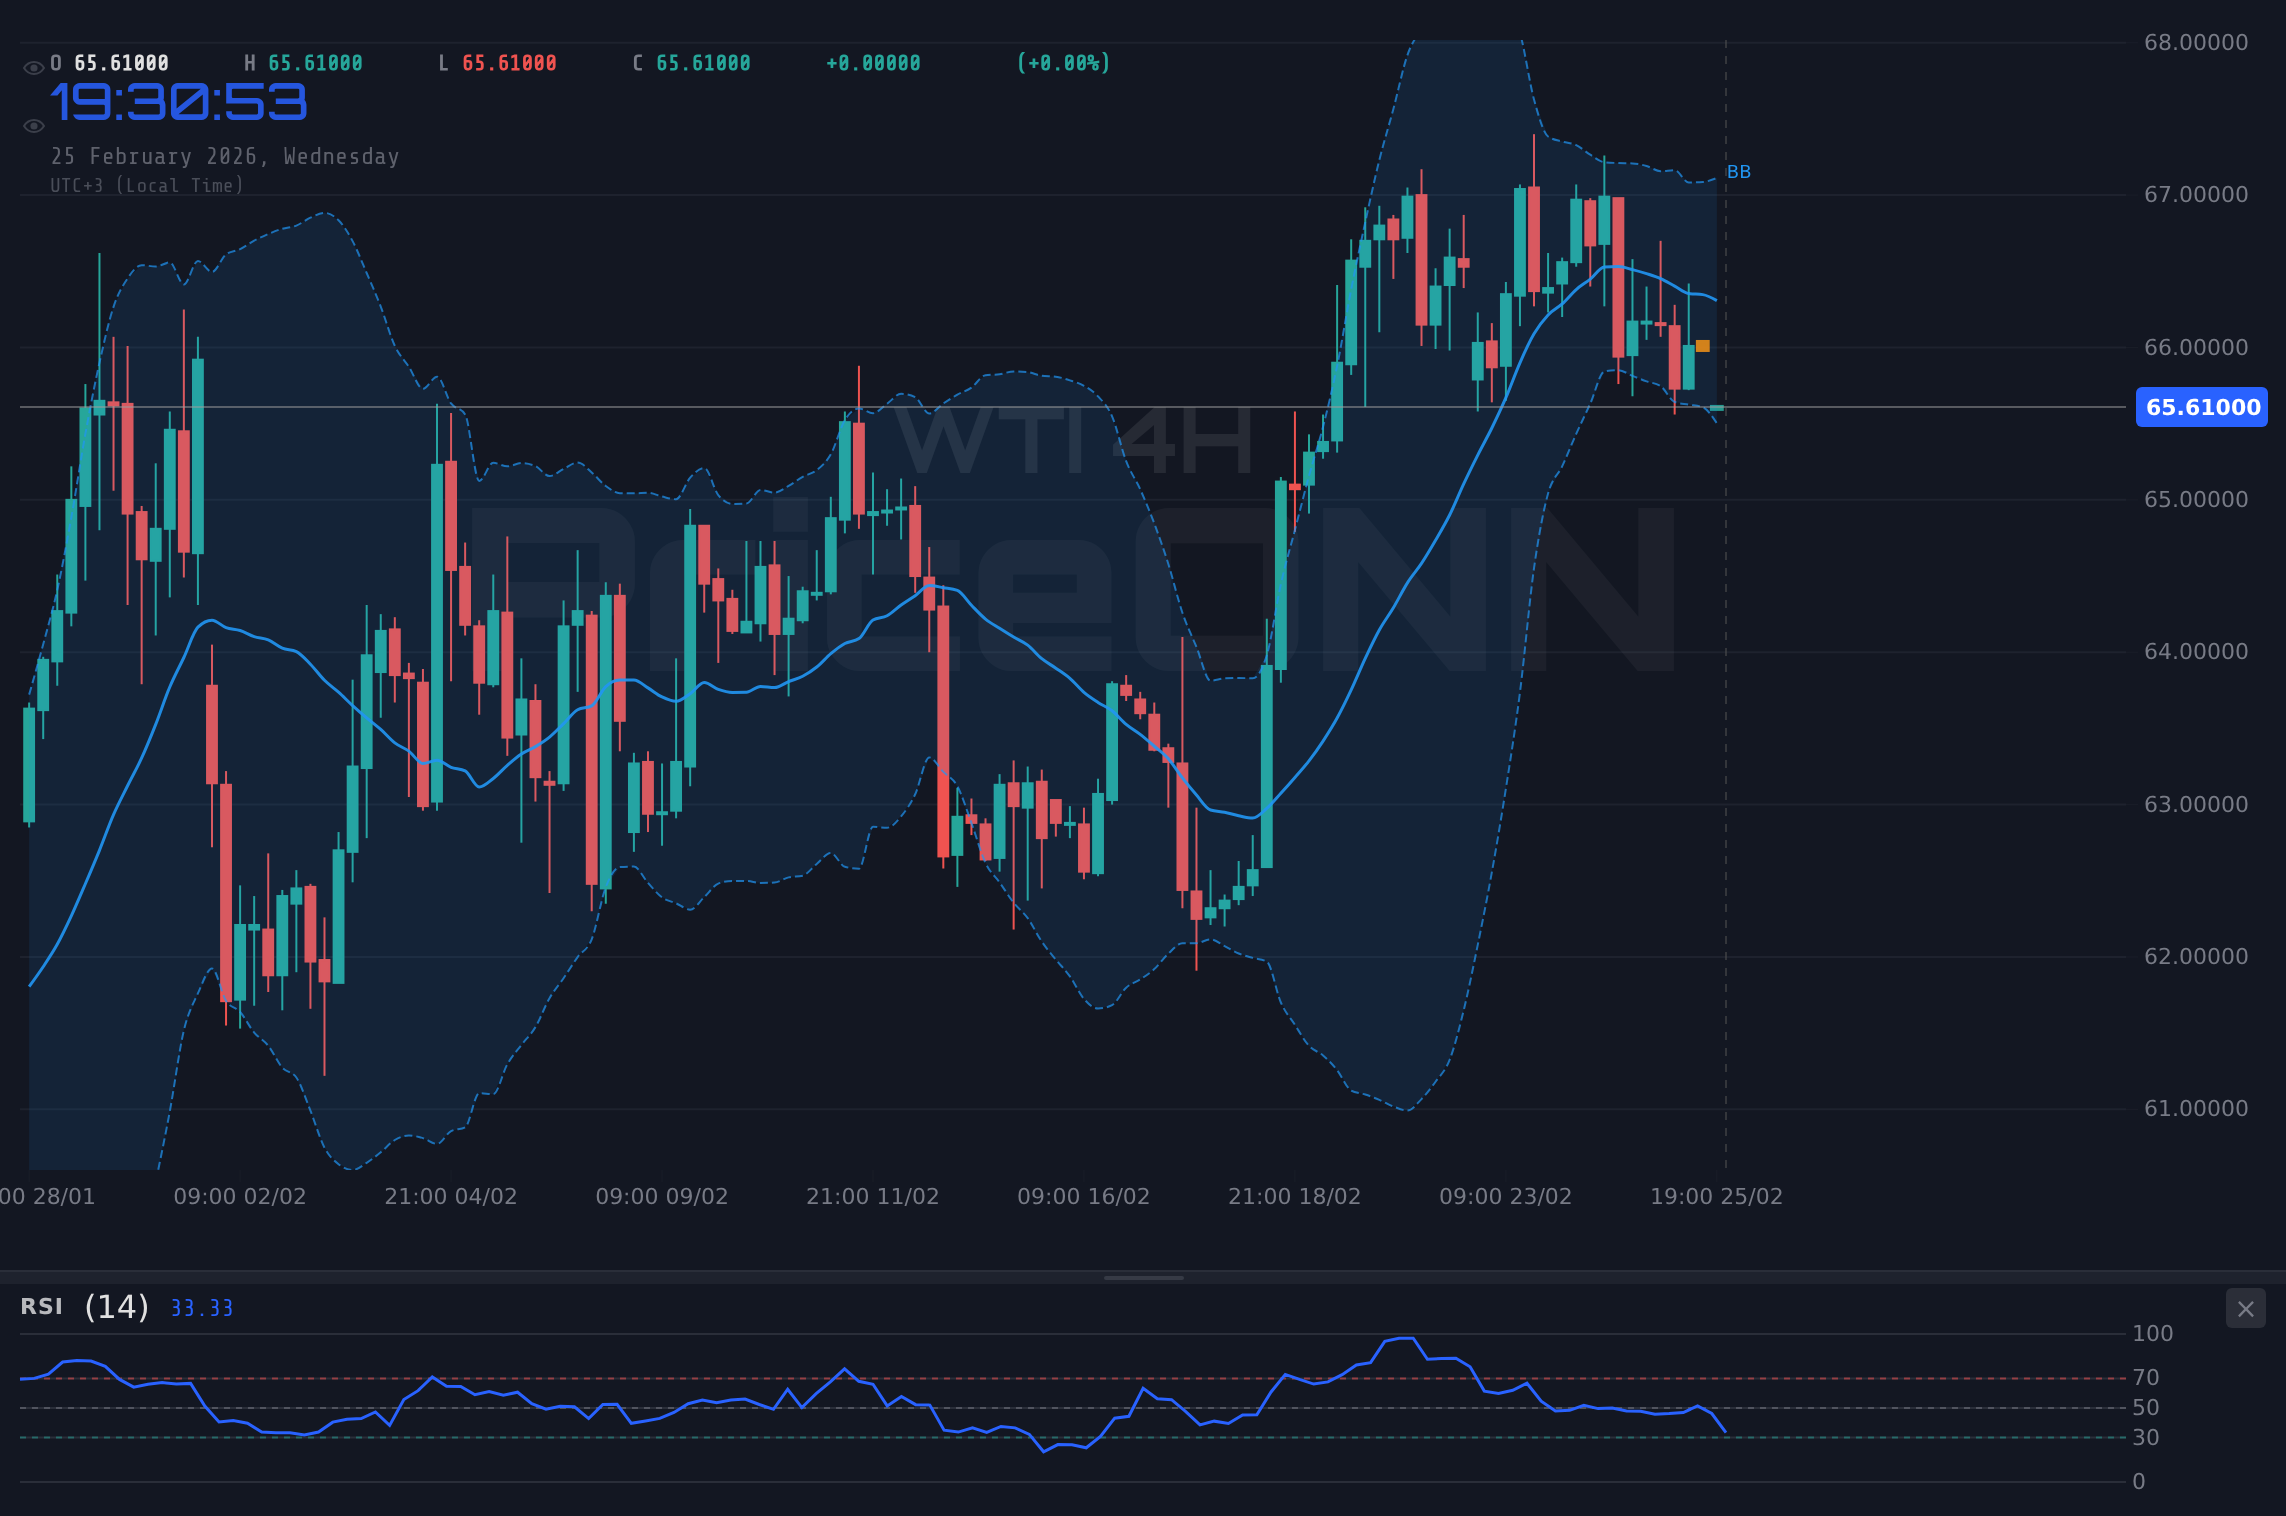
WTI is currently trading at $65.51, maintaining its bullish trend despite some recent volatility. The market is keenly awaiting upcoming economic data that could provide further direction. A confluence of technical factors suggests that the current levels could be pivotal for WTI's next move.
Having tracked WTI through various market cycles, it's evident that the current consolidation around $65.51 is significant. The 1H chart shows a neutral trend, with the ADX at a low 19.03, indicating weak trend strength. However, the RSI at 71.16 is nearing overbought territory, suggesting potential for a pullback. The MACD histogram, however, is still showing positive momentum, adding a layer of complexity to the near-term outlook.
The 4H chart paints a more bullish picture. Although the trend is neutral, the RSI at 62.33 indicates room for further upside before reaching overbought conditions. The MACD also supports the bullish sentiment with its positive momentum. A key level to watch is the resistance at $65.41. A breakout above this level could trigger a move towards $66.00, the upper end of the daily range.
On the daily timeframe, WTI's trend is bullish, with a strength of 89%. The RSI at 59.99 is comfortably in neutral territory, suggesting the rally has legs. The MACD is also showing positive momentum, reinforcing the overall bullish bias. Key support lies at $63.61, while resistance is at $65.42. A daily close above the resistance could open the door for a test of $66.36.
Zooming out, the broader macroeconomic context is crucial. As Reuters reported earlier this week, OPEC+ is expected to maintain its current production cuts, providing a floor for oil prices. The SP500 is up 0.57%, trading at 6925.55, indicating a risk-on environment that often supports oil prices. The DXY is showing some weakness, currently at 97.4, which typically provides a tailwind for WTI.
WTI's price action is also influenced by geopolitical factors. Tensions in the Middle East, as reported by Bloomberg, continue to add a risk premium to oil prices. Any escalation could lead to supply disruptions, further supporting WTI. It is worth noting that the EIA's weekly petroleum status report, due out later this week, could also impact WTI. A larger-than-expected draw in crude inventories could provide another boost for prices.
Now, let's talk about the key levels. Support 1 on the 1H chart is at $65.20. This level has been tested multiple times in recent sessions and has held firm. A break below this level could trigger a move towards Support 2 at $65.10. On the upside, Resistance 1 on the 1H chart is at $65.41. A break above this level could open the door for a test of Resistance 2 at $65.52. These levels are crucial for intraday traders.
For swing traders, the 4H chart offers valuable insights. Support 1 on the 4H chart is at $64.50. This level is significant because it coincides with the 50-day moving average. A break below this level could signal a trend reversal. On the upside, Resistance 1 on the 4H chart is at $65.01. A break above this level could trigger a move towards $65.22.
Long-term investors should focus on the daily chart. Support 1 on the daily chart is at $63.61. This level represents a key area of demand. A break below this level could lead to a deeper correction. On the upside, Resistance 1 on the daily chart is at $65.42. A break above this level could pave the way for a sustained rally.
Given the current technical picture and macroeconomic backdrop, a bullish trade plan seems appropriate. The ADX on the 4H chart is at 13.59, indicating a weak trend, but the RSI and MACD histogram are aligned, providing a clear directional signal. The Stochastic indicator is also in a tradeable zone, not signaling extreme overbought conditions. This setup presents a compelling opportunity for traders.
WTI breaks above the $65.41 resistance, triggering a move towards Target 1 at $66.36. Further momentum could see a test of Target 2 at $67.23.
If WTI fails to hold support at $65.20, a decline towards Target 1 at $63.61 becomes likely. A further breakdown could see a test of Target 2 at $62.74.
It's important to remember that markets are dynamic and that unexpected events can quickly change the narrative. For example, Wednesday's data release, as shown in the economic calendar, could significantly impact WTI. Stronger-than-expected CPI data could lead to a hawkish shift from the Fed, putting downward pressure on oil prices.
Moreover, the upcoming USD data, with a forecast of 1.8 and a previous of -9.014, and the USD data with a forecast of 217 and a previous of 206, will be critical to watch. The EUR data, with forecasts of 0.3 and 1.7, and previous values of 0 and 1.9, respectively, will also need to be monitored. These data points will greatly impact overall market sentiment and WTI's movement.
Having witnessed numerous economic cycles, the key is to remain flexible and adapt to changing conditions. Patient investors who wait for their setups and manage their risk effectively are often rewarded. The market always offers a second chance.
Frequently Asked Questions: WTI Analysis
Is WTI a good buy right now?
WTI at $65.51 shows bullish signals on the daily chart but is nearing overbought conditions on shorter timeframes. A cautious buy approach is recommended, waiting for a breakout above $65.41 with confirmation.
What is the WTI price forecast for this week?
The WTI price forecast for this week is to test the $66.36 resistance if the $65.41 level is breached. Failure to break higher could lead to a retest of the $63.61 support, with a 65% probability of the bullish scenario.
What are the key support and resistance levels for WTI?
Key support for WTI lies at $63.61, $65.10 and $65.20 while resistance is found at $65.41, $65.52 and $66.36. These levels are critical for both intraday and swing traders.
Why is WTI moving today?
WTI's movement today is influenced by a combination of factors including positive momentum, OPEC+ production cut expectations, and a slightly weaker DXY. Stronger-than-expected economic data could quickly change the narrative.
Technical Outlook Summary
| Indicator | Value | Signal |
|---|---|---|
| RSI (14) | 71.16 | Neutral |
| MACD Histogram | Positive | Bullish |
| Stochastic | 90.49/81.87 | Overbought |
| ADX | 19.03 | Weak Trend |
| Bollinger | Upper Band | Watch |
Key Levels
Support Levels
Resistance Levels
Track markets in real-time
AI-powered analysis, technical indicators and real-time price data.
Join Our Telegram Channel
Breaking market news, AI analysis and trading signals instantly.
Join Channel