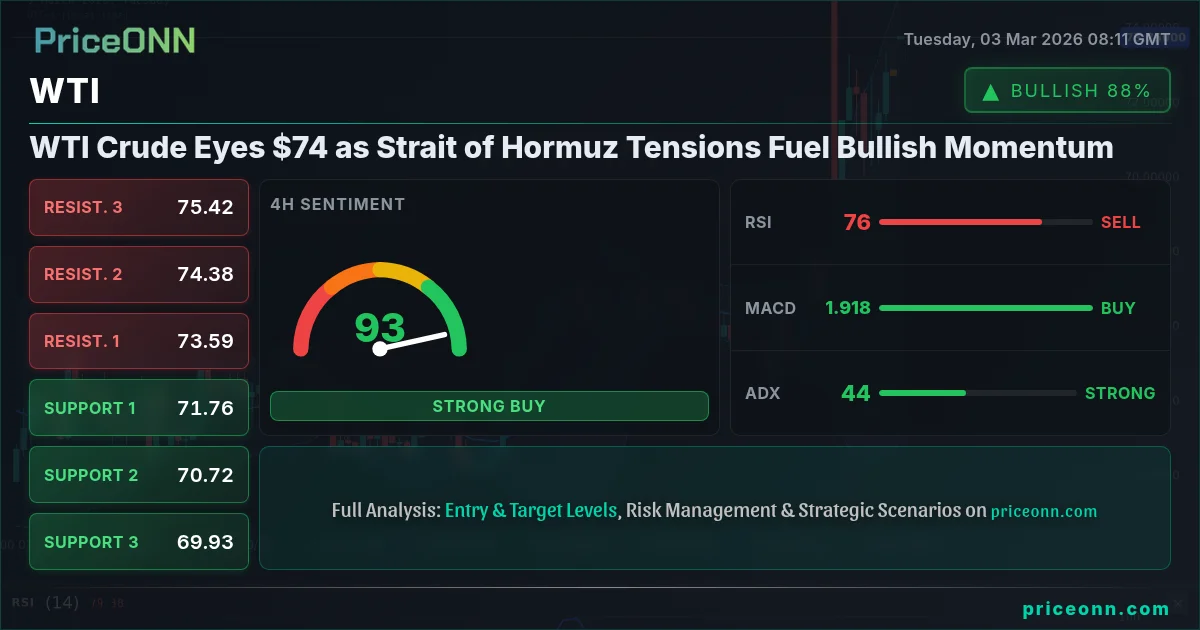
WTI Crude Eyes $74 as Strait of Hormuz Tensions Fuel Bullish Momentum
WTI crude oil price analysis today shows a surge to $74 amid rising tensions in the Strait of Hormuz. Technical indicators point to further upside potential, but watch for resistance.
WTI crude oil is currently trading at $74, a significant level that has caught the attention of traders and analysts alike. This price point, influenced by a confluence of geopolitical and technical factors, is a critical juncture for the energy market. The recent surge has been primarily driven by escalating tensions in the Strait of Hormuz, a vital chokepoint for global oil supplies. However, the technical picture also reveals compelling bullish signals, suggesting that this rally may have further to run. This article will delve into the technical analysis of WTI, examining key support and resistance levels, indicator readings, and potential trade scenarios. The goal is to provide a comprehensive crude oil price analysis today and offer actionable insights for different types of traders.
- RSI at 71.5 on the 1H chart indicates overbought conditions, suggesting a potential pullback.
- Key resistance lies at $74.24, a break above which could trigger further gains.
- MACD histogram shows strong positive momentum, supporting the bullish trend.
- Geopolitical risks in the Strait of Hormuz are a primary driver of WTI's recent surge.
The recent rally in WTI has been primarily fueled by escalating geopolitical tensions in the Middle East, specifically around the Strait of Hormuz. News reports indicate heightened military activity and increased threats to tanker traffic in the region, raising concerns about potential disruptions to global oil supplies. According to Reuters, "Escalating tensions in the Strait of Hormuz are driving up European energy costs, highlighting the continent's continued dependence on oil." This has created a risk premium in crude oil prices, as traders and investors anticipate potential supply shortages. The market is particularly sensitive to these developments, given the Strait's strategic importance for global oil flows. Any disruption in this area could have significant implications for energy markets worldwide.
From a technical perspective, WTI's price action is exhibiting several bullish signals. On the 1-hour chart, the Relative Strength Index (RSI) is currently at 71.5, indicating overbought conditions. While this suggests the possibility of a short-term pullback, it also reflects strong buying pressure. The Moving Average Convergence Divergence (MACD) histogram shows positive momentum, further supporting the bullish trend. The ADX (Average Directional Index) stands at 35.21 on the 1H chart, confirming a strong uptrend. However, the Stochastic oscillator is also in overbought territory, with K=89.61 and D=83.35, suggesting that the market may be due for a period of consolidation. The interplay of these indicators suggests a complex picture, where short-term overbought conditions are set against a backdrop of strong underlying bullish momentum.
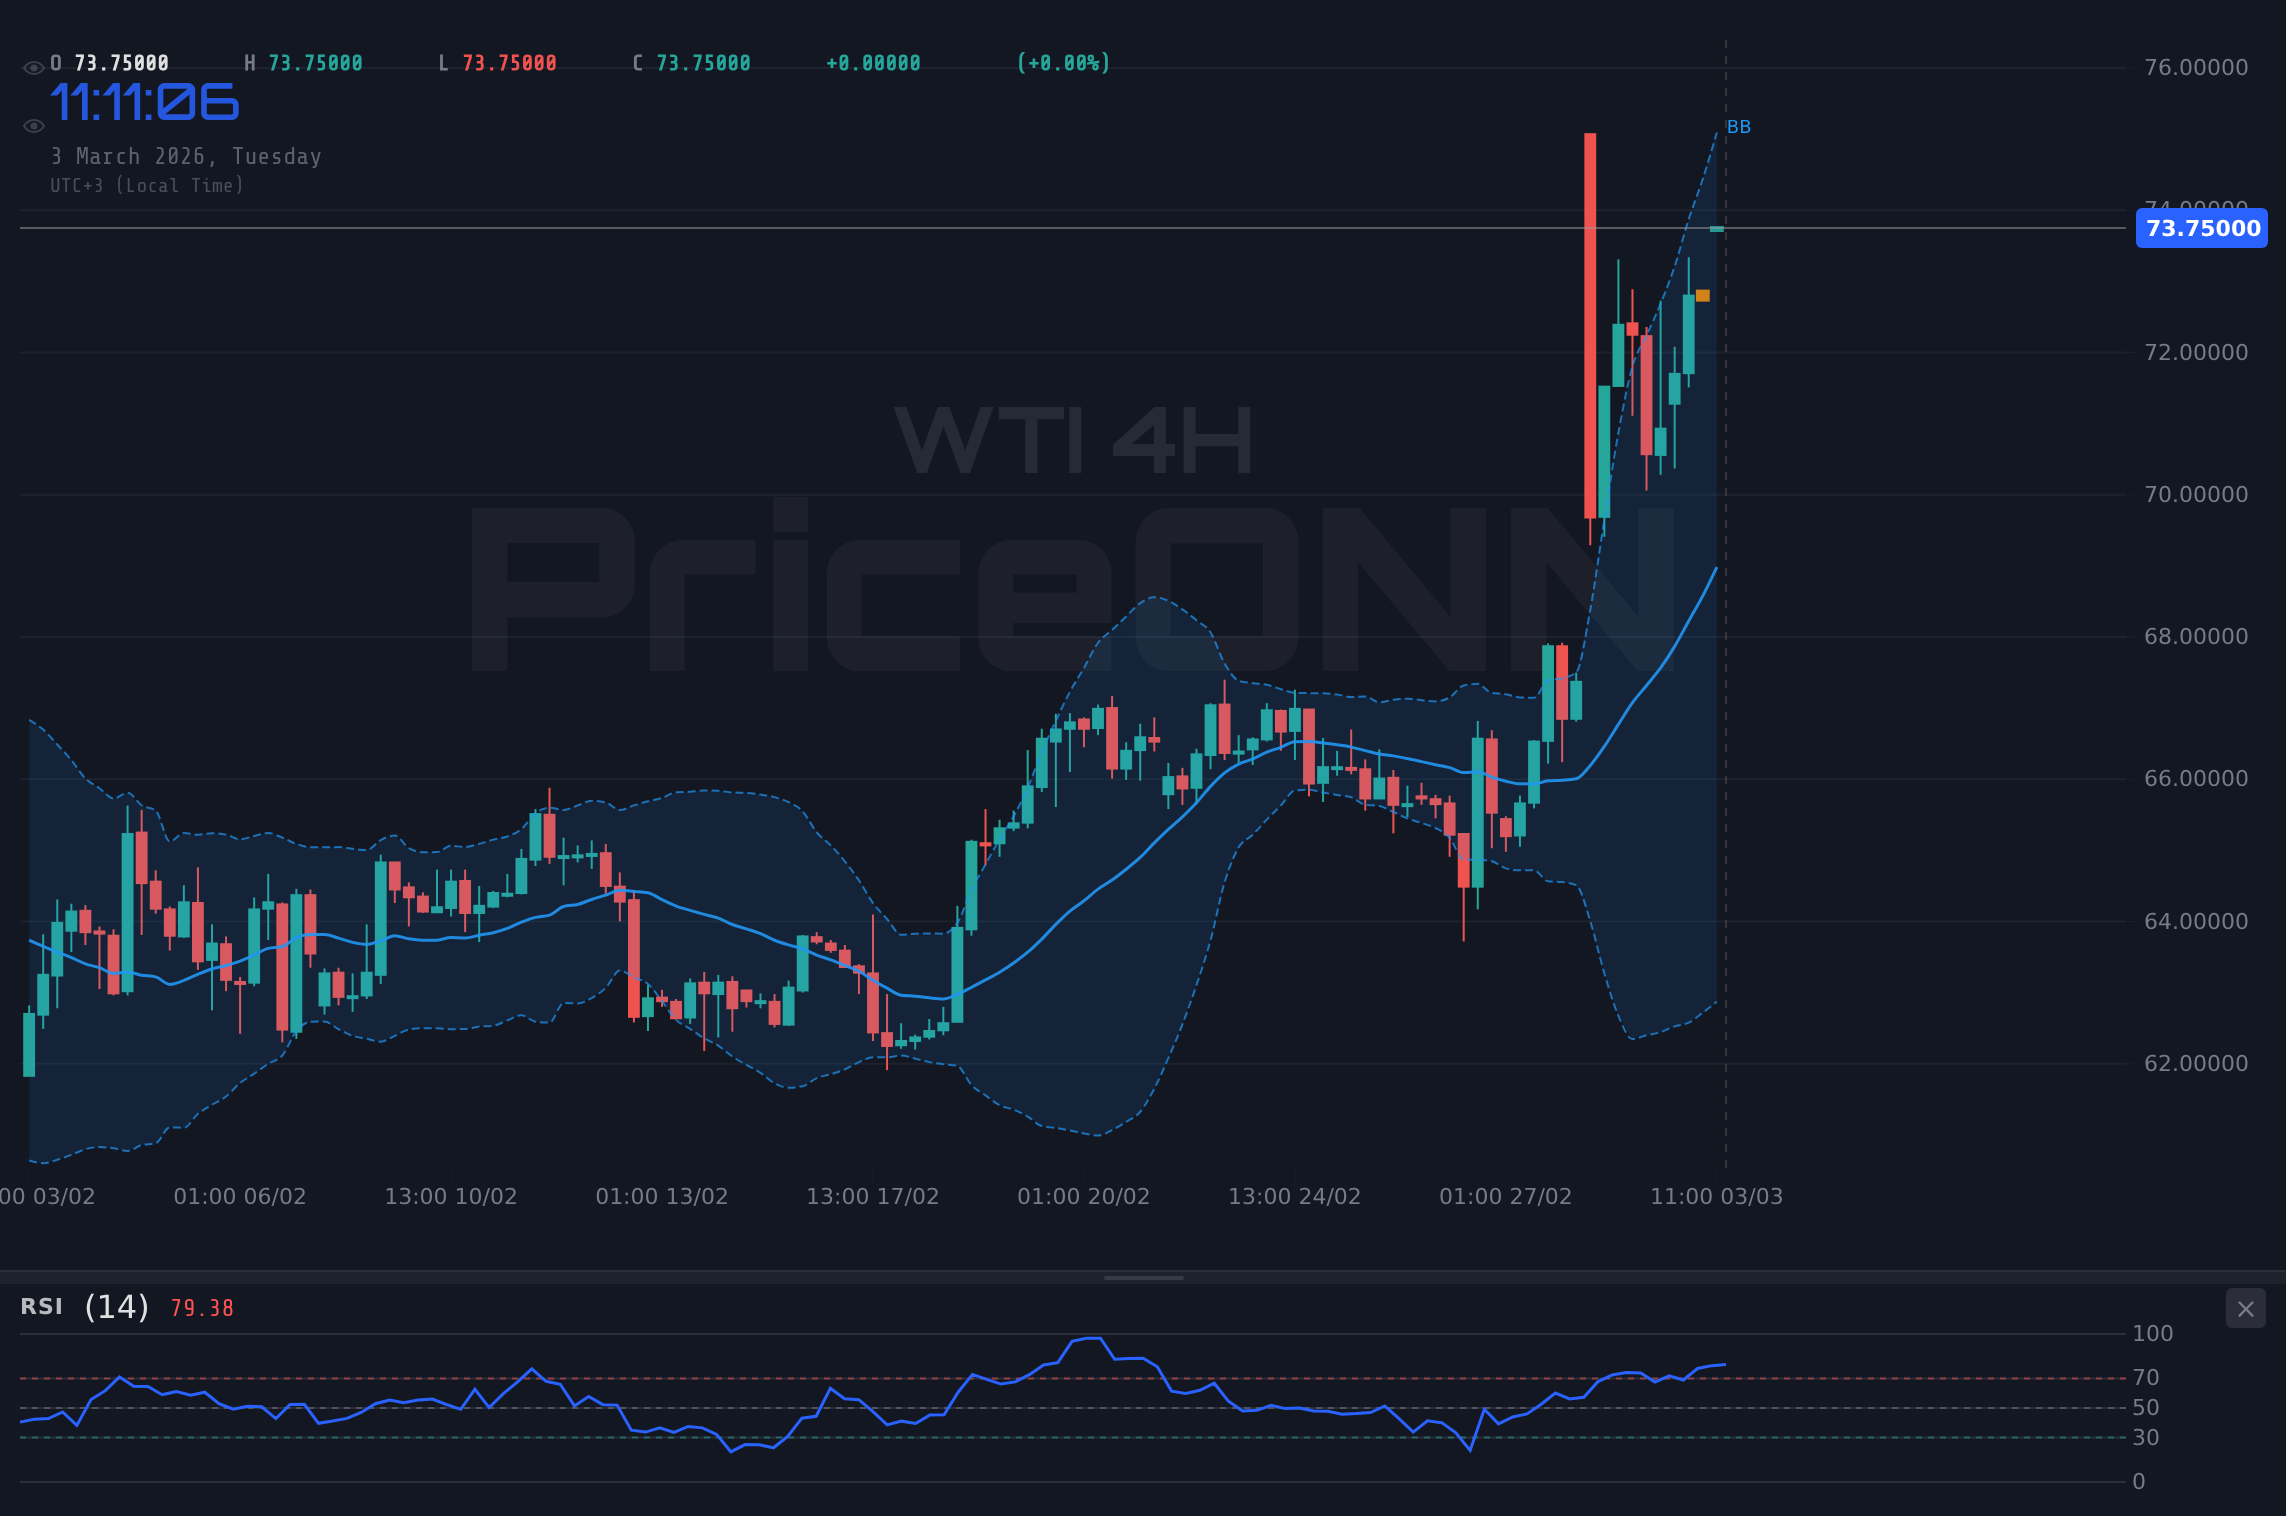
Zooming out to the 4-hour chart, the technical outlook remains largely positive. The RSI is at 73.13, also indicating overbought conditions, but with room to run before reaching extreme levels. The MACD continues to show positive momentum, and the ADX is at 41.72, signaling a robust uptrend. The Stochastic oscillator is at 67.37, suggesting that the market is not as overbought as the 1-hour chart indicates. This multi-timeframe analysis reveals a consistent bullish bias, with short-term overbought conditions potentially offering opportunities for strategic entries. The key here is to watch for confirmation signals, such as a break above key resistance levels or a pullback to support followed by renewed buying pressure.
Looking at the daily chart, WTI's uptrend is even more apparent. The RSI is at 76.33, indicating that the market is nearing overbought territory, but the MACD remains strongly positive, and the ADX is at 28.69, confirming a solid uptrend. The Stochastic oscillator is at 83.08, reflecting strong buying pressure. The key resistance level to watch on the daily chart is $74.24, a level that has acted as a ceiling in the past. A decisive break above this level could pave the way for further gains, potentially targeting the $77.54 and $80.02 levels. Conversely, key support lies at $68.46, a level that buyers have defended in recent weeks. A breakdown below this support could signal a shift in the market's dynamics.
For scalpers, the immediate focus is on the $74 level. A break above this resistance could trigger a quick move to $74.24, offering short-term profit opportunities. However, given the overbought conditions on the 1-hour chart, scalpers should be prepared for potential pullbacks. Swing traders, on the other hand, may look for opportunities to enter on dips, targeting the $77.54 level. A pullback to the $72.52 or $72.02 support levels could provide attractive entry points. Long-term investors should focus on the broader fundamental picture, assessing the impact of geopolitical risks and supply-demand dynamics. A sustained break above $74.24 could signal a longer-term bullish trend, potentially justifying strategic long positions.
The correlation analysis reveals that WTI is currently exhibiting a positive correlation with risk sentiment and a negative correlation with the DXY (Dollar Index). As the SP500 is down -1.06% and the Nasdaq100 is down -1.31%, we can infer that risk appetite is declining. However, WTI is bucking this trend, suggesting that geopolitical factors are overriding broader market dynamics. With the DXY at 98.59, the strengthening dollar would typically put downward pressure on crude oil prices. However, the Strait of Hormuz tensions are mitigating this effect, underscoring the importance of geopolitical risks in the current market environment. This decoupling from typical correlations highlights the unique circumstances driving WTI's price action.
From a fundamental perspective, the upcoming economic data releases could have a significant impact on WTI prices. On Wednesday, March 4th, the U.S. ADP Nonfarm Employment Change and U.S. Services Purchasing Managers Index (PMI) will be released. Strong economic data could support the bullish narrative, while weak data could trigger a pullback. On Thursday, March 5th, the U.S. Initial Jobless Claims will be released, providing further insights into the labor market. These data points will be closely watched by traders and investors, as they could influence the Federal Reserve's monetary policy decisions. Additionally, the United Kingdom Spring Forecast Statement and Eurozone Consumer Price Index (CPI) YoY, both scheduled for release today, could impact global economic sentiment and indirectly affect WTI prices.
The current price action in WTI presents a compelling trade setup, but it's essential to have a well-defined trade plan. Given the strong uptrend and the potential for further gains, a bullish scenario seems most likely. However, it's crucial to acknowledge the risks and implement appropriate risk management strategies. A potential trade plan could involve entering long positions on pullbacks to support levels, targeting key resistance levels as profit targets, and setting stop-loss orders to protect against unexpected downside risks. This approach allows traders to capitalize on the bullish momentum while managing potential losses.
Continued geopolitical tensions push WTI above $74.24, targeting $77.54 and potentially $80.02. Strong economic data supports bullish momentum.
Easing geopolitical tensions and weak economic data trigger a pullback to $68.46, potentially extending to $65.98 and $62.68.
Historically, similar geopolitical events have led to significant spikes in crude oil prices, but these rallies have often been followed by sharp corrections. Traders should be mindful of this historical context and avoid complacency. The market is likely to remain volatile in the near term, as geopolitical risks and economic data continue to influence price action. The key is to stay informed, adapt to changing market conditions, and manage risk effectively. The "Strait of Hormuz Crisis: Will Europe Ever Break Free From Oil Dependence?" highlights Europe's vulnerability to such events. While Brazil's increased oil production, as reported by "Brazil Oil Production Forecast: How OPEC+ Membership Impacts Growth", could alleviate some supply concerns, the immediate impact on prices will likely be driven by geopolitical factors.
Frequently Asked Questions: WTI Analysis
Is WTI a good buy right now?
WTI presents a potential buying opportunity, especially on pullbacks to support levels like $72.52, given the strong uptrend. However, overbought conditions and geopolitical risks warrant caution. A break above $74.24 would confirm further upside potential.
What is the WTI price forecast for this week?
The WTI price forecast for this week is bullish, with potential targets at $77.54 and $80.02, assuming geopolitical tensions remain elevated. A break below $72.52 could invalidate this forecast. A 65% probability is assigned to the bullish scenario.
What are the key support and resistance levels for WTI?
Key support levels for WTI are $72.52, $72.02, and $68.46. Key resistance levels are $74.24, $77.54, and $80.02. These levels should be closely monitored for potential breakouts or breakdowns.
Why is WTI moving today?
WTI is moving higher today primarily due to escalating tensions in the Strait of Hormuz, raising concerns about potential supply disruptions. Bullish technical indicators and positive momentum are also contributing factors.
Technical Outlook Summary
| Indicator | Value | Signal |
|---|---|---|
| RSI (14) | 71.5 | Overbought |
| MACD Histogram | Positive | Bullish |
| Stochastic | 89.61/83.35 | Overbought |
| ADX | 35.21 | Strong Trend |
| Bollinger | Upper Band | Watch |
Key Levels
Support Levels
Resistance Levels
Track markets in real-time
AI-powered analysis, technical indicators and real-time price data.
Join Our Telegram Channel
Breaking market news, AI analysis and trading signals instantly.
Join Channel