WTI Crude Oil Eyes $100 as Geopolitical Risk Fuels Rally at $96.70
WTI crude oil surges towards $100, currently trading at $96.70, fueled by escalating geopolitical tensions and supply concerns. Will it break through?
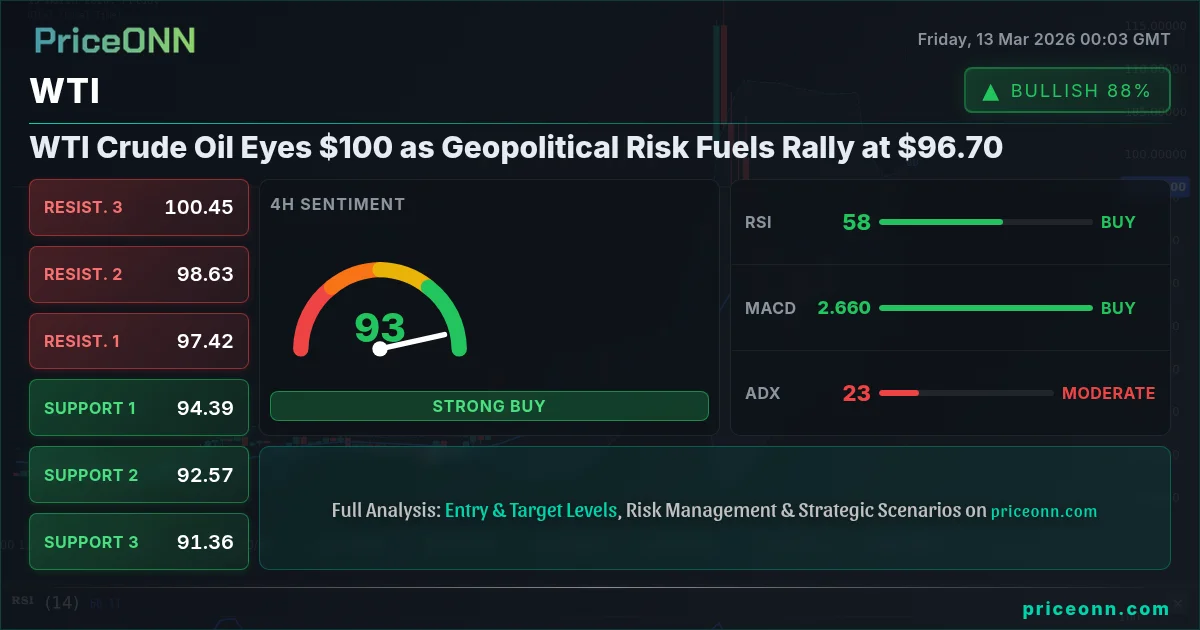
WTI crude oil is making a significant move, currently trading at $96.70, propelled by escalating geopolitical tensions in the Middle East and renewed concerns about global supply. This surge comes despite recent efforts to increase production, highlighting the profound impact of geopolitical factors on the energy market. The question now is: can WTI sustain this momentum and break through the psychological barrier of $100?
- RSI at 64.87 on the 1-hour chart indicates increasing buying pressure, but not yet in overbought territory.
- Key resistance lies at $97.45, a break above which could signal further upside towards $100.
- MACD histogram on the daily chart shows positive momentum, supporting the bullish trend.
- Geopolitical tensions are the primary driver, outweighing any supply increases in the short term.
The current rally in WTI is largely attributed to escalating tensions in the Middle East, particularly involving Iran, as reported by multiple news outlets. According to Reuters, the potential for supply disruptions in the Strait of Hormuz has sent shockwaves through the oil market, triggering a wave of speculative buying. This geopolitical risk premium is adding significant upward pressure on prices, overshadowing the impact of increased production from other regions. The market is closely monitoring developments in the region, with any further escalation likely to exacerbate supply concerns and fuel further price increases.
From a technical perspective, WTI's price action is painting an increasingly bullish picture. The 1-hour chart reveals a strong upward trend, with the price consistently making higher highs and higher lows. The RSI, currently at 64.87, suggests that the market is not yet overbought, leaving room for further upside. However, the Stochastic indicator on the 4-hour chart is nearing overbought territory with K=90.14 and D=83.47, indicating a potential for a short-term pullback. The ADX on the daily chart is at a robust 47.67, confirming the strength of the current uptrend. Scalpers might look for intraday pullbacks to the $95.13 support level for potential long entries, while swing traders will be watching for a break above the $97.45 resistance level to confirm the continuation of the rally.
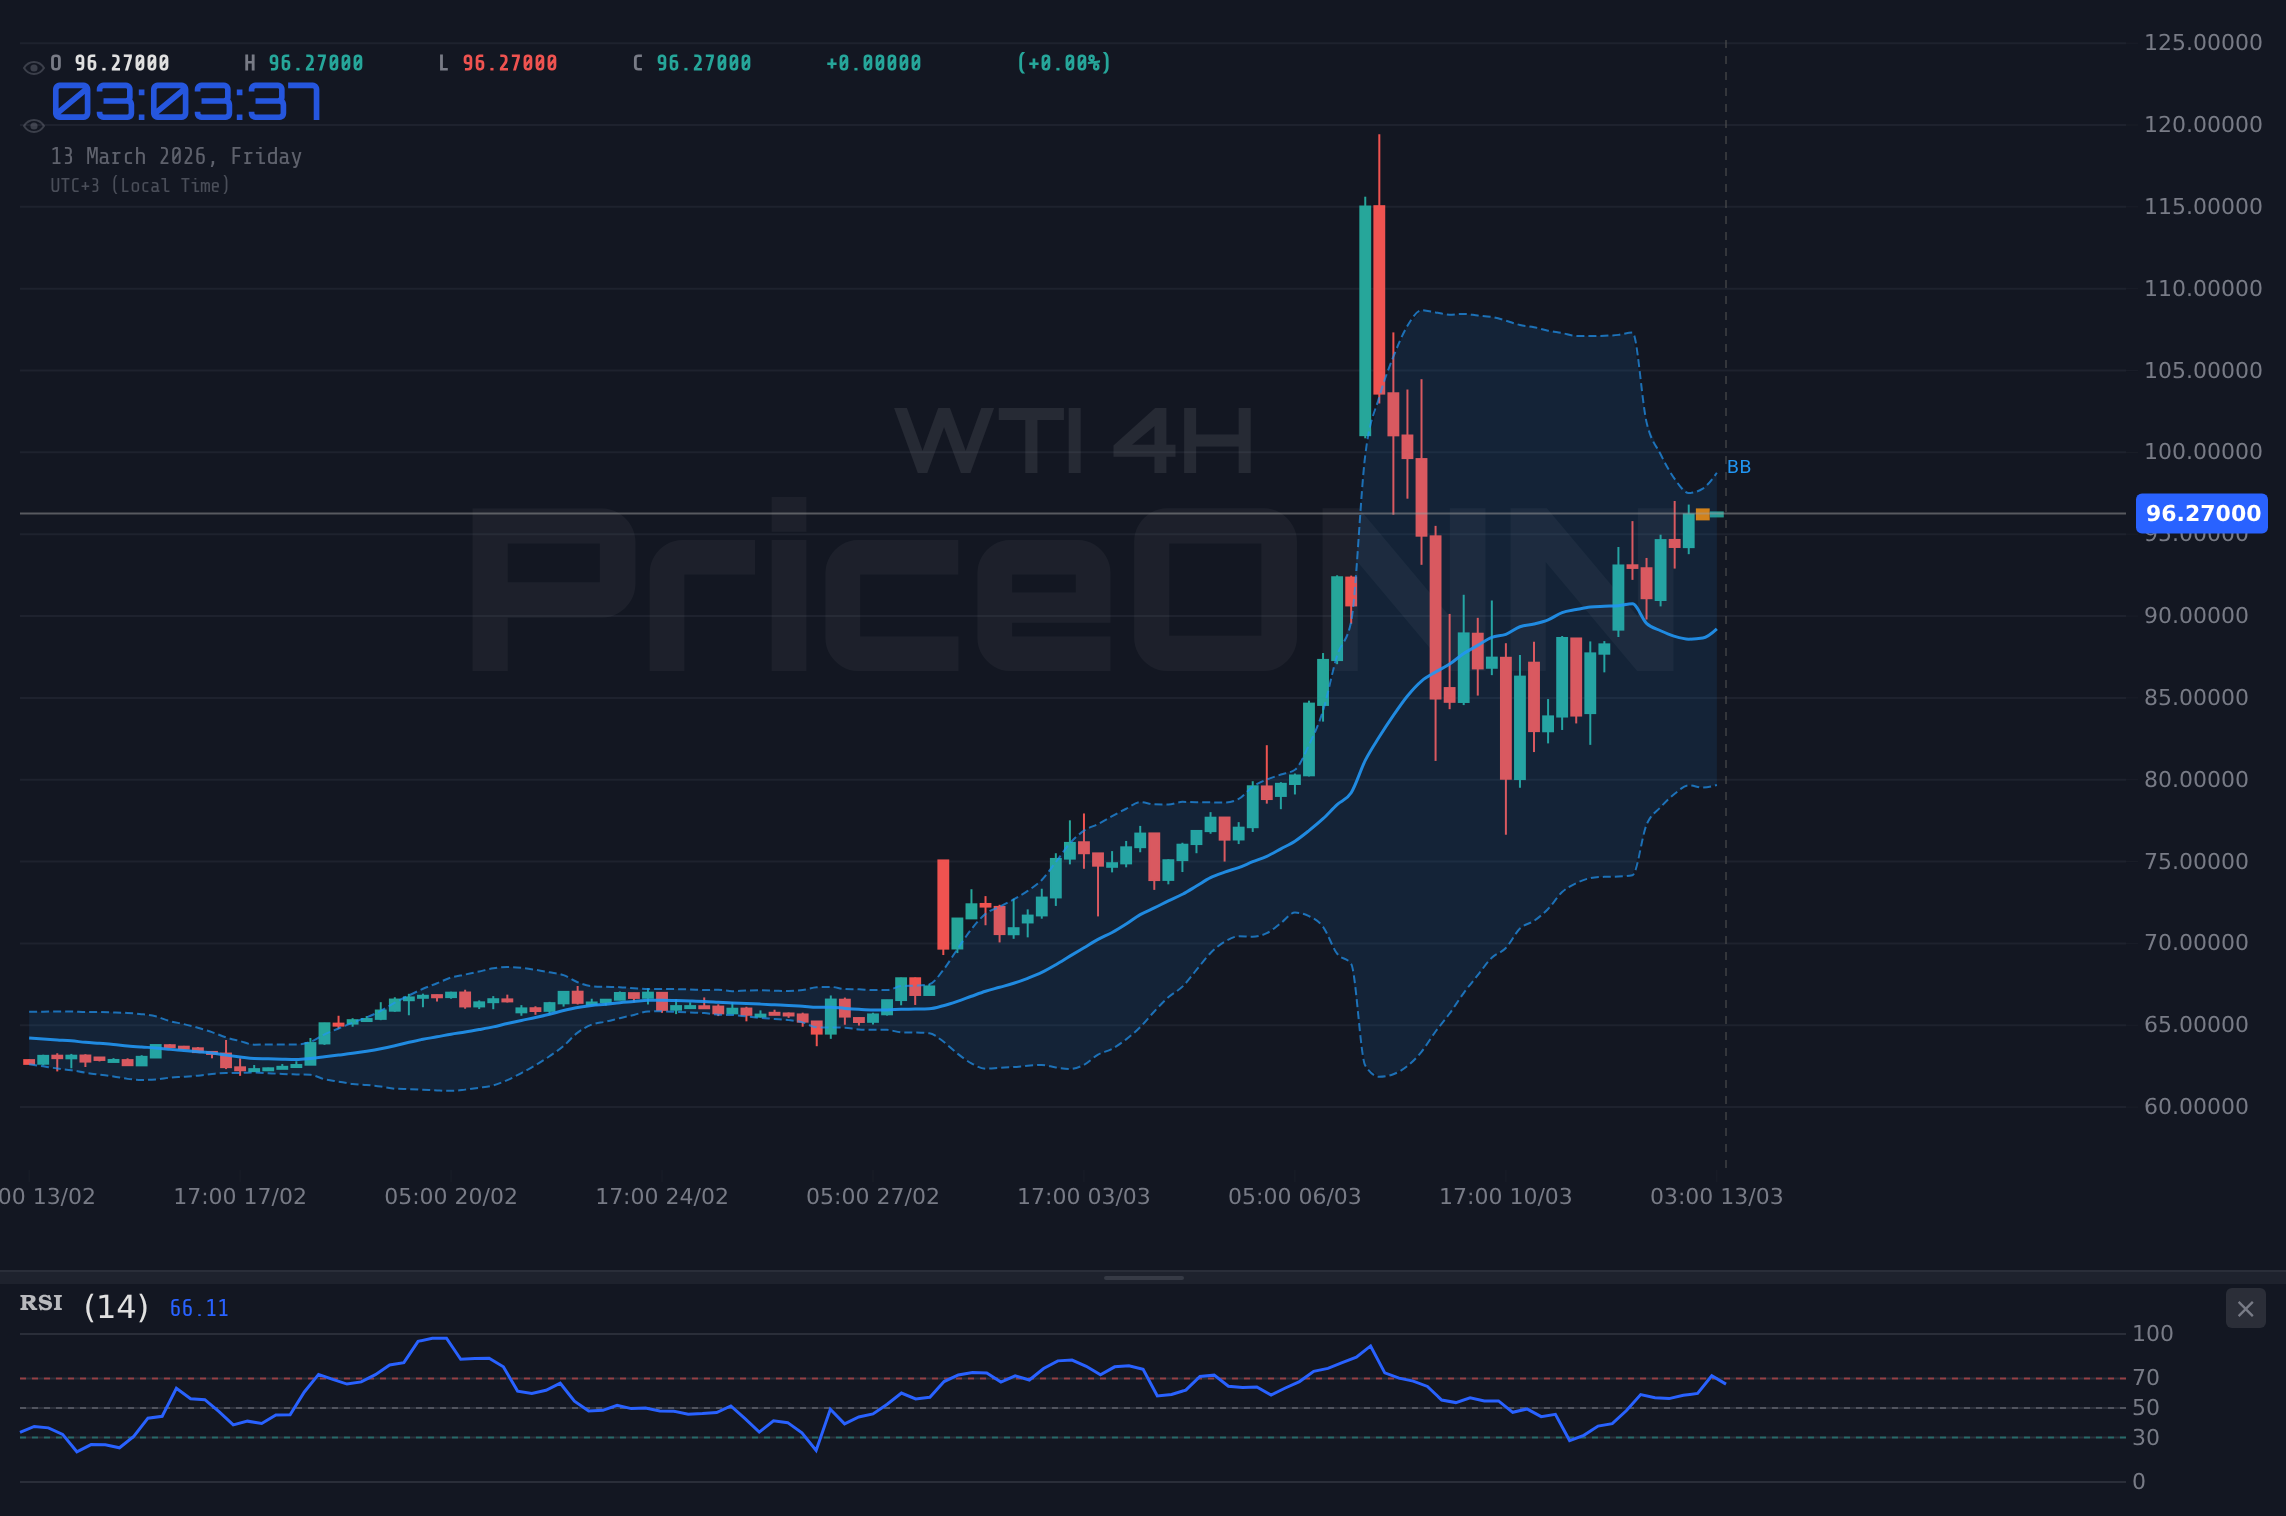
Key resistance levels to watch include $97.45 on the 1-hour chart and $98.83 on the 4-hour chart. A decisive break above these levels could pave the way for a test of the psychological $100 mark. On the downside, immediate support lies at $95.13 on the 1-hour chart, followed by $94.19. A break below these support levels could signal a potential trend reversal and trigger a deeper correction. The 1-day chart shows a strong resistance at $97.89, which if broken, can lead to a further rally. Long-term investors should monitor the $83.71 support level for potential buying opportunities during pullbacks.
The recent surge in WTI prices is also being influenced by movements in the broader financial markets. The dollar index (DXY), currently trading at 99.53, is showing significant strength, potentially capping some of the upside in WTI. Historically, a stronger dollar tends to exert downward pressure on commodity prices, as it makes them more expensive for international buyers. However, the overriding factor at play here is the geopolitical risk premium, which is currently outweighing the impact of the stronger dollar. Additionally, the SP500 is down by 1.34%, indicating a risk-off sentiment in the market, which could further support safe-haven assets like oil.
Furthermore, the CAD/JPY news is also relevant. According to keyword intelligence, the CAD JPY news, Bank of Canada, Bank of Japan, and oil prices are closely intertwined. The rising oil prices could strengthen the Canadian dollar, affecting the CAD/JPY pair. Traders should keep an eye on the Bank of Canada and Bank of Japan policies as these factors can influence the currency pair significantly. The trend analysis suggests that the oil surge and CAD strength might push CAD/JPY higher, but traders should also consider the monetary policies of both countries.
The economic calendar also plays a crucial role in shaping WTI's price trajectory. The upcoming GBP data release on Friday, March 13th, will provide insights into the UK's economic health, potentially influencing global risk sentiment and indirectly impacting oil prices. Similarly, the USD data releases on Friday, March 13th, including inflation figures and consumer spending data, will be closely watched for clues about the Federal Reserve's future monetary policy decisions. A stronger-than-expected inflation reading could prompt the Fed to adopt a more hawkish stance, potentially leading to a stronger dollar and downward pressure on oil prices.
Taking a historical perspective, similar geopolitical events in the past have often led to sharp spikes in oil prices, followed by periods of consolidation and eventual correction. For instance, the 1990 Iraqi invasion of Kuwait triggered a rapid doubling of oil prices, but the subsequent resolution of the crisis led to a sharp decline. This historical pattern suggests that the current rally in WTI may be unsustainable in the long term, particularly if geopolitical tensions ease. However, in the short term, the market is likely to remain highly volatile and sensitive to any further developments in the Middle East.
Given the current technical and fundamental backdrop, a cautiously bullish stance on WTI appears justified. The positive momentum and robust trend strength suggest that the rally has further to run, but the potential for a short-term pullback and the longer-term risk of a correction warrant a prudent approach. Traders should closely monitor key support and resistance levels, as well as developments in the Middle East, to make informed trading decisions. The current ADX of 22.73 indicates a moderate trend, suggesting that the price is not excessively overbought or oversold, making it a favorable environment for trend-following strategies.
A decisive break above the $97.45 resistance level could trigger a further rally towards $100 and beyond. A successful breach of $100 could open the door to higher targets, potentially reaching $103.11.
A failure to break above $97.45 could lead to a pullback towards the $95.13 support level. A break below this level could trigger a deeper correction towards $94.19 and potentially $92.81.
For scalpers, the immediate focus should be on intraday price action and short-term momentum indicators. Look for opportunities to buy pullbacks towards support levels and sell rallies towards resistance levels. Swing traders should focus on identifying clear breakout patterns and trend continuations, using stop-loss orders to manage risk. Long-term investors should focus on the fundamental drivers of oil prices, such as geopolitical risks, supply and demand dynamics, and the global economic outlook, and consider accumulating positions during periods of weakness.
WTI crude oil is currently trading at a critical juncture, with geopolitical tensions and technical factors pointing towards further upside potential. However, traders should remain vigilant and closely monitor key support and resistance levels, as well as developments in the Middle East, to make informed trading decisions. The combination of strong upward momentum and increasing geopolitical risk suggests that WTI could indeed test the $100 mark in the near term, but a cautious and disciplined approach is essential to navigate the inherent volatility of the oil market.
Frequently Asked Questions: WTI Analysis
What happens if WTI breaks above $97.45 resistance?
A break above the $97.45 resistance level could signal a continuation of the current bullish trend, paving the way for a test of the psychological $100 mark. The 1-hour RSI at 64.87 suggests there is still room for upside momentum.
Should I buy WTI at current levels of $96.70 given the geopolitical risks?
Given the geopolitical tensions, a cautiously bullish approach is warranted. Consider a long entry with a stop-loss order below the $95.13 support level to manage risk, targeting the $97.45 resistance level for profit-taking.
Is RSI at 64.87 a buy signal for WTI right now?
While an RSI of 64.87 suggests increasing buying pressure, it is not yet in overbought territory, indicating there is still room for further upside. However, traders should also consider other indicators, such as the Stochastic, which is nearing overbought levels on the 4-hour chart.
How will the upcoming USD data releases on Friday affect WTI this week?
The upcoming USD data releases, including inflation figures and consumer spending data, will be closely watched for clues about the Federal Reserve's future monetary policy decisions. A stronger-than-expected inflation reading could prompt the Fed to adopt a more hawkish stance, potentially leading to a stronger dollar and downward pressure on oil prices.
Technical Outlook Summary
| Indicator | Value | Signal |
|---|---|---|
| RSI (14) | 65.23 | Neutral |
| MACD Histogram | Positive | Bullish |
| Stochastic | 95.87/76.48 | Bullish |
| ADX | 20.91 | Moderate Trend |
| Bollinger | Upper Band | Watch |
Key Levels
Support Levels
Resistance Levels
Track markets in real-time
AI-powered analysis, technical indicators and real-time price data.
Join Our Telegram Channel
Breaking market news, AI analysis and trading signals instantly.
Join Channel