WTI Eyes $75.75 as Hormuz Tensions Fuel Oil Surge
WTI crude oil is trading near $75.75 amid rising geopolitical tensions in the Strait of Hormuz. Supply risks and tanker rate hikes are pushing prices higher, impacting global energy markets.
WTI crude oil is currently trading at $75.75, buoyed by escalating tensions surrounding the Strait of Hormuz. The energy market is on edge as geopolitical risks and surging tanker rates combine to create a bullish environment for oil. Is this rally sustainable, or will it face headwinds from economic data and shifting market sentiment? A close look at the technical indicators provides valuable insights.
- WTI at $75.75 is showing strong upward momentum, driven by supply concerns.
- Immediate resistance lies at $77.45, a level to watch for potential breakouts.
- The ADX at 47.28 indicates a strong uptrend, suggesting continued bullish pressure.
- U.S. Crude Oil Inventories data later today could impact short-term price action.
The surge in WTI oil price forecast 2026 is largely attributable to fears that escalating regional conflicts could disrupt crude oil shipments through the Strait of Hormuz, a critical chokepoint for global energy supplies. Reuters recently reported increased naval activity in the area, exacerbating supply concerns. This geopolitical backdrop is providing a solid floor for oil prices, as traders price in the heightened risk of supply disruptions. The geopolitical risks drive Euro inflation concerns as well, impacting other currency outlooks.
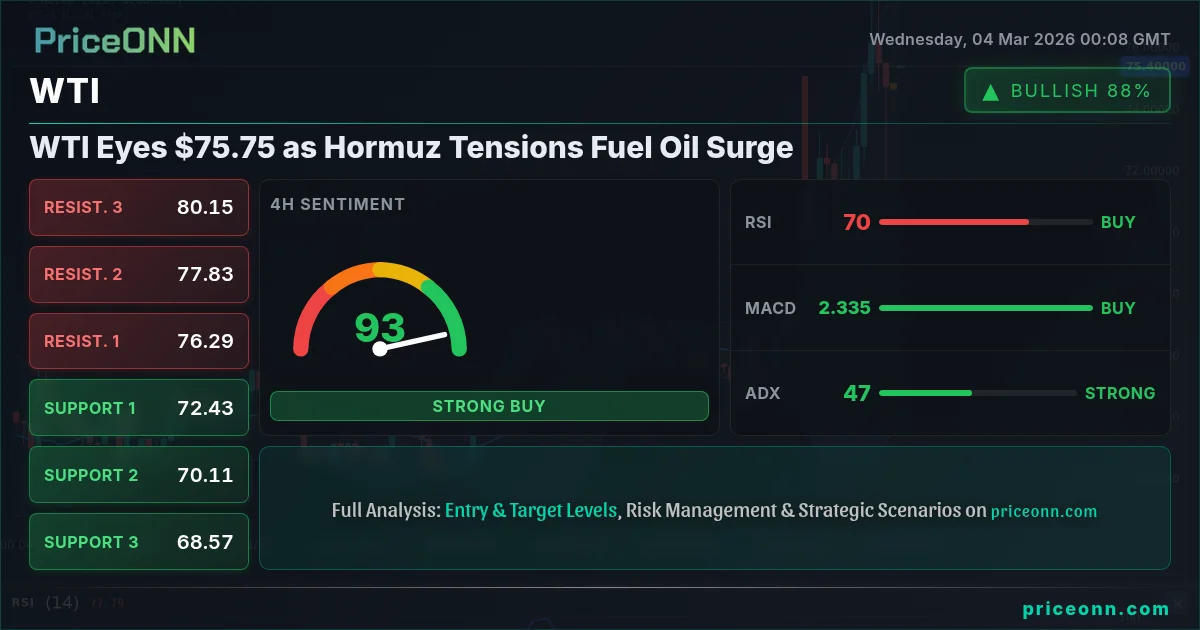
From a technical standpoint, WTI's one-hour chart displays a neutral trend. Immediate support can be found at $74.12, $73.49, and $73.02. Resistance levels are observed at $75.22, $75.69, and $76.32. The Relative Strength Index (RSI) is at 59.76, sitting in neutral territory, suggesting the market isn't yet overbought. The Moving Average Convergence Divergence (MACD) displays negative momentum. The stochastic oscillator currently reads K=50.82 and D=40.34, pointing to bullish momentum.
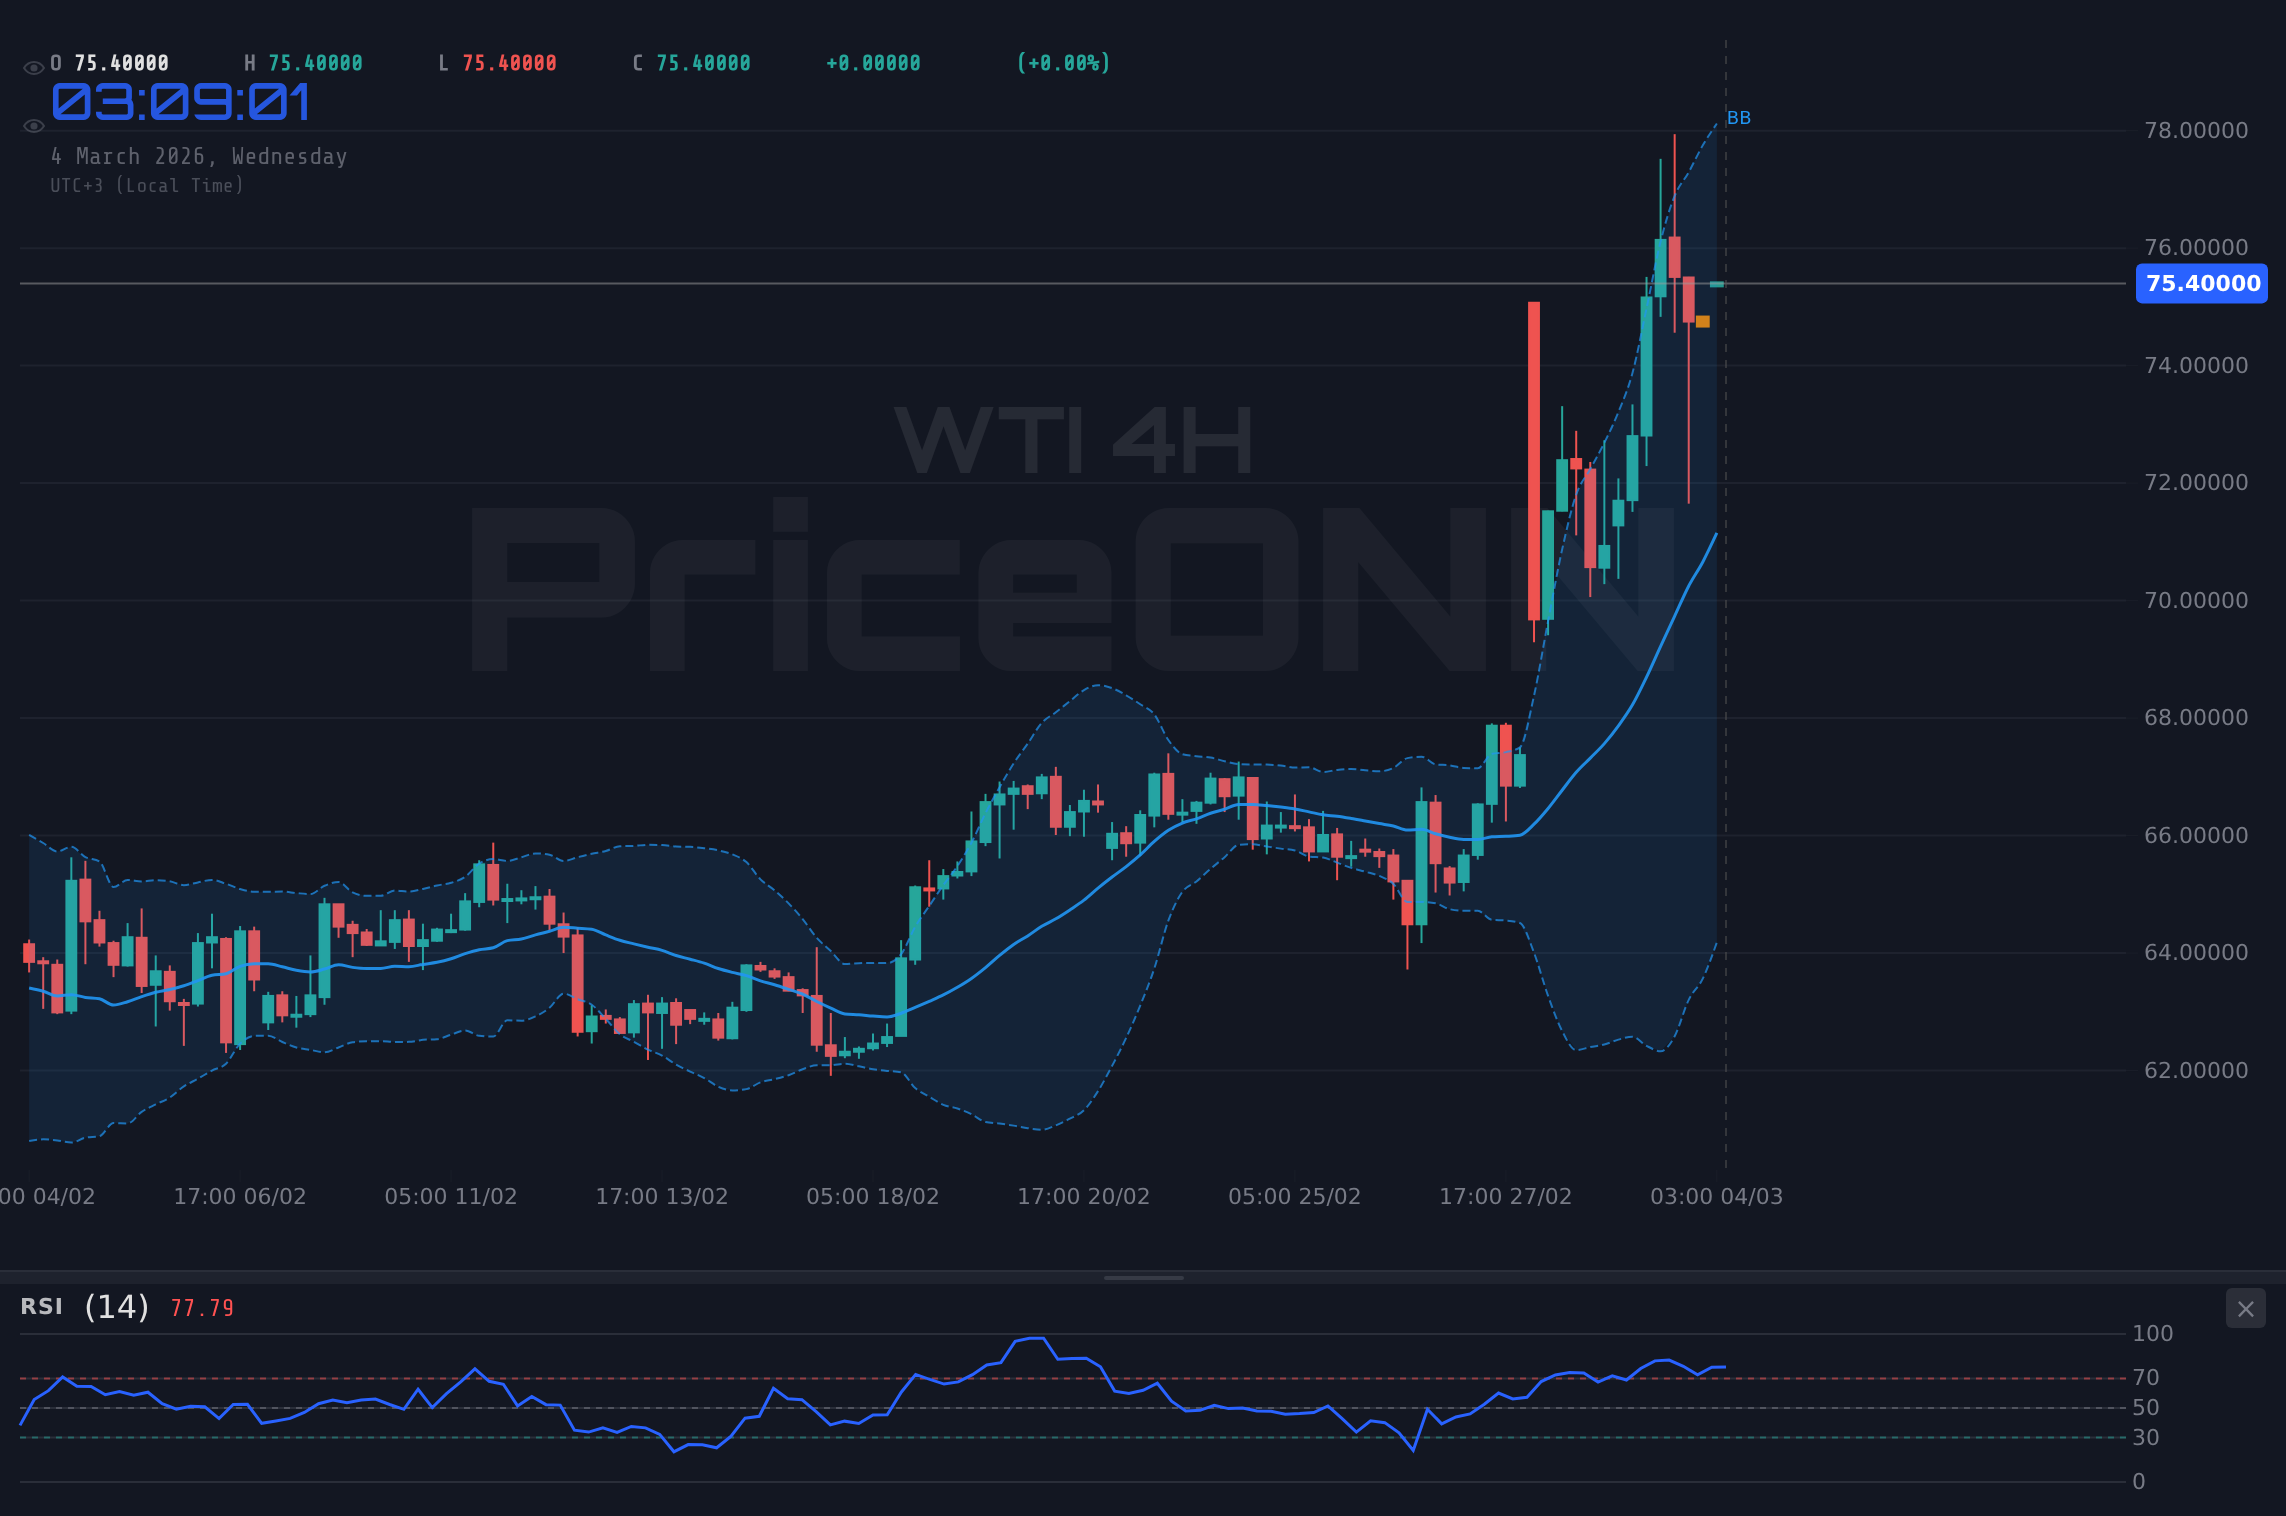
Zooming out to the four-hour timeframe, WTI presents a bullish trend. Support levels are found at $74.07, $72.62, and $70.69. Resistance levels are observed at $77.45, $79.38, and $80.83. The four-hour RSI reads 74.23, indicating overbought conditions. The MACD indicator shows positive momentum, while the Stochastic oscillator reads K=74.78 and D=72.48, signaling bullish momentum. The Average Directional Index (ADX) reading is 47.28, indicating a strong trend.
On the daily chart, WTI maintains its bullish trend. Support levels are found at $68.46, $65.98, and $62.68. Resistance levels are observed at $74.24, $77.54, and $80.02. The daily RSI is at 78.43, indicating overbought conditions. The MACD indicator shows positive momentum, while the Stochastic oscillator reads K=81.09 and D=76.6, signaling bullish momentum. The ADX reading is 29.23, indicating a strong trend.
The strength of the ADX readings across multiple timeframes cannot be ignored. An ADX above 25 generally indicates a strong trend, and the 47.28 reading on the 4-hour chart reinforces the bullish sentiment. However, the overbought RSI on both the daily and 4-hour charts warrants caution. Historically, when RSI reaches these levels, a pullback often follows. The key will be whether WTI can consolidate above $74.24, turning that resistance into new support. This will be a crucial test of the bullish momentum.
The strength of the U.S. dollar is also a factor to consider. The DXY (Dollar Index) is currently at 98.76, up 0.54% on the day. A stronger dollar typically puts downward pressure on commodity prices, including oil. However, the geopolitical tensions are currently outweighing the dollar's influence, highlighting the severity of the supply-side concerns. As CAD JPY news BOC BOJ oil prices continues to rise, the market dynamic is shifting.
Looking ahead, traders will be closely watching Wednesday's U.S. Crude Oil Inventories data. A larger-than-expected build in inventories could temper the bullish sentiment, while a surprise draw could fuel further gains. The market is also awaiting the U.S. ADP Nonfarm Employment Change data later today. Any signs of economic weakness could weigh on oil demand and, consequently, prices.
Given the strong uptrend, as indicated by the ADX, and the RSI signaling overbought conditions, the following trade plan seems appropriate:
If WTI breaks above $77.45 (R1 on the 4H chart) and holds, it could target $79.38 (R2 on the 4H chart), followed by $80.83 (R3). This scenario hinges on continued geopolitical tensions and a weaker-than-expected U.S. Crude Oil Inventories report.
If WTI fails to hold above $74.07 (S1 on the 4H chart), it could decline to $72.62 (S2), followed by $70.69 (S3). This scenario would likely be triggered by easing geopolitical tensions and a stronger-than-expected U.S. Crude Oil Inventories report.
The rise in oil prices has far-reaching implications, not only for energy companies but also for consumers and policymakers. Higher oil prices translate to increased gasoline prices, impacting household budgets and potentially dampening consumer spending. Central banks, particularly the ECB, are also watching oil prices closely, as rising energy costs can fuel inflation and complicate monetary policy decisions. As EUR/USD faces pressure, the ripples of the oil surge extend into currency markets.
Ecuador's oil sector is struggling with declining production and infrastructure challenges, now compounded by rising crude prices, according to recent reports. The interplay between production difficulties and rising prices highlights the complexity of the global oil market, underscoring the potential for further volatility. The market's sensitivity to both supply and geopolitical factors makes it essential for traders to stay informed and nimble.
Frequently Asked Questions: WTI Analysis
Is WTI a good buy right now?
WTI at $75.75 shows strong bullish momentum, but overbought conditions warrant caution. A breakout above $77.45 could signal further gains, while a break below $74.07 could trigger a pullback. Assess your risk tolerance before entering a position.
What is the WTI price forecast for this week?
The WTI price forecast for this week is mixed, with upside potential to $79.38 if geopolitical tensions persist and inventory data disappoints. A downside move to $72.62 is possible if tensions ease and inventories rise, but the probability is 40%.
What are the key support and resistance levels for WTI?
Key support levels for WTI are $74.07, $72.62, and $70.69. Resistance levels to watch are $77.45, $79.38, and $80.83, all derived from the 4-hour chart. These levels provide potential entry and exit points for traders.
Why is WTI moving today?
WTI is moving higher today due to escalating geopolitical tensions in the Strait of Hormuz, raising concerns about potential supply disruptions. This is coupled with a generally weaker dollar, which tends to support commodity prices.
Technical Outlook Summary
| Indicator | Value | Signal |
|---|---|---|
| RSI (14) | 78.43 | Overbought |
| MACD Histogram | Positive | Bullish |
| Stochastic | 81.09/76.6 | Bullish |
| ADX | 47.28 | Strong Trend |
| Bollinger | Upper Band | Watch |
Track markets in real-time
AI-powered analysis, technical indicators and real-time price data.
Join Our Telegram Channel
Breaking market news, AI analysis and trading signals instantly.
Join Channel