WTI Eyes $94.45 Amid Escalating Geopolitical Risks
WTI crude oil surges to $94.45 as Middle East tensions intensify, overshadowing strategic reserve releases and fueling supply concerns. Will this rally continue?
Crude oil prices are testing multi-month highs, with WTI currently trading at $94.45, a level not seen since late 2025. The bullish sentiment is largely fueled by escalating geopolitical tensions in the Middle East, specifically in the Strait of Hormuz, a critical chokepoint for global oil supplies. These tensions have overshadowed recent efforts to stabilize prices through strategic reserve releases, creating a complex and volatile market environment.
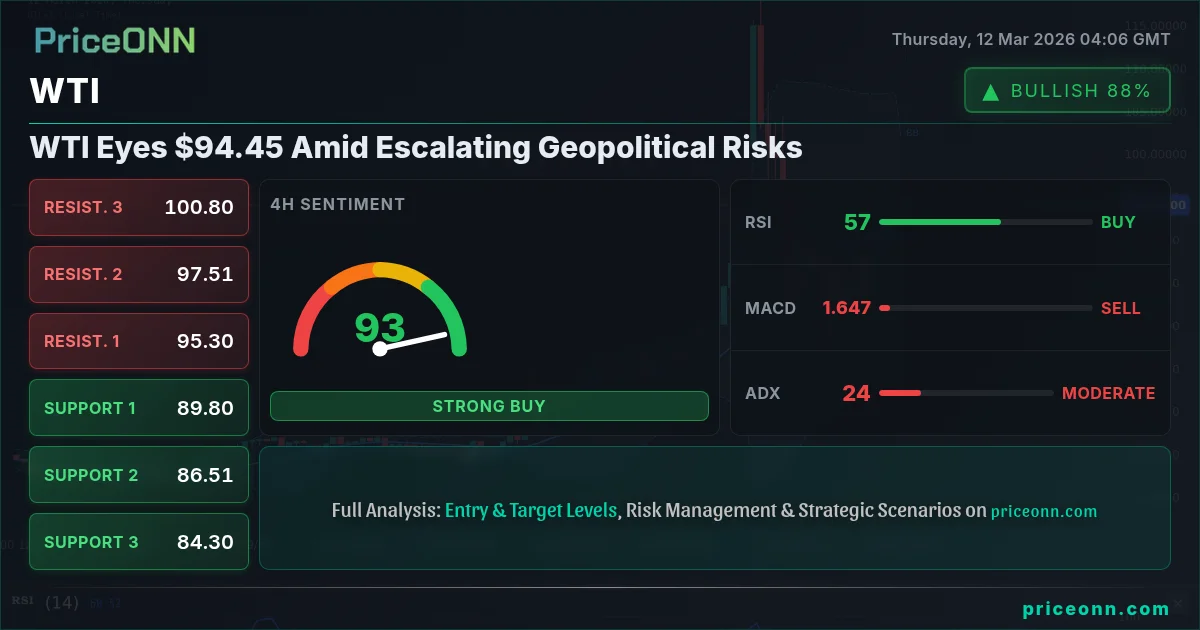
- WTI crude oil currently trades at $94.45, driven by geopolitical tensions.
- Immediate resistance lies at $95.79, with a potential target of $97.17 if the bullish momentum continues.
- Key support rests at $93.04; a break below this level could signal a short-term reversal.
- Geopolitical risks and supply disruptions are the primary drivers, overshadowing economic data.
The recent surge in WTI can be directly attributed to the heightened instability in the Middle East. According to recent news reports, attacks in the Strait of Hormuz have sparked fears of significant supply disruptions, prompting a rapid reassessment of risk premiums in the oil market. This is happening despite efforts by major economies to release strategic petroleum reserves to cushion the impact of potential disruptions. The market's focus has swiftly shifted from economic data to geopolitical events, a dynamic that often leads to increased volatility and unpredictable price swings.
From a technical perspective, the 1-hour chart shows a strong uptrend with the RSI at 67.12, indicating that while the market is approaching overbought conditions, there's still room for further upside. The MACD is also showing positive momentum, with the signal line above the histogram, reinforcing the bullish outlook. However, the Stochastic oscillator, with K=85.76 and D=86.04, is in overbought territory, suggesting that a short-term pullback or consolidation phase might be imminent. Traders should watch for a potential divergence between price action and the Stochastic indicator, which could signal weakening momentum.
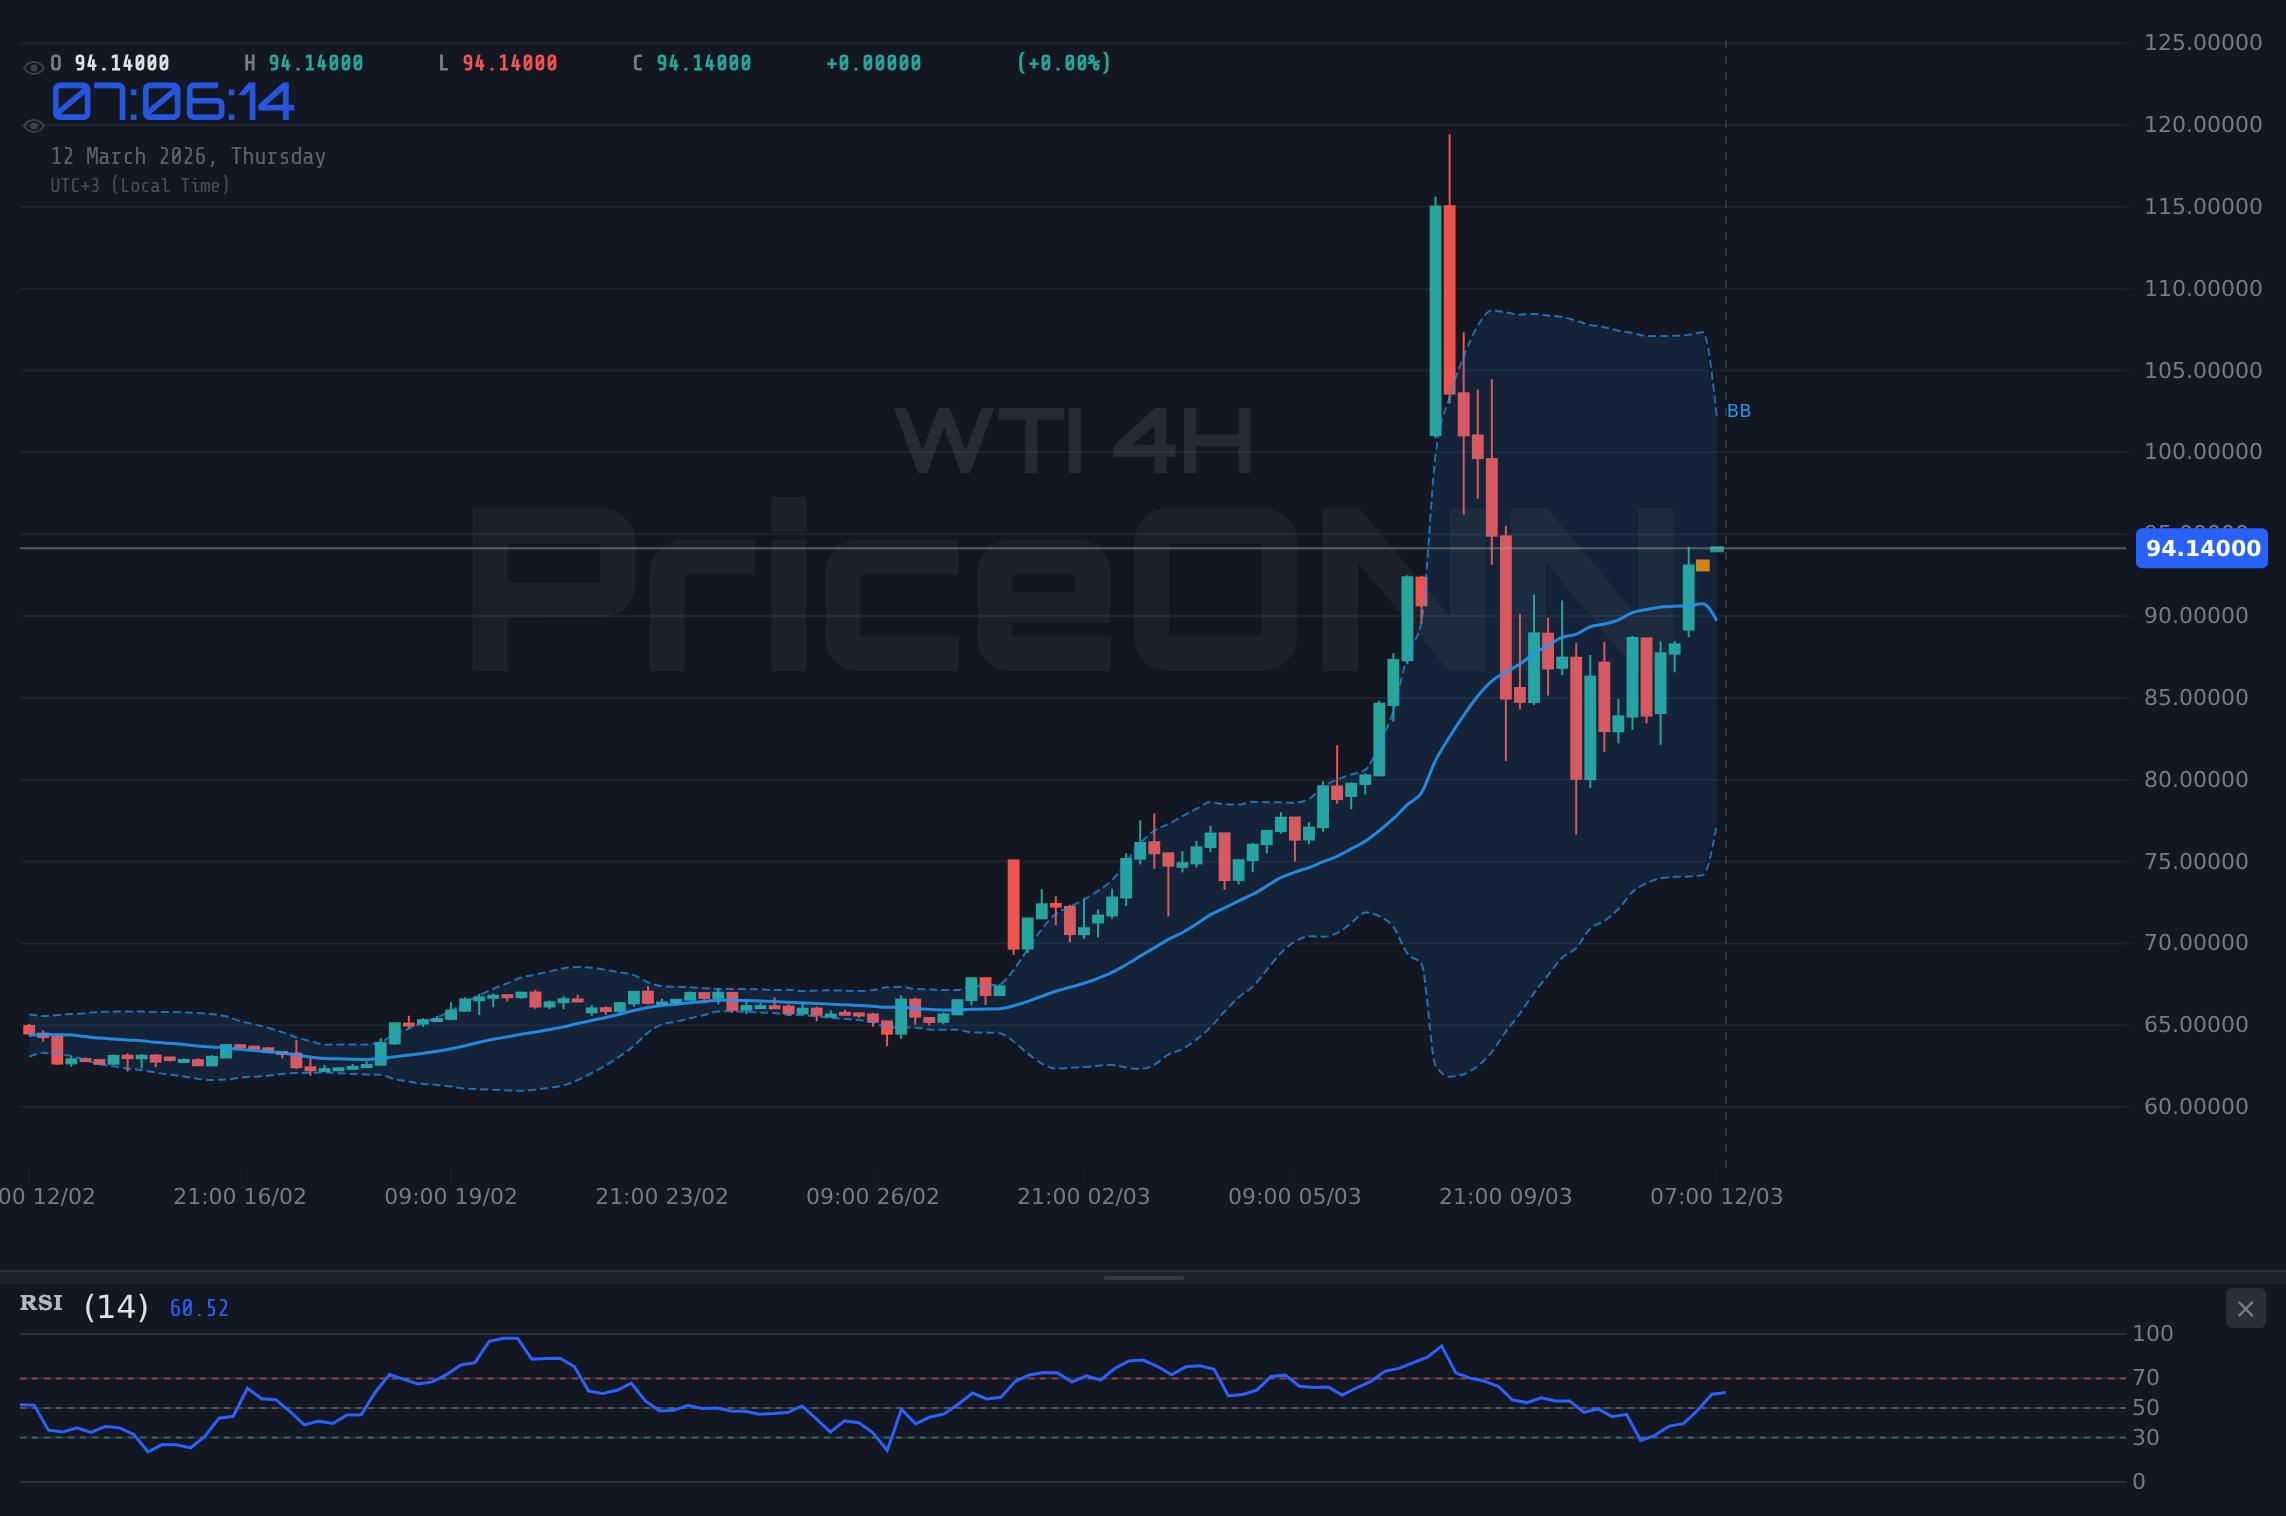
Looking at the 4-hour timeframe, the trend remains bullish, supported by an ADX of 24.42, suggesting a moderate trend strength. The RSI stands at 58.07, leaving room for further gains before reaching overbought territory. However, the MACD displays negative momentum, with the signal line positioned above the histogram, indicating a potential slowdown in the upward trajectory. Key support levels to watch are $93.04, $91.67, and $90.29. Resistance levels are $95.79, $97.17, and $98.54. A decisive break above $95.79 could pave the way for a test of the $97.17 level, while a failure to hold $93.04 could trigger a deeper correction.
The daily chart paints a more comprehensive picture of the prevailing bullish trend. The ADX is at a robust 47.64, indicating a strong and established uptrend. The RSI is at 80.53, firmly in overbought territory, suggesting that the market is due for a correction. Despite the overbought conditions, the MACD shows positive momentum, indicating that the underlying trend remains strong. Key support levels on the daily chart are $83.71, $79.16, and $76.62, while resistance is found at $90.80, $93.34, and $97.89. Given the current market dynamics, a pullback towards the $90.80 level could provide a buying opportunity for longer-term investors.
The overall market sentiment remains bullish, driven by supply-side concerns and geopolitical uncertainties. However, traders should be mindful of the overbought conditions and potential for a short-term correction. A key factor to watch is the DXY (Dollar Index), which is currently trading at 99.24. A stronger dollar could exert downward pressure on WTI prices, while a weaker dollar could provide further support. The SP500 and Nasdaq are also important indicators of risk appetite. A decline in equity markets could trigger a flight to safety, potentially weighing on oil prices. As the SP500 is showing a decline of 0.79%, this could signal a bearish sentiment for WTI as well.
The economic calendar also presents potential catalysts for price movements. Investors are closely watching for upcoming data releases, particularly on Friday, March 13th, which will provide further insights into the health of the global economy and potential demand for oil. Any surprises in these data releases could trigger significant volatility in the oil market. Of particular interest is the U.S. data, which will provide insight into the U.S. economy.
Looking ahead, WTI’s trajectory hinges on several factors. Continued geopolitical instability in the Middle East could sustain the bullish momentum, potentially driving prices towards the $100 mark. However, a resolution of these tensions could trigger a sharp correction. Furthermore, any signs of weakening global demand or a resurgence in U.S. oil production could also weigh on prices. The market is likely to remain highly sensitive to news flow and geopolitical developments in the coming weeks.
For traders, the current market conditions present both opportunities and risks. Given the overbought conditions and potential for a short-term correction, a cautious approach is warranted. While the overall trend remains bullish, traders should wait for a pullback towards key support levels before initiating new long positions. A daily close above $95.79 would open the door for a test of the $97.17 level, while a failure to hold $93.04 could trigger a deeper correction towards $91.67 or even $90.29. Position sizing and risk management are crucial in this volatile environment.
The news regarding CAD/JPY is not directly related to the WTI trend, but it is worth noting that the trends in oil prices can affect the CAD/JPY pair. The Bank of Canada and Bank of Japan are also closely watched in order to determine the direction of the market.
Technical Outlook Summary
| Indicator | Value | Signal |
|---|---|---|
| RSI (14) | 67.12 | Neutral |
| MACD Histogram | Positive | Bullish |
| Stochastic | 85.76/86.04 | Overbought |
| ADX | 24.42 | Moderate Trend |
| Bollinger | Upper Band | Watch |
Key Levels
Support Levels
Resistance Levels
Frequently Asked Questions: WTI Analysis
What happens if WTI breaks above $95.79 resistance?
A break above the $95.79 resistance level could signal continued bullish momentum, potentially leading to a test of the $97.17 and $98.54 levels. This scenario would be supported by sustained geopolitical tensions and positive market sentiment.
Should I buy WTI at current $94.45 levels given RSI at 67.12?
While the overall trend is bullish, the RSI at 67.12 suggests the market is approaching overbought conditions. A cautious approach is warranted, and traders should wait for a pullback towards key support levels before initiating new long positions.
Is Stochastic at 85.76/86.04 a sell signal for WTI right now?
The Stochastic oscillator being in overbought territory (85.76/86.04) indicates that a short-term pullback or consolidation phase might be imminent. Traders should watch for a potential divergence between price action and the Stochastic indicator, which could signal weakening momentum.
How will the upcoming data releases affect WTI this week?
Upcoming data releases, particularly on Friday, March 13th, could trigger significant volatility in the oil market. Stronger-than-expected economic data could support prices, while weaker data could trigger a correction. The market is likely to remain highly sensitive to news flow and economic developments in the coming weeks.
Track markets in real-time
AI-powered analysis, technical indicators and real-time price data.
Join Our Telegram Channel
Breaking market news, AI analysis and trading signals instantly.
Join Channel