Bitcoin, the undisputed king of cryptocurrencies, is currently navigating a critical juncture around the $74,528.00 mark. After a period of significant price action, the market is exhibiting signs of consolidation, with traders and analysts closely watching key technical indicators for clues about the next directional move. The neutral trend observed on multiple timeframes, coupled with a noticeable dip in the Relative Strength Index (RSI), suggests a market pause rather than a definitive shift in momentum. This analysis delves into the intricate technical landscape, exploring the potential scenarios that could unfold and the crucial levels that will dictate Bitcoin's path forward. We'll examine the interplay between on-chain metrics, broader market correlations, and the ever-evolving crypto ecosystem to paint a comprehensive picture for investors.
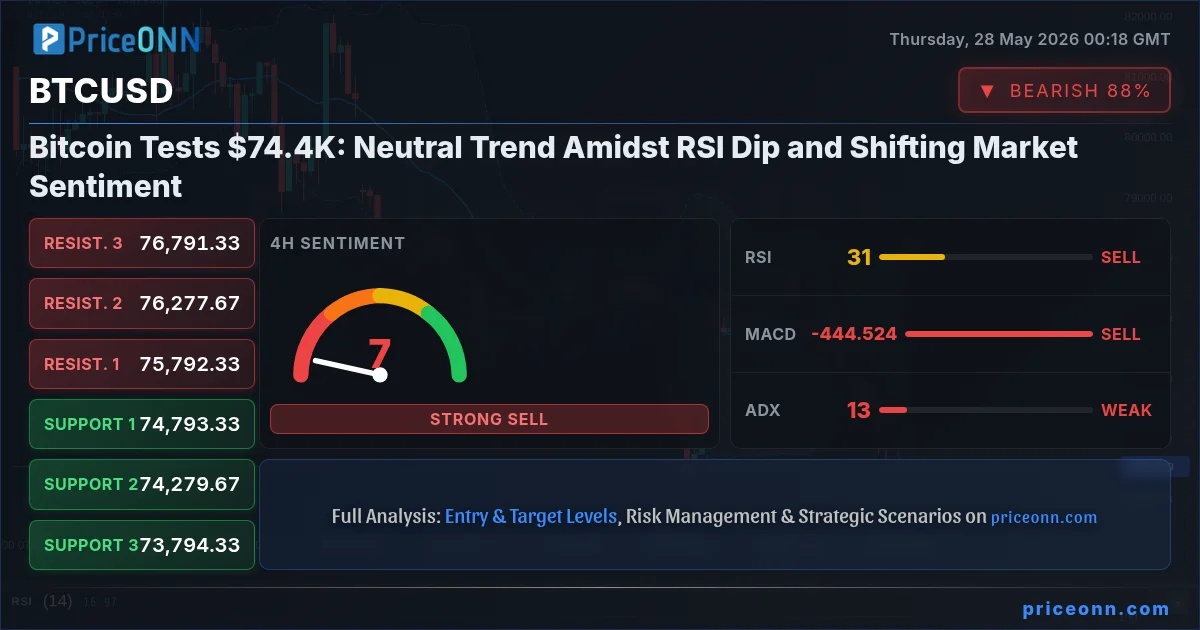
- BTCUSD is currently trading around $74,528, indicating a neutral trend with a strong bearish signal on the 1H chart (Sell: 8).
- The RSI(14) on the 1H timeframe has dipped to 32.55, approaching oversold territory, suggesting potential for a short-term bounce.
- ADX readings across timeframes (1H: 26.02, 4H: 13.06, 1D: 21.3) indicate a weakening trend strength, pointing towards consolidation or a lack of strong directional conviction.
- Key support is identified at $74,198, with resistance looming at $74,711; a decisive break of either level will be crucial for establishing a new trend.
The Bitcoin Tightrope Walk: Navigating Neutral Territory
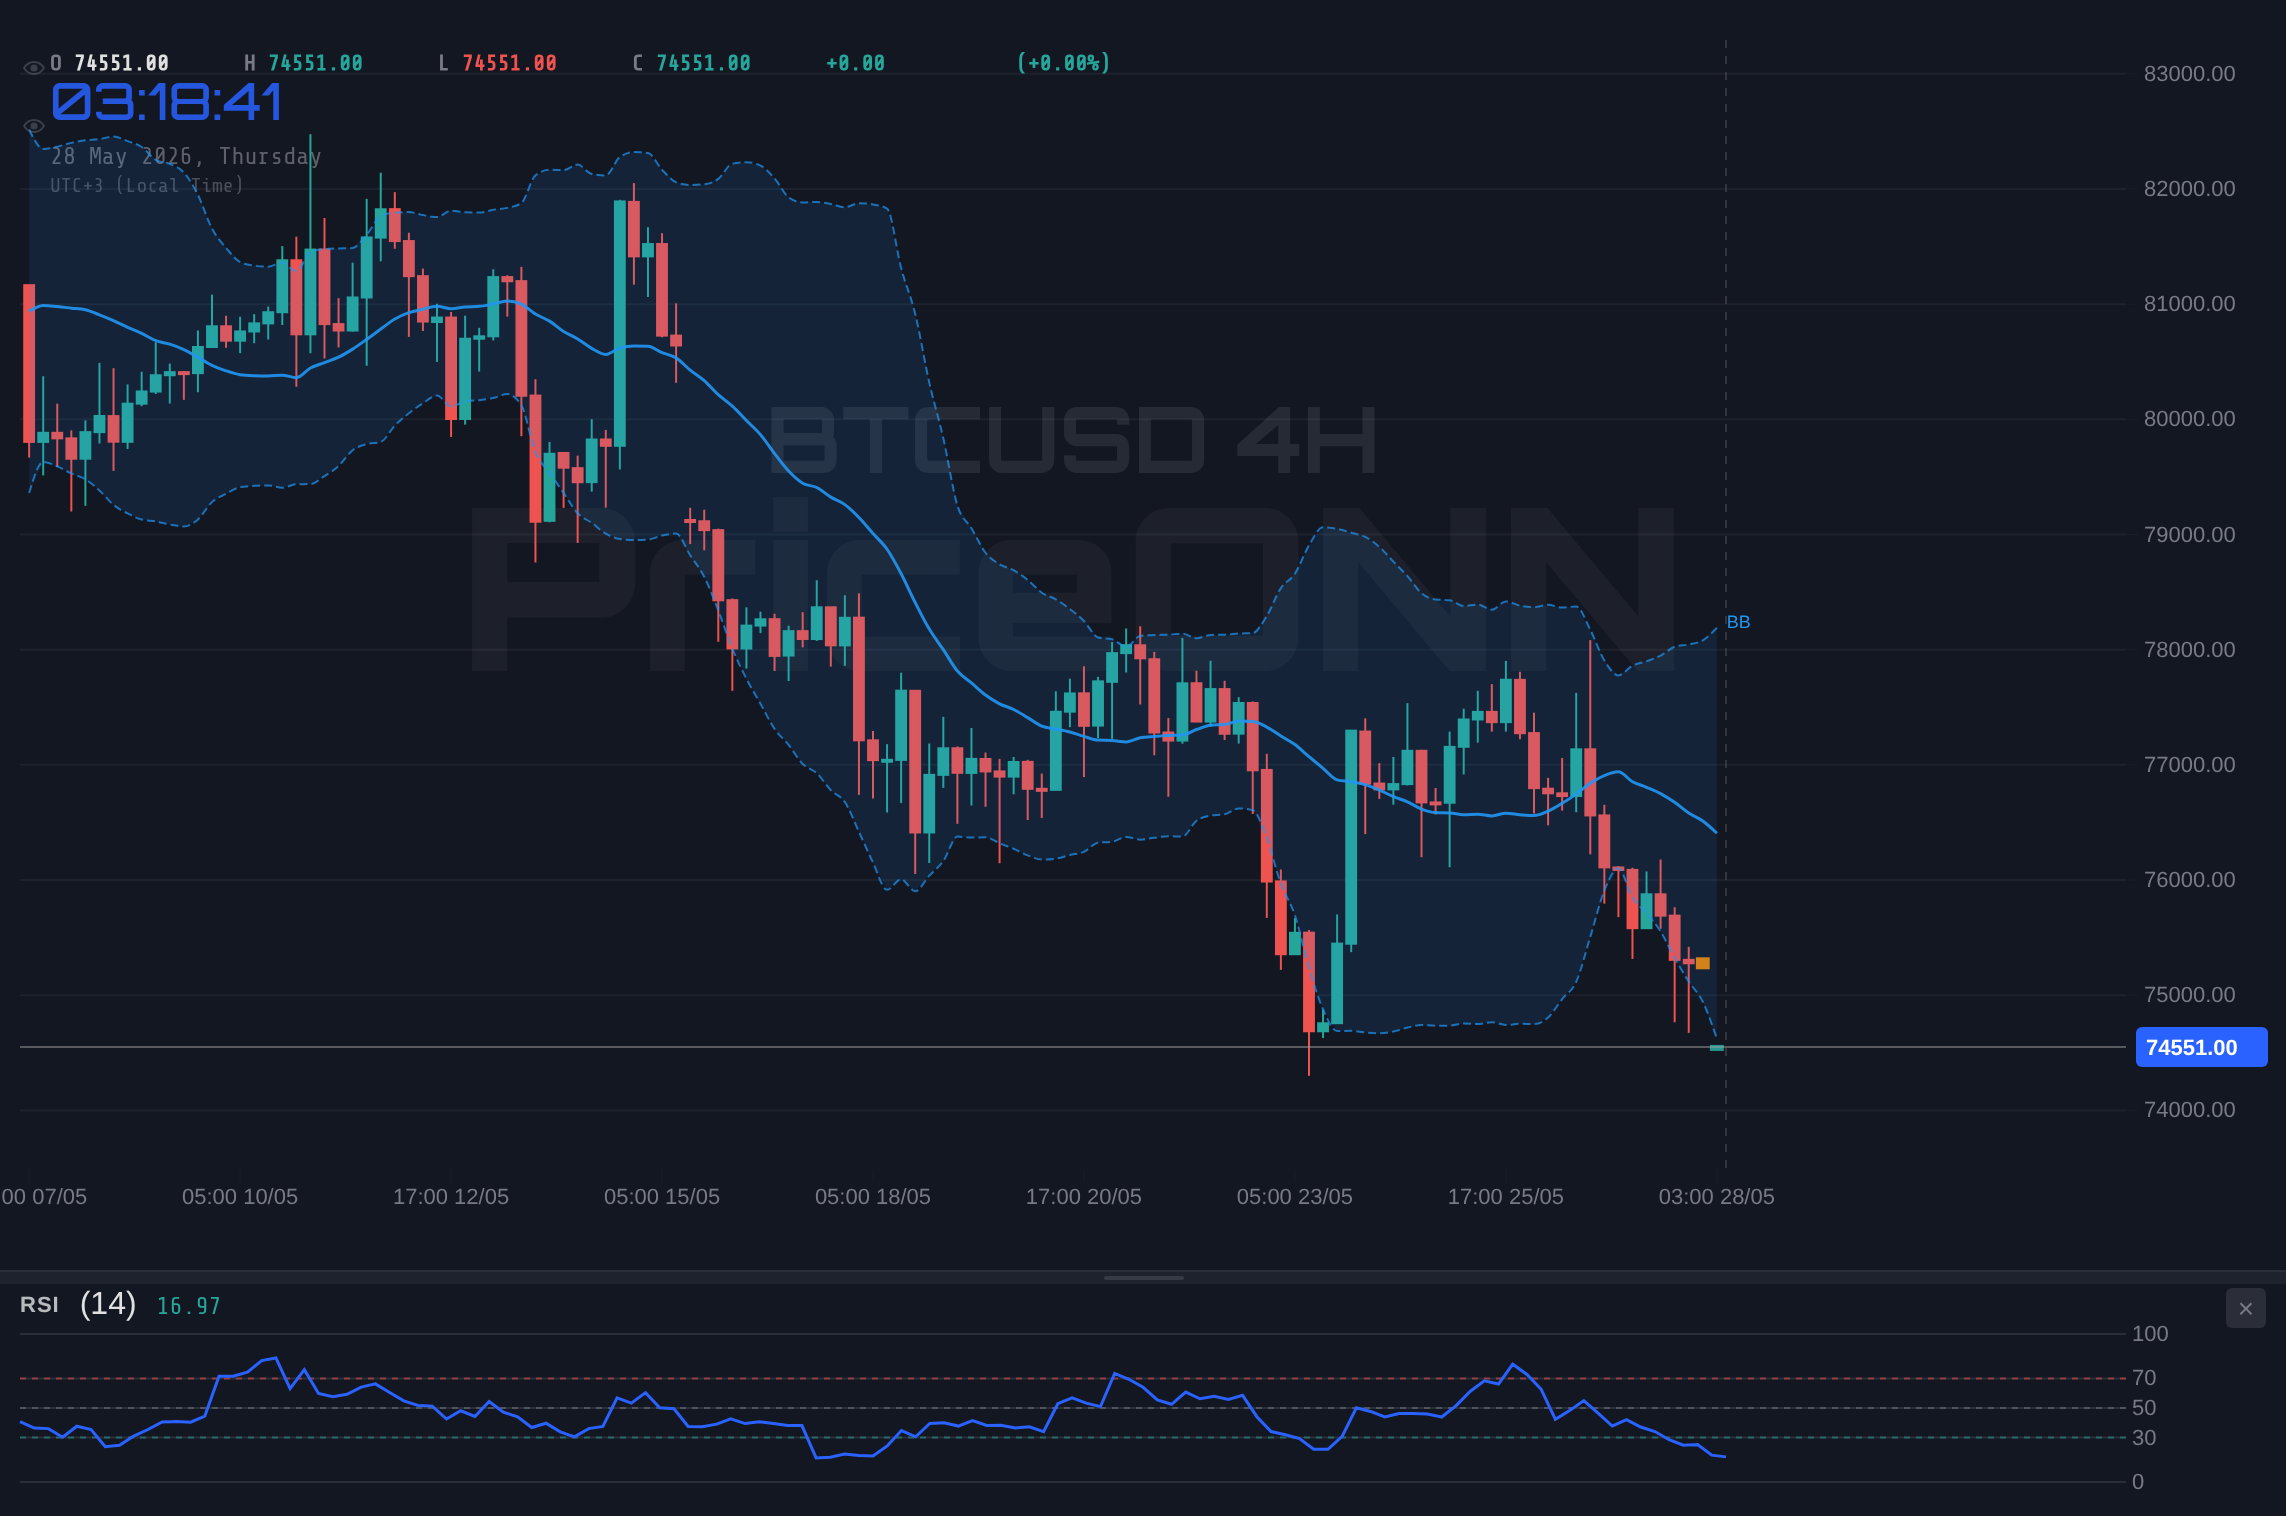
The current market sentiment surrounding Bitcoin is one of cautious observation. After a volatile period, the price action around $74,528.00 reflects a market in equilibrium, albeit a fragile one. The 1-hour technical indicators paint a predominantly bearish picture, with a strong consensus among indicators to 'SELL' (8 out of 8). This suggests that short-term traders are anticipating further downside pressure or are booking profits after recent moves. However, this immediate bearish signal must be viewed within the context of broader timeframes. The 4-hour chart, while still showing a 'SELL' signal (7 out of 8), indicates a weaker trend strength with an ADX of 13.06, a far cry from the robust trends often seen during major price swings. This divergence between short-term selling pressure and weakening overall trend strength is a hallmark of consolidation phases. It implies that while immediate sentiment leans bearish, the market hasn't yet committed to a significant directional move. This is precisely the kind of environment where breakout strategies become paramount, but the lack of strong momentum makes predicting the direction of such a breakout challenging.
Further complicating the picture is the daily (1D) timeframe. Here, the signal shifts slightly, though still predominantly bearish (7 out of 8 'SELL' signals), the ADX at 21.3 suggests a moderately strong trend, contrasting with the weaker readings on the 4-hour chart. The RSI(14) on the daily chart sits at 38.22, a level that, while not technically oversold, is certainly moving away from overbought territory and indicating that the recent selling pressure has eased some of the previous upward momentum. This mix of signals across different timeframes underscores the current neutral stance of the market. It's a period where Bitcoin is neither strongly bullish nor bearish, making it a challenging environment for trend-following strategies but potentially offering opportunities for range-bound traders or those waiting for a clear breakout signal. The market is essentially holding its breath, waiting for a catalyst to break the stalemate.
The Bull's Roadmap: What Needs to Happen for a Rally
For Bitcoin to embark on a significant upward trajectory from its current perch around $74,528.00, several technical and fundamental conditions must align. The immediate bearish signals on the 1-hour chart need to dissipate, replaced by a wave of buying pressure that can overcome the immediate resistance levels. The first critical hurdle is the 1-hour resistance at $74,711.00. A sustained break and hold above this level, ideally accompanied by increasing trading volume, would be the initial sign that bulls are regaining control. This would be followed by the need to conquer the next resistance at $75,001.00. A decisive move past this point would invalidate the immediate bearish sentiment and could trigger a short squeeze, propelling the price higher.
On a broader scale, the 4-hour chart offers crucial insights. The ADX at 13.06 signals a weak trend, meaning that for a bullish move to gain traction, this indicator would need to start rising, confirming increasing trend strength. Simultaneously, the RSI(14) on the 4-hour chart, currently at 30.55, is in oversold territory. A bullish confirmation would involve the RSI moving upwards, ideally crossing back above the 50 level, signaling a return to neutral or bullish sentiment. The Stochastic oscillator, with K=9.97 and D=14.45, also points to oversold conditions, and a bullish crossover where the %K line moves above the %D line would serve as an additional confirmation signal. If these conditions materialize, with price action supported by rising volume and increasing trend strength (ADX moving above 20-25), the next logical upside targets would be the 4-hour resistance levels, starting with $75,792.33, and potentially extending towards $76,277.67. A daily close above the 1D resistance of $77,530.33 would further solidify the bullish case, setting the stage for a move towards higher targets.
Where Bears Take Control: The Downside Risks
Conversely, the path of least resistance currently appears to be downwards, given the prevailing 'SELL' signals on the 1-hour and daily charts. The immediate support level to watch is at $74,198.00 on the 1-hour timeframe. A break below this level, especially if accompanied by a surge in selling volume, would confirm the short-term bearish bias and could lead to a rapid descent towards the next support at $73,975.00. This level is particularly important as it represents a psychological barrier and a previous consolidation zone.
The 4-hour chart provides further cause for caution. The current RSI at 30.55 is approaching oversold, but a failure to bounce from here and a subsequent dip below this level could signal a deeper correction. If the price breaks decisively below the 4-hour support at $73,794.33, it would significantly increase the probability of a bearish scenario playing out. This breakdown would likely be confirmed by an increase in the ADX, indicating that a strong downtrend is re-establishing itself. The daily chart's support levels also come into play. A failure to hold the 1D support at $75,242.33 (a resistance level on the 1H chart) and a subsequent drop below $74,374.67 would be a strong bearish signal. If Bitcoin falls below this key daily support, the next significant downside target would be the 1D support at $72,954.33. Such a move would indicate a deeper market correction, potentially driven by broader macroeconomic concerns or negative sentiment shifts within the crypto space.
The correlation with traditional markets also plays a role. With the DXY (Dollar Index) currently at 99.01 and showing a rising trend, a strengthening dollar often puts pressure on risk assets like Bitcoin. If the DXY continues its ascent, it could exacerbate selling pressure on BTCUSD. Similarly, the performance of the S&P 500 (SP500) and Nasdaq (Nasdaq100) indices is crucial. If these major equity indices turn lower, especially after their recent gains, it could signal a broader risk-off environment, further pressuring Bitcoin. The WTI crude oil price, currently at $92.86 and showing a bearish trend, can also indirectly influence Bitcoin through inflation expectations and geopolitical risk sentiment. A sustained drop in oil prices might suggest easing inflationary pressures, potentially influencing central bank policy and, by extension, risk asset valuations.
The Waiting Game: Consolidation and Range-Bound Dynamics
In the absence of a decisive catalyst, Bitcoin could remain locked in a consolidation pattern. This 'waiting game' scenario is characterized by price oscillating between defined support and resistance levels, with neither the bulls nor the bears able to establish firm control. The current technical setup, particularly the weak ADX readings on the 4-hour chart (13.06) and the neutral RSI levels across all timeframes (1H: 32.55, 4H: 30.55, 1D: 38.22), supports the possibility of a period of range-bound trading. This scenario often plays out when the market digests recent price movements, awaits significant macroeconomic news (like upcoming central bank decisions or inflation reports), or observes conflicting signals from different market participants.
During such a phase, scalpers and short-term traders might find opportunities by trading the bounces off support and the rejections from resistance. However, for longer-term investors, this period demands patience. The key levels identified earlier become even more critical in defining the range. The 1-hour resistance at $74,711.00 and support at $74,198.00 would define the immediate trading band. A failure to break these levels, with price repeatedly testing them and reversing, would confirm the range-bound environment. The overall market sentiment, as reflected by the DXY and equity indices, would likely remain mixed or volatile within this consolidation. Without a clear directional bias emerging from these broader market influences, Bitcoin could remain range-bound for an extended period, frustrating trend-followers but potentially setting the stage for a more explosive move once the range is eventually broken.
The Bearish Descent: Capitulation Below $73K
35% ProbabilityThe Sideways Squeeze: Trading the Range
40% ProbabilityThe Bullish Breakout: $75K+ Rally
25% ProbabilityCrypto Ecosystem Health: Beyond the BTCUSD Chart
While the price action of Bitcoin captures immediate attention, a deeper dive into the broader cryptocurrency ecosystem reveals crucial context. On-chain metrics provide a vital layer of analysis, offering insights into network health and user activity. For instance, metrics like active addresses, transaction counts, and developer activity can indicate whether the underlying network is growing or stagnating, irrespective of short-term price fluctuations. A rising number of active addresses, for example, would suggest increasing user adoption and network utility, potentially providing a fundamental underpinning for future price appreciation. Conversely, declining metrics could signal waning interest, even if the price appears stable or is experiencing minor bounces.
Exchange flows are another critical on-chain indicator. Large inflows of BTC into exchanges often precede price drops, as they can indicate increased selling pressure from holders looking to liquidate positions. Conversely, significant outflows from exchanges, particularly to cold storage wallets, are typically seen as a bullish sign, suggesting that investors are moving their assets into long-term holding, reducing the available supply on the market. Whale movements, referring to large holders accumulating or distributing significant amounts of Bitcoin, also warrant close attention. Tracking these large players can offer clues about institutional sentiment and potential market-moving activities. Furthermore, the health of the DeFi (Decentralized Finance) and NFT (Non-Fungible Token) sectors provides a broader view of the crypto market's innovation and adoption. Developments in DeFi, such as Total Value Locked (TVL) and yields on various protocols, can attract capital into the ecosystem, indirectly benefiting Bitcoin. Similarly, vibrant NFT markets can signal renewed retail interest and speculative activity.
Regulatory news continues to be a significant driver of sentiment and price action within the crypto space. Any pronouncements from major regulatory bodies, such as the SEC in the US or equivalent organizations globally, regarding Bitcoin ETFs, stablecoins, or exchange regulations, can trigger sharp market reactions. Positive regulatory clarity often fosters institutional adoption and investor confidence, while ambiguous or negative news can lead to uncertainty and price declines. The ongoing discussion around Bitcoin ETFs, for instance, remains a key theme. Approval of new spot Bitcoin ETFs in different jurisdictions or increased inflows into existing ones can significantly boost demand and support higher prices. Conversely, regulatory crackdowns or delays in approvals can dampen enthusiasm.
Bitcoin dominance, a metric representing Bitcoin's market capitalization relative to the total crypto market cap, also offers valuable insights. When Bitcoin dominance rises, it often signifies a flight to safety within the crypto market, with investors prioritizing Bitcoin over altcoins. A falling dominance, on the other hand, can indicate a 'risk-on' environment within crypto, where investors are seeking higher returns in altcoins, often referred to as 'altcoin season'. Understanding these dynamics is crucial for a holistic market view. The correlation between Bitcoin and major altcoins like Ethereum (ETHUSD) is also important. While ETHUSD is currently trading at $2023.89 and showing a bearish trend on the daily chart, its performance often mirrors or leads Bitcoin's movements, albeit with higher volatility. Monitoring ETHUSD's technicals and its correlation with BTCUSD can provide leading indicators for the broader crypto market.
What I'm Watching This Week
The coming week presents several key events and technical levels that will likely shape Bitcoin's price action. My focus will be on three primary triggers that could signal a shift in the current neutral trend:
First, the 1-hour close above $74,711.00. This is the immediate resistance level, and a strong daily close above it would be the first sign of bullish conviction returning. It needs to be accompanied by increasing volume to be considered a valid breakout signal.
Second, I'll be watching the 4-hour RSI crossing above 50. Currently sitting at 30.55, a move back into neutral territory and beyond would confirm that the oversold conditions are dissipating and that buyers are stepping in with conviction. This would align with a potential move towards the 4H resistance levels.
Third, the DXY's reaction to potential US economic data releases. With the DXY at 99.01 and showing upward momentum, any sign of weakness in the dollar, perhaps due to softer-than-expected inflation or employment figures, could provide a tailwind for risk assets like Bitcoin. Conversely, a continued DXY rally would likely add to the bearish pressure on BTCUSD.
These triggers, combined with the price action around the $74,198 support and $74,711 resistance, will be crucial in determining whether Bitcoin breaks out of its current consolidation or succumbs to bearish pressures. Patience and risk management remain paramount as the market digests these conflicting signals.
Frequently Asked Questions: BTCUSD Analysis
What happens if BTCUSD breaks below the $74,198 support level?
If BTCUSD closes decisively below the 1-hour support at $74,198, it would likely trigger further selling pressure, targeting the next key support at $73,975. This scenario gains probability if the 4-hour chart also shows a breakdown below $73,794.33, indicating a stronger bearish trend confirmation.
Should I buy BTCUSD at current levels around $74,528 given the RSI is 32.55?
While the 1-hour RSI at 32.55 suggests oversold conditions and potential for a short-term bounce, it's not a standalone buy signal, especially with bearish 'SELL' signals dominating the 1-hour chart. A confirmation would require price action to break above 1-hour resistance at $74,711 and ideally show increasing volume and trend strength.
Is the current ADX reading of 26.02 on BTCUSD a strong trend signal?
The ADX at 26.02 on the 1-hour chart indicates a strong trend, but this is contrasted by weaker ADX readings on higher timeframes (4H: 13.06). This suggests that while short-term momentum might be strong, the overall trend lacks conviction. A sustained increase in ADX across multiple timeframes would be needed to confirm a significant new trend.
How will the DXY's current strength at 99.01 affect BTCUSD this week?
The DXY at 99.01 and showing upward momentum typically exerts downward pressure on risk assets like BTCUSD. If the dollar continues to strengthen, it could exacerbate selling pressure on Bitcoin, making it harder to break above resistance levels. Conversely, any dollar weakness could provide a tailwind for Bitcoin.
| Indicator | Value | Signal | Interpretation |
|---|---|---|---|
| RSI (14) | 32.55 | Oversold Pressure | Moving towards oversold on 1H, suggesting potential for a bounce. |
| MACD Histogram | -8.77 | Negative Momentum | Shows ongoing selling pressure, but divergence could signal weakening. |
| Stochastic | 9.97 / 14.45 | Oversold | %K |
| ADX | 13.06 | Weak Trend | Low reading suggests lack of strong directional conviction on 4H. |
| Bollinger | Lower Band | Breakdown | Price below lower band on 4H suggests extreme bearishness or potential reversal. |
Track markets in real-time
AI-powered analysis, technical indicators and real-time price data.
Join Our Telegram Channel
Breaking market news, AI analysis and trading signals instantly.
Join Channel