BRENT Bull Run: $65.73, Geopolitical Boost?
BRENT crude oil rises to $65.73 amid escalating geopolitical tensions and supply concerns. Is this the start of a sustained rally or a temporary spike?
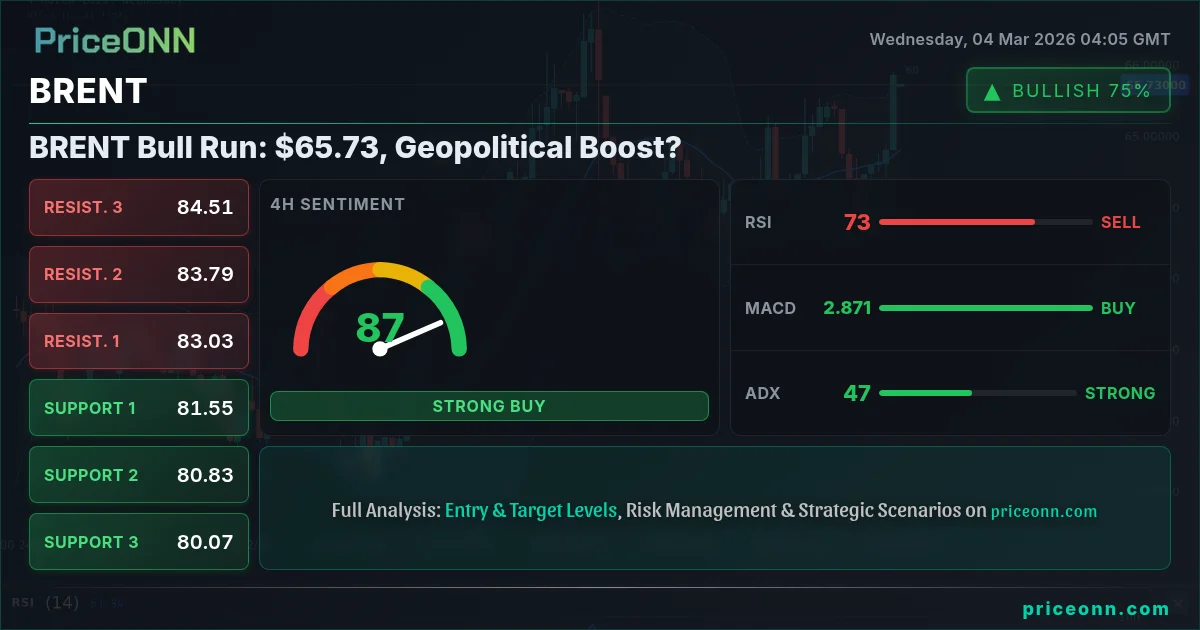
Crude oil trading strategy 2026 is all about navigating geopolitical risks and supply disruptions. BRENT crude oil is currently trading at $65.73, a level that bulls hope will hold as tensions in the Middle East and potential supply cuts fuel volatility. The battle between bulls and bears at this key level could determine the short-term direction of the energy market.
- RSI at 71.16 on the 1H chart signals overbought conditions, potentially leading to a pullback.
- Immediate resistance for BRENT lies at $65.42, a break above which could trigger further gains.
- Geopolitical tensions and potential Iraqi supply cuts are major catalysts driving BRENT's recent price action.
- The dollar index (DXY) strength could put pressure on BRENT, limiting its upside potential.
The Bull Case for BRENT: Supply Scarcity and Geopolitical Premiums
The bullish narrative for BRENT is primarily driven by two key factors: potential supply shortages and a rising geopolitical risk premium. Disruptions to Iraqi crude exports through the Strait of Hormuz, as recently reported, could remove up to 3 million barrels per day (bpd) from global supply, creating a significant scarcity. This supply disruption could send shockwaves through global energy markets. Add to this the ongoing tensions between the US, Israel, and Iran, and the risk of further supply disruptions becomes increasingly likely.
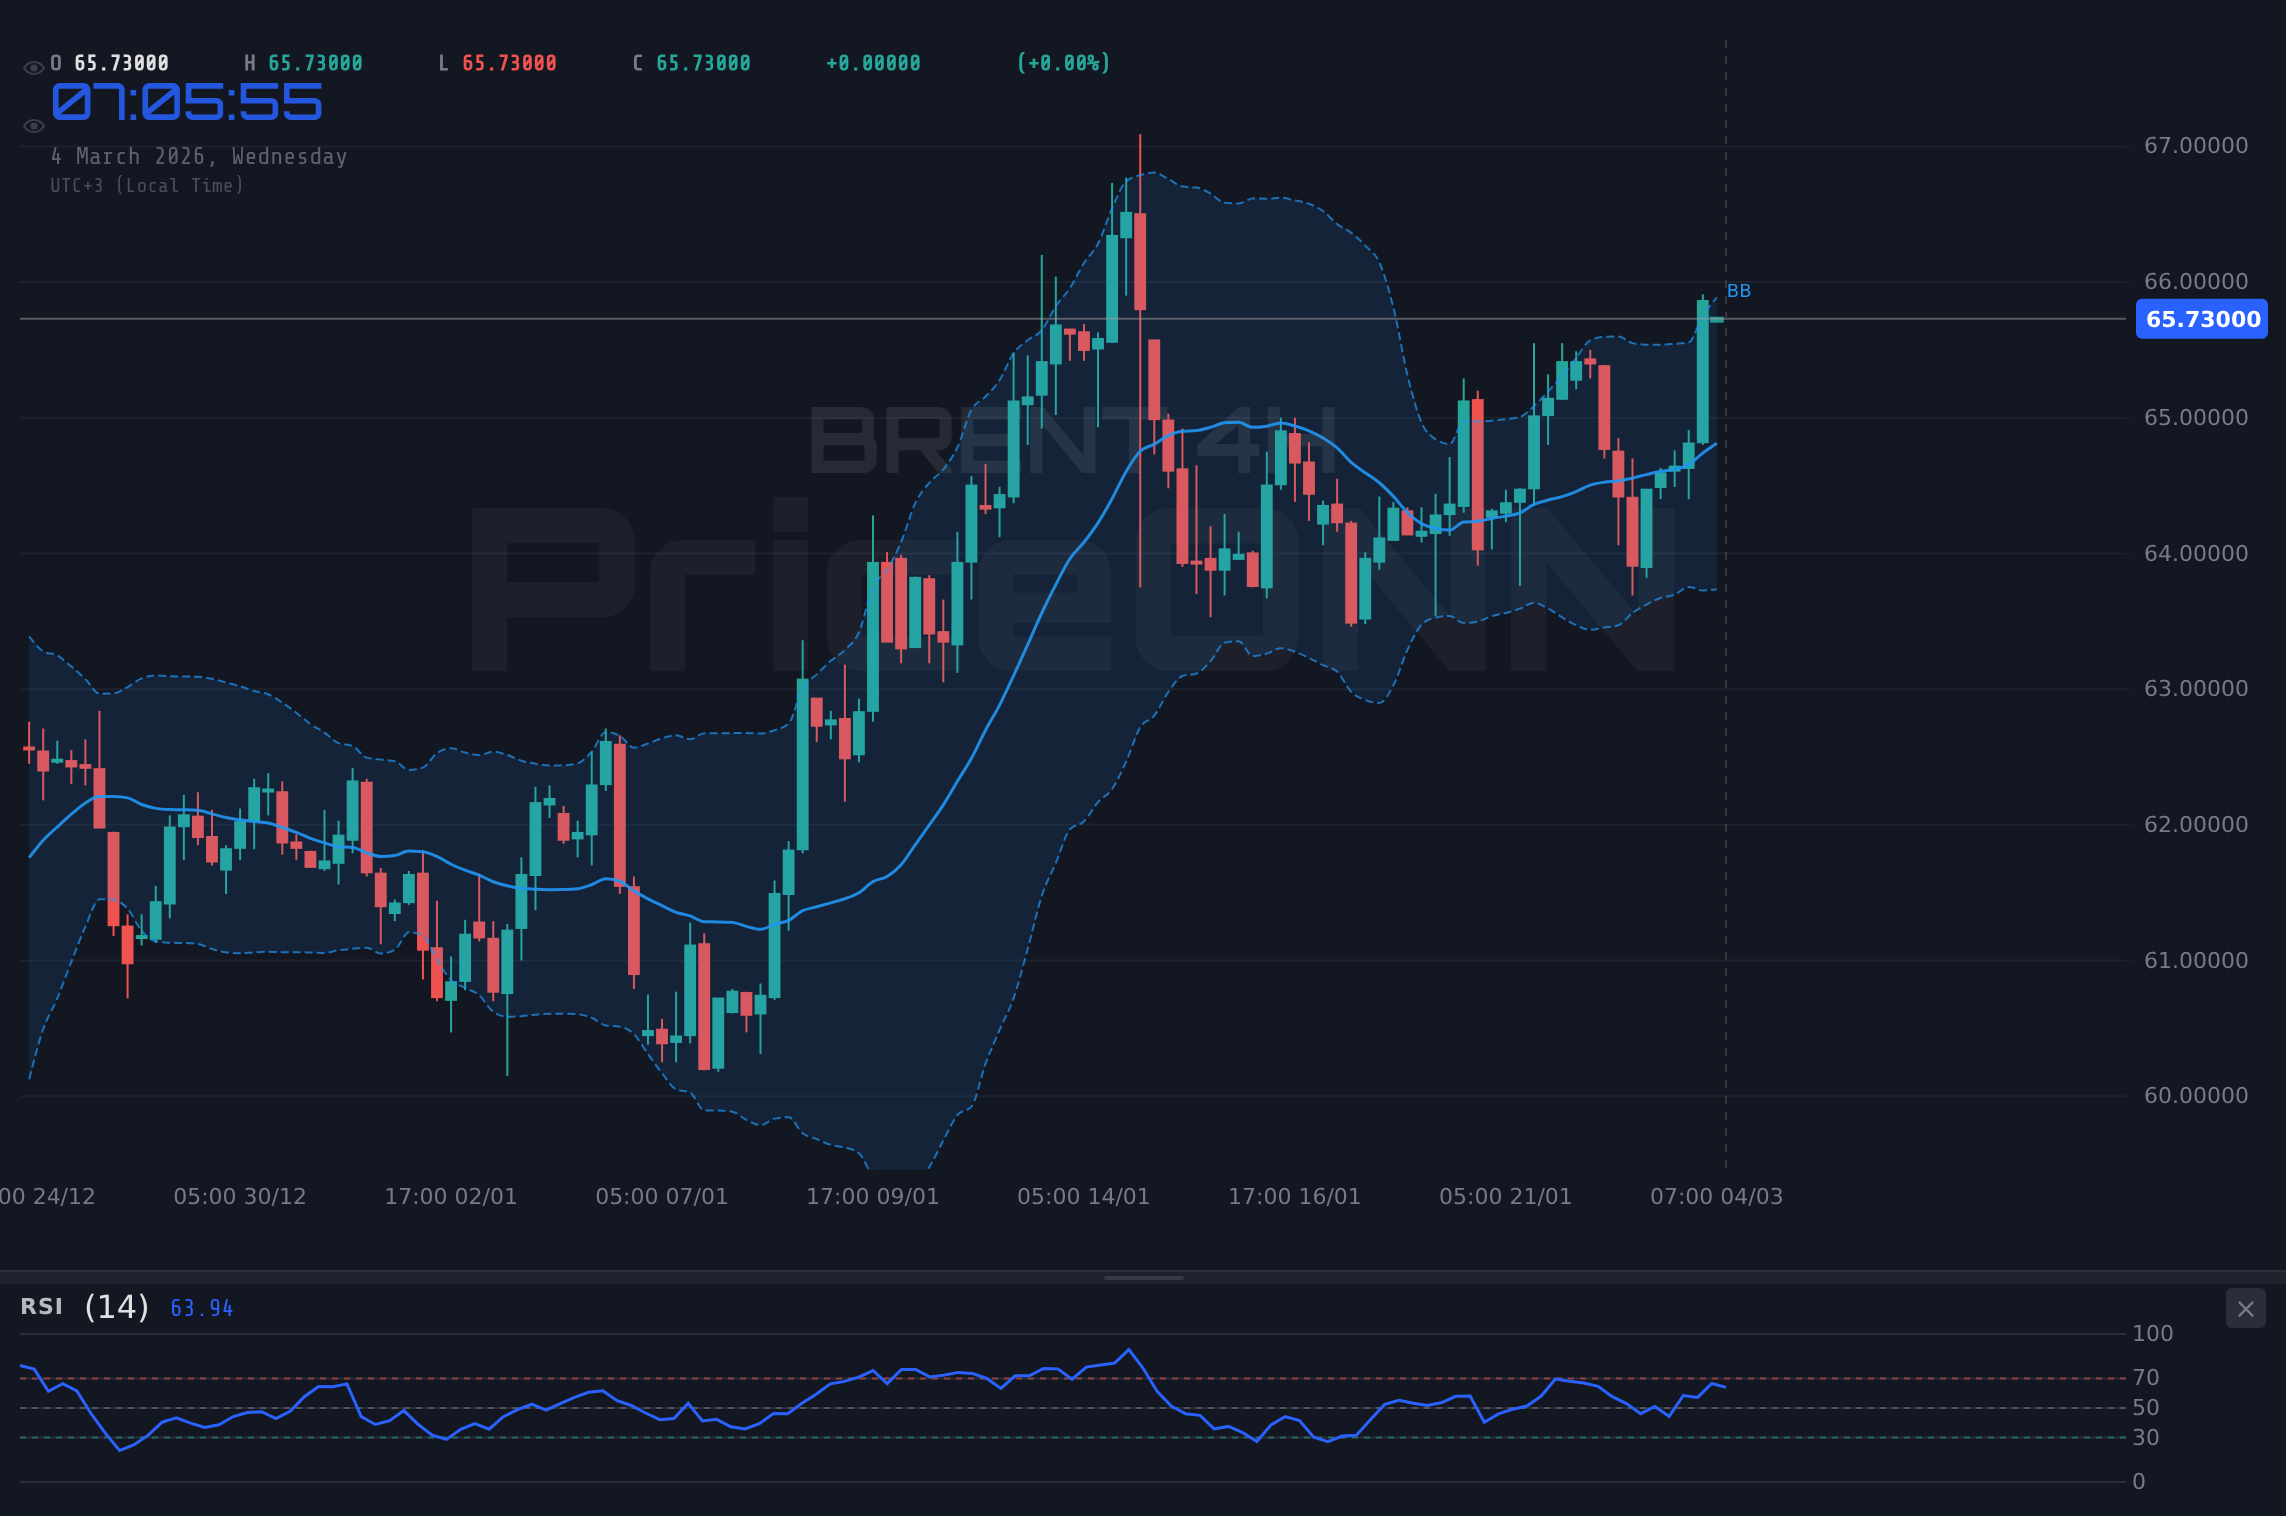
From a technical perspective, the 1D chart shows a strong uptrend with the price currently above the middle Bollinger Band. The RSI, while in neutral territory at 59.99, is trending upwards. This suggests that the bulls still have some momentum on their side. The MACD is also showing positive momentum, further supporting the bullish case. However, the Stochastic indicator shows a potential downturn with K at 54.52 and D at 58.52. Key support levels to watch are $63.61, $62.74 and $61.80.
The Bear Case for BRENT: Dollar Strength and Demand Concerns
Conversely, the bearish argument hinges on the strength of the US dollar and concerns about global demand. The DXY (Dollar Index) is currently at 98.76 and trending upwards, putting downward pressure on commodity prices, including BRENT. A stronger dollar makes crude oil more expensive for buyers using other currencies, potentially dampening demand. Concerns about a potential global economic slowdown or recession could further weigh on oil prices, as reduced economic activity typically translates to lower energy consumption. The rise in WTI crude oil to over $75 also increases pressure on utility companies.
Technically, the 1H chart presents a mixed picture. While the price is above the middle Bollinger Band, suggesting some bullish momentum, the RSI at 71.16 indicates overbought conditions, increasing the likelihood of a pullback. The ADX at 19.03 suggests a weak trend, indicating that the current bullish move may lack conviction. The Stochastic indicator is also in overbought territory with K at 90.49 and D at 81.87. Immediate resistance is at $65.42, with $65.52 and $65.62 above that. A break below the $65.20 support could invalidate the bullish scenario.
Technicals as Tiebreaker: Multi-Timeframe Analysis
To gain a clearer perspective, let's examine BRENT across multiple timeframes. The 1H chart suggests a potential short-term pullback due to overbought conditions. However, the 4H chart shows a strong uptrend with the price above the middle Bollinger Band and the RSI in neutral territory at 62.33. The Stochastic indicator on the 4H chart is showing a bullish signal with K at 68.29 and D at 44.75. The ADX is weak at 13.59. This indicates that the medium-term outlook remains bullish, but traders should be cautious of short-term volatility.
The daily chart reinforces the bullish bias, with the price trading above the middle Bollinger Band. The RSI at 59.99 is in neutral territory but trending upwards. The MACD also indicates positive momentum. The ADX shows a strong uptrend at 28.64. This suggests that the long-term trend remains upward. However, the Stochastic indicator shows a potential downturn with K at 54.52 and D at 58.52. The next major resistance level to watch on the daily chart is $65.42.
Forecasting BRENT: What Happens Next?
Given the conflicting signals, a prudent approach is to wait for confirmation before taking a decisive position. A daily close above $65.42 would open the door for a test of the $66.36 resistance level. Conversely, a break below the $63.61 support could trigger a deeper correction towards $62.74. The upcoming U.S. Crude Oil Inventories data scheduled for Wednesday at 15:30 UTC will also likely influence BRENT prices. Keep an eye on the ADP Nonfarm Employment Change data being released Wednesday at 13:15 UTC as well as the U.S. Services Purchasing Managers Index (PMI) at 14:45 UTC.
The latest geopolitical news certainly suggests the possibility of higher prices. As Reuters reported, tensions are escalating in the Middle East. The Iraqi supply cuts have also been cited by several sources. However, rising crude prices may present a return squeeze for utility companies.
Trade Recommendation: Watch Zone
The current technical condition does not present a clear-cut trading setup. A daily close above $65.42 would open the door for a long position with a potential target of $66.36. Conversely, a break below $63.61 would signal a bearish continuation towards $62.74. Traders should monitor these key levels and wait for confirmation before entering a trade.
Frequently Asked Questions: BRENT Analysis
Is BRENT a good buy right now?
BRENT is trading at $65.73, and while the daily chart shows an uptrend, the 1H chart indicates overbought conditions. A daily close above $65.42 would suggest a potential buying opportunity, but caution is warranted due to short-term pullback risks.
What is the BRENT price forecast for this week?
The BRENT price forecast for this week is mixed. Bullish momentum could push the price towards $66.36 if the $65.42 resistance is broken. However, a break below $63.61 could lead to a decline towards $62.74.
What are the key support and resistance levels for BRENT?
Key support levels for BRENT are $63.61, $62.74 and $61.80. Key resistance levels are $65.42, $66.36 and $67.23, based on the data provided.
Why is BRENT moving today?
BRENT's movement today is influenced by a combination of factors, including geopolitical tensions in the Middle East, potential supply disruptions, and the strength of the US dollar. Upcoming U.S. Crude Oil Inventories data also contribute to the volatility.
Track markets in real-time
AI-powered analysis, technical indicators and real-time price data.
Join Our Telegram Channel
Breaking market news, AI analysis and trading signals instantly.
Join Channel