BRENT Eyes $65.73 Resistance as Bullish Momentum Builds
BRENT crude oil is trading near $65.73, facing resistance as bullish momentum strengthens. Traders await upcoming spending data for further direction.
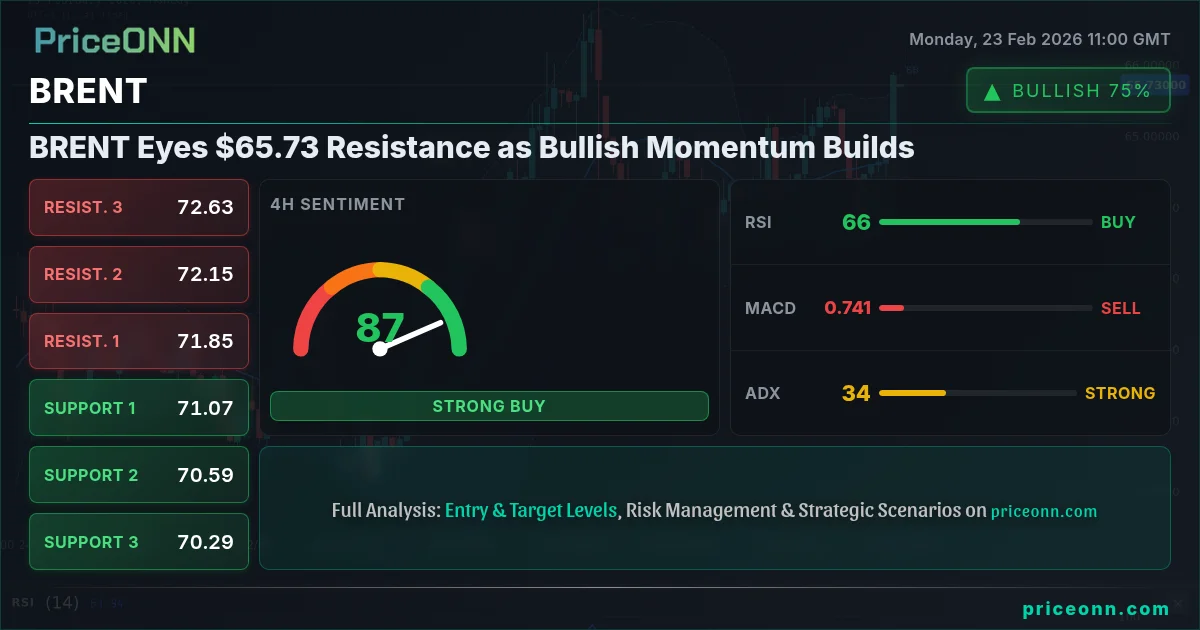
BRENT crude oil is currently caught in a tug-of-war, hovering near the $65.73 mark. Bulls are attempting to push higher, fueled by positive sentiment and a weaker dollar, while bears are citing overbought conditions and potential for a correction. The upcoming spending data release could be the catalyst that determines the next significant move.
- RSI at 71.16 signals overbought conditions on the 1H chart, suggesting potential for a pullback.
- Key resistance lies at $65.42, a break above which could trigger further upside.
- Stochastic oscillator on the 1D chart shows %K at 54.52 and %D at 58.52, indicating a potential shift in momentum.
- DXY at 97.35 is showing weakness, potentially supporting BRENT's bullish outlook.
The Bull Case for BRENT: Demand and Dollar Weakness
The bullish argument for BRENT centers around two primary factors: rising global demand and a weakening US dollar. As economies continue to recover from pandemic-induced slowdowns, the demand for crude oil is expected to increase. This increased demand, coupled with supply constraints, could drive prices higher. The International Energy Agency (IEA) has repeatedly revised its demand forecasts upward, citing strong consumption in Asia and a rebound in air travel. Furthermore, the DXY (Dollar Index) is currently at 97.35, showing signs of weakness. A weaker dollar typically makes dollar-denominated commodities like oil more attractive to international buyers, further boosting demand and prices. The 4H chart shows a robust upward trend with 82% strength, reinforcing the bullish outlook.
Technically, the 1D chart supports the bullish case. The RSI sits at 59.99, suggesting that there is still room for upside before BRENT becomes significantly overbought. The MACD histogram is positive, indicating that bullish momentum is building. The Stochastic indicator, with %K > %D, further confirms the upward trajectory. Key resistance to watch is $65.42, with a potential move towards $66.36 if this level is breached. The overall signal is AL (Buy) on the 1D timeframe, indicating a favorable environment for bullish positions. The 1H RSI at 71.16, however, warrants caution, as it suggests potential for a short-term pullback before the rally continues. Traders should also monitor the SP500 and Nasdaq indices, as a rise in these indicates risk appetite, which typically supports oil prices.
The Bear Case for BRENT: Overbought Conditions and Economic Slowdown
Despite the bullish momentum, a bearish scenario cannot be ignored. BRENT's recent surge has pushed it into overbought territory on some timeframes, raising concerns about a potential correction. The RSI on the 1H chart is at 71.16, signaling that the price may be due for a pullback. Additionally, concerns about a potential economic slowdown, particularly in China, could dampen demand for crude oil. China is a major oil consumer, and any slowdown in its economy would likely weigh on oil prices. The negative momentum on the MACD and the fact that Stochastic is showing %K
The 1H chart reveals a neutral trend, suggesting that the recent bullish momentum may be losing steam. The Stochastic indicator, with K=90.49 and D=81.87, is firmly in overbought territory, increasing the likelihood of a downside reversal. Furthermore, the ADX at 19.03 indicates a weak trend, suggesting that the current price action may not be sustainable. From a technical standpoint, a break below the $65.20 support level could trigger a deeper correction, potentially targeting the $65.10 and $64.99 levels. The overall signal on the 1H timeframe is AL (Buy), but the conflicting signals warrant caution. The DXY's movement is crucial; any strengthening of the dollar could exacerbate the bearish scenario for BRENT.
Upcoming Spending Data: The Deciding Factor
The upcoming spending data release will be a critical factor in determining BRENT's next move. Strong spending data would likely support the bullish narrative, confirming the recovery in global demand. Conversely, weak spending data would reinforce the bearish scenario, signaling a potential economic slowdown. Investors and traders will be closely watching the numbers and analyzing the implications for oil prices. The market may remain range-bound until the data is released, with traders hesitant to take strong directional positions.
The economic calendar lacks specific spending data releases for today. However, traders should monitor general economic news and sentiment for clues about potential shifts in demand. Any positive surprises could trigger a breakout above the $65.42 resistance, while negative surprises could lead to a breakdown below the $65.20 support. The overall market context, including the performance of the DXY and equity indices, will also play a crucial role in shaping BRENT's direction. The 4H chart shows ADX at 13.59 suggesting a weak trend overall.
Risk/Reward Analysis
Given the conflicting signals and the upcoming spending data release, a cautious approach is warranted. Bulls may consider waiting for a confirmed breakout above the $65.42 resistance before initiating long positions, while bears may look for a breakdown below the $65.20 support. Risk management is crucial in this environment, and traders should use stop-loss orders to limit potential losses. The 1D chart shows a robust trend with 89% strength, suggesting that the overall bias remains bullish. However, short-term pullbacks are possible, and traders should be prepared for volatility. Ultimately, the direction of BRENT will depend on the interplay between global demand, the strength of the US dollar, and the overall market sentiment.
The current market presents both opportunities and risks. The bullish case is supported by rising demand and a weaker dollar, while the bearish case is driven by overbought conditions and economic uncertainty. The upcoming spending data will be a key catalyst, and traders should closely monitor the numbers and adjust their positions accordingly. The 1H chart shows Stochastic in overbought territory, suggesting caution for short-term bullish plays. The ADX reading of 13.59 across the board indicates lack of a strong trend, which means patience is key.
Frequently Asked Questions: BRENT Analysis
Is BRENT a good buy right now?
BRENT is currently trading near $65.73, facing resistance. While the 1D trend is bullish, the 1H RSI signals overbought conditions, suggesting a potential pullback before further upside. Consider waiting for a confirmed breakout above $65.42 before entering a long position.
What is the BRENT price forecast for this week?
BRENT price forecast for this week depends heavily on the upcoming spending data. A strong data release could push the price towards $66.36 and potentially $67.23, while weak data could lead to a correction towards $65.20 or lower. Probability is highly dependent on the data.
What are the key support and resistance levels for BRENT?
Key support levels for BRENT are $65.20, $65.10, and $64.99. Key resistance levels are $65.42, $66.36, and $67.23. A break of either support or resistance could signal the next significant move.
Why is BRENT moving today?
BRENT is moving today due to a combination of factors, including rising global demand expectations and a weaker US dollar. Concerns about overbought conditions and the upcoming spending data release are also influencing price action. Traders are awaiting the data to determine the next direction.
Track markets in real-time
AI-powered analysis, technical indicators and real-time price data.
Join Our Telegram Channel
Breaking market news, AI analysis and trading signals instantly.
Join Channel