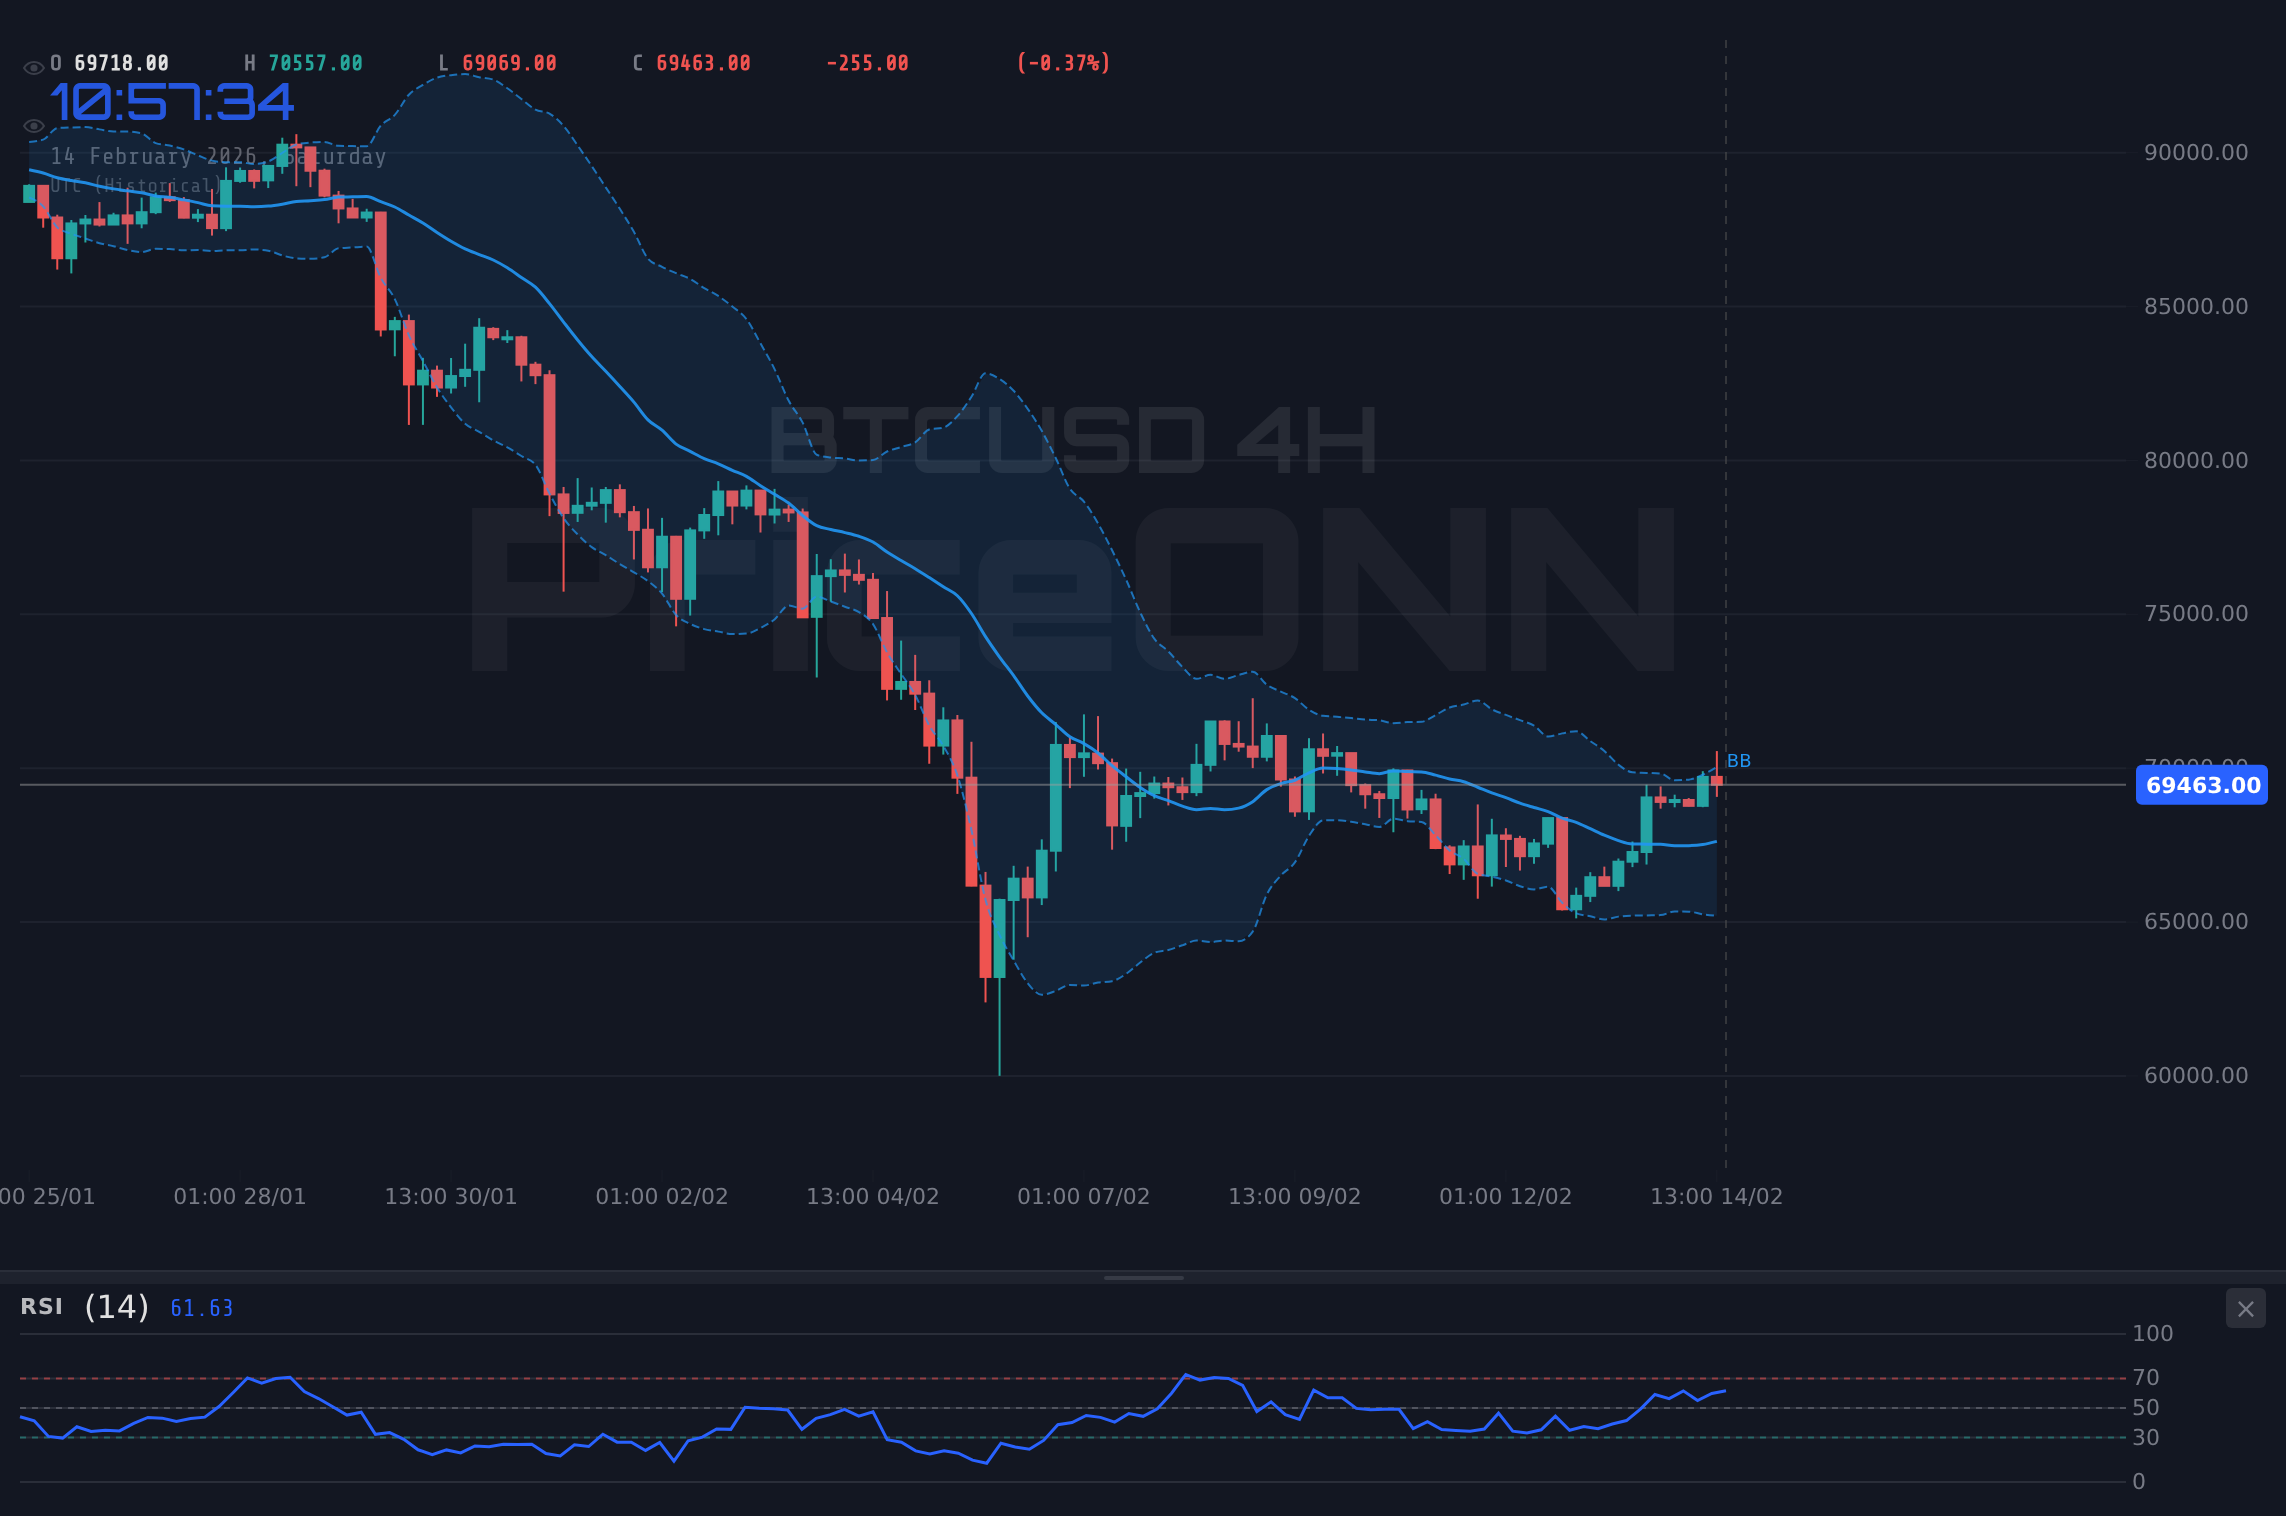
Bitcoin (BTC) is trading at $69,663.00, approaching key resistance levels after a robust upward trend. This recent bullish momentum has investors eagerly watching for potential breakout points.
With the current price at $69,663.00, the market is eyeing the next resistance zone. A breakout here could trigger significant buying interest.
Market Dynamics and Recent Performance
Bitcoin's recent movements have been characterized by a strong bullish trend. The current price reflects a significant increase, with traders keenly observing both support and resistance levels. The upward momentum is driven by various factors, including increased institutional adoption and positive market sentiment.
Technical Analysis
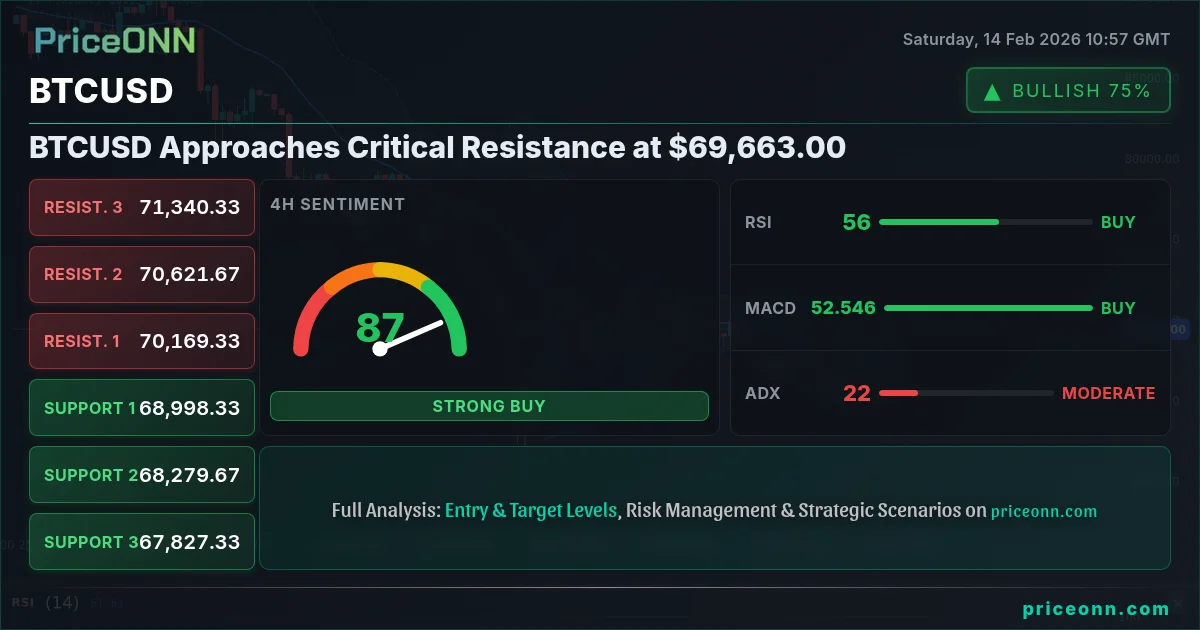
The technical indicators for BTCUSD are painting a predominantly bullish picture. Here are some key observations:
- RSI: Currently at 70.17, indicating an overbought condition, suggesting that a correction may be due soon.
- MACD: Positive momentum is present, indicating strong buying pressure.
- Support Levels: Key support is found at $69,355.33, $68,961.67, and $68,702.33.
- Resistance Levels: Key resistances are at $70,008.33, $70,267.67, and $70,661.33.
Be cautious of potential pullbacks as the RSI indicates overbought conditions. Watch for signs of strength or weakness at key levels.
Upcoming Events and Market Timeline
Trade Scenarios
Trade Plan
Scenario A: Bullish Continuation
- Direction: Long
- Entry Trigger: Close above $70,000
- Target 1: $70,500 (~$837 pip)
- Target 2: $71,000 (~$1,337 pip)
- Stop/Invalidation: Close below $69,000
Scenario B: Bearish Reversal
- Condition: Break below $69,355 support
- Entry Trigger: Close below $69,000
- Target: $68,500
- Invalidation: Close above $70,000
News Risk: Volatility may increase ahead of the inflation report on February 18. Consider reducing position sizes.
Technical Summary
| Indicator | Value | Signal | Interpretation |
|---|---|---|---|
| RSI (14) | 70.17 | Overbought | Potentially overextended |
| MACD | Positive | Strong Buy | Solid upward momentum |
| Bollinger | Upper Band | High Volatility | Possible breakout |
BTCUSD is at a critical price point. The potential for a breakout exists but comes with inherent risks. As always, managing your risks and staying informed is key to navigating these waters successfully.
Track markets in real-time
AI-powered analysis, technical indicators and real-time price data.
Join Our Telegram Channel
Breaking market news, AI analysis and trading signals instantly.
Join Channel