BTCUSD Surges 4.3% to $68,713: Technical Analysis and Key Levels
BTCUSD is currently trading at $68,713, showing a 4.3% surge. Key support and resistance levels will be explored in this analysis.
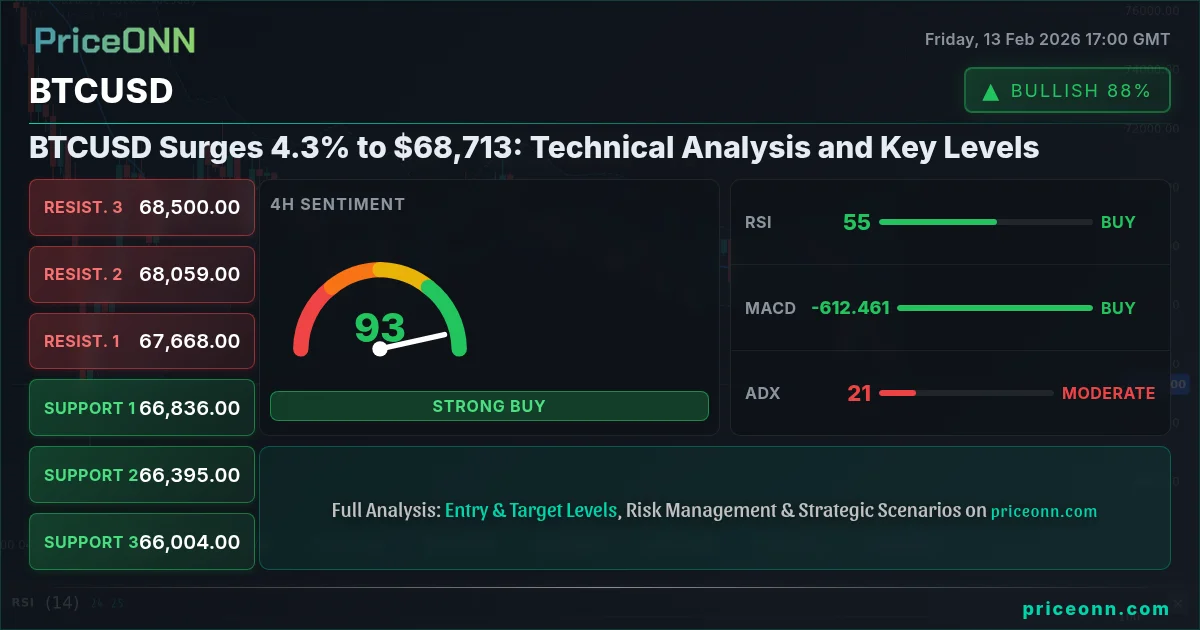
BTCUSD is making waves in the cryptocurrency market, currently trading at $68,713. This represents a significant surge of 4.3%, reflecting growing bullish sentiment among traders.
The recent price movement indicates a strong interest from buyers as BTCUSD approaches critical resistance levels.
Market Overview
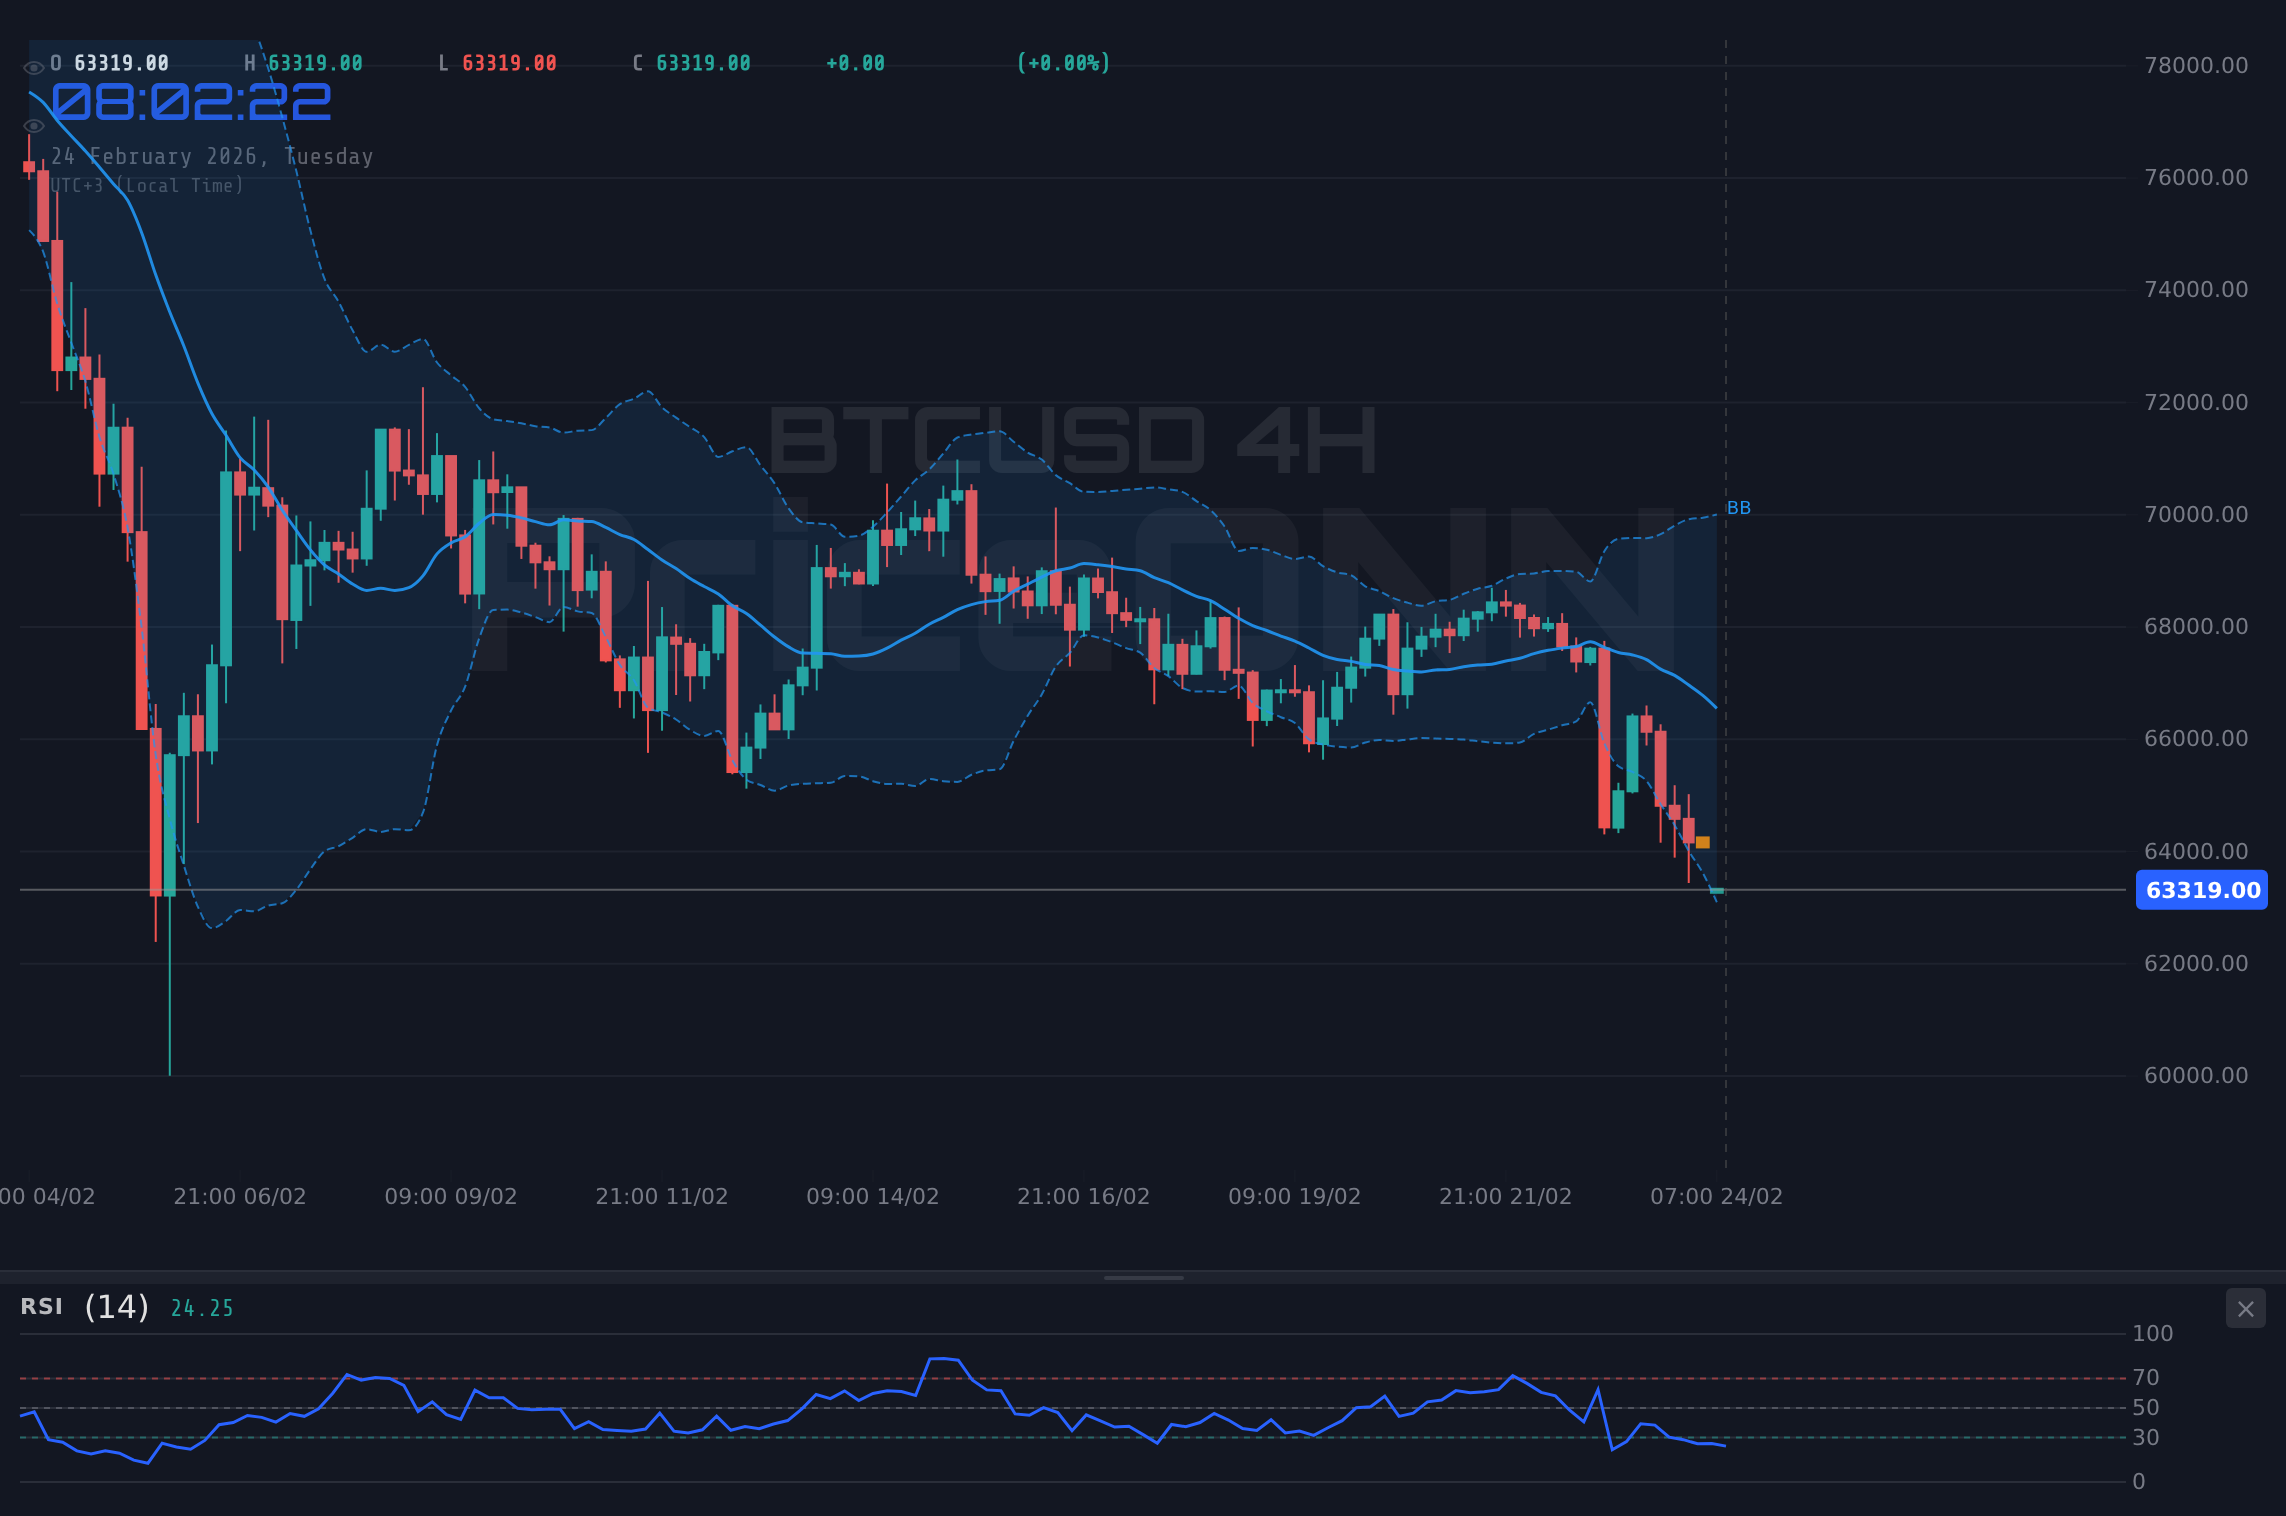
The cryptocurrency market is currently experiencing volatility, and BTCUSD is trading higher amidst broader bullish trends. The surge in price has attracted attention, especially with the upward momentum continuing to build. As we analyze the technical indicators, it is essential to pinpoint key levels that could influence future price movements.
Technical Analysis
As we dive into the technical indicators for BTCUSD, we observe a mixed yet encouraging outlook based on the timeframe examined.
- RSI (14): Currently at 70.71, indicating an overbought condition which could lead to a short-term pullback.
- MACD: The MACD is showing positive momentum, situated above the signal line which suggests continuation of the bullish trend.
- ADX: At 18.15, the ADX indicates a weak trend, implying that while bullish sentiment is present, it is not yet strongly established.
Be cautious as RSI is in the overbought territory; potential for a price correction exists.
Upcoming Economic Events
Trade Scenarios
Trade Plan
Scenario A: Bullish Continuation
- Direction: Long
- Entry Trigger: Close above $68,800
- Target 1: $70,000 (~1.8% gain)
- Target 2: $71,500 (~4.1% gain)
- Stop/Invalidation: Close below $67,500
Scenario B: Possible Pullback
- Condition: Support at $67,000 holds
- Entry Trigger: Bounce above $68,000
- Target: $69,500
- Invalidation: Close below $67,000
Haber Riski: Upcoming CPI data could lead to increased volatility. Consider reducing position size ahead of the announcement.
Technical Summary
| Indicator | Value | Signal | Interpretation |
|---|---|---|---|
| RSI (14) | 70.71 | Bearish | Overbought |
| MACD | Positive | Bullish | Above signal line |
| ADX | 18.15 | Weak | Trend strength is low |
Support and Resistance Levels
As BTCUSD continues to surge, traders should remain vigilant, monitoring these critical levels and adjusting their strategies accordingly to capitalize on potential price movements.
Track markets in real-time
AI-powered analysis, technical indicators and real-time price data.
Join Our Telegram Channel
Breaking market news, AI analysis and trading signals instantly.
Join Channel