

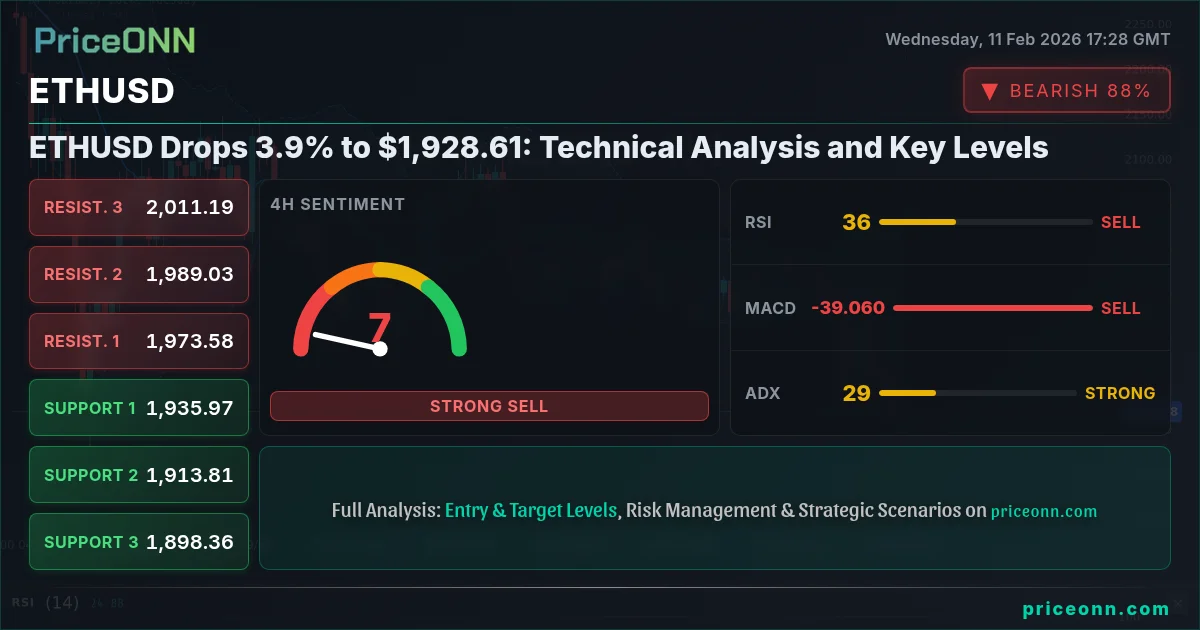
ETHUSD has seen a significant drop of 3.9% recently, now trading at $1,928.61. This price action raises critical questions about the future movements of Ethereum as traders look for signs of recovery or further declines.
As ETHUSD approaches key support levels, traders should remain vigilant for potential reversal signals.
Technical Analysis Overview
Currently, ETHUSD is facing selling pressure, with the price dropping to $1,928.61. The recent trend indicates a bearish sentiment, as observed in the 1-hour and 4-hour time frames.
Stat Cards
Current Market Sentiment
ETHUSD is currently experiencing a strong bearish trend. The price has touched significant support levels that could determine the next movements:
- Support Levels:
- S1: $1,913.27
- S2: $1,885.54
- S3: $1,835.56
Technical Indicators
Let's delve into the technical indicators that give us insight into the current market conditions:
| Indicator | Value | Signal | Interpretation |
|---|---|---|---|
| RSI (14) | 30.19 | Bearish | Oversold territory |
| MACD | -0.45 | Bearish | Below the signal line |
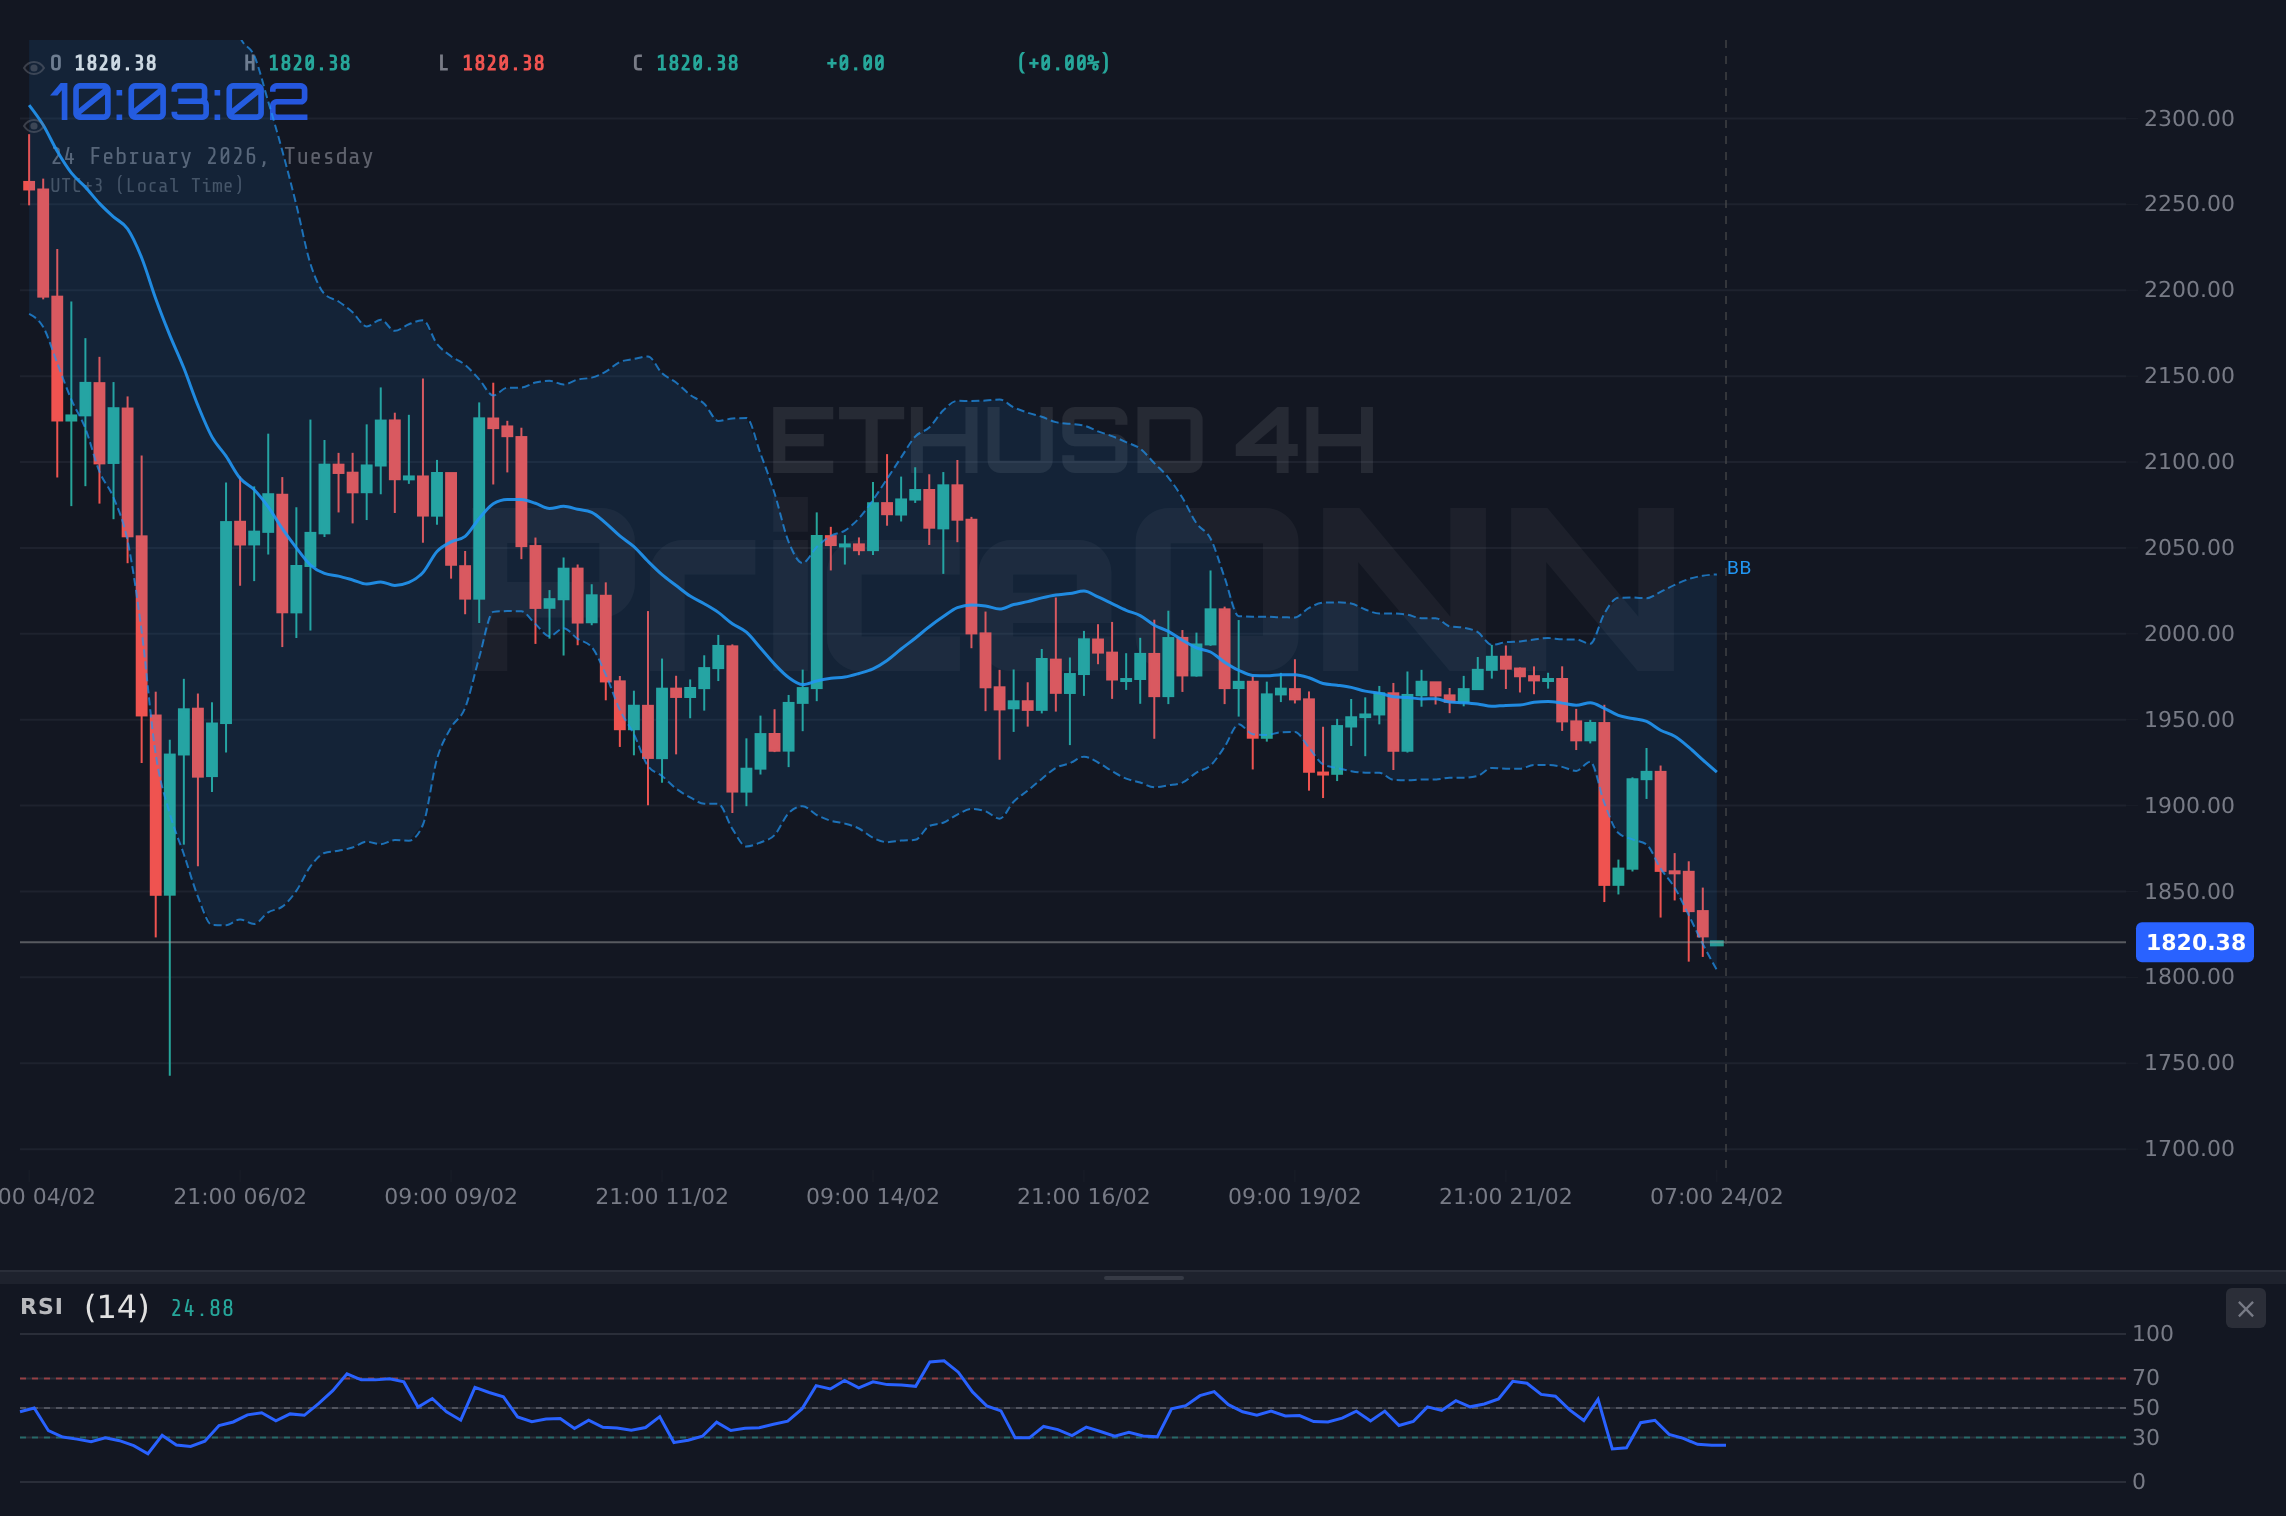
| Bollinger Bands | Narrow | Weak | Potential breakout expected |
Be cautious as ETHUSD is currently in an oversold condition. Trading against the trend can be risky.
Upcoming Events
Upcoming economic data may influence ETHUSD movements significantly. Pay attention to these events:
Consider monitoring RSI levels for potential bounce-back opportunities as the price approaches support.
Trade Scenarios
Trade Plan
Scenario A: Continuation of Downtrend
- Direction: Short
- Entry Trigger: Close below $1,913.27
- Target 1: $1,885.54 (~$28.73)
- Target 2: $1,835.56 (~$57.98)
- Stop/Invalidation: Close above $1,928.61
Scenario B: Reversal Opportunity
- Condition: Support at $1,913.27 holds + RSI divergence
- Entry Trigger: Close above $1,928.61
- Target: $1,990.98
- Invalidation: Close below $1,885.54
News Risk: Volatility may increase ahead of CPI data. Consider reducing position size.
Support and Resistance Levels
The recent drop in ETHUSD presents both risks and opportunities for traders. Keeping a close eye on support and resistance levels, along with key economic indicators, will be crucial in navigating the upcoming weeks.
Track markets in real-time
AI-powered analysis, technical indicators and real-time price data.
Join Our Telegram Channel
Breaking market news, AI analysis and trading signals instantly.
Join Channel