

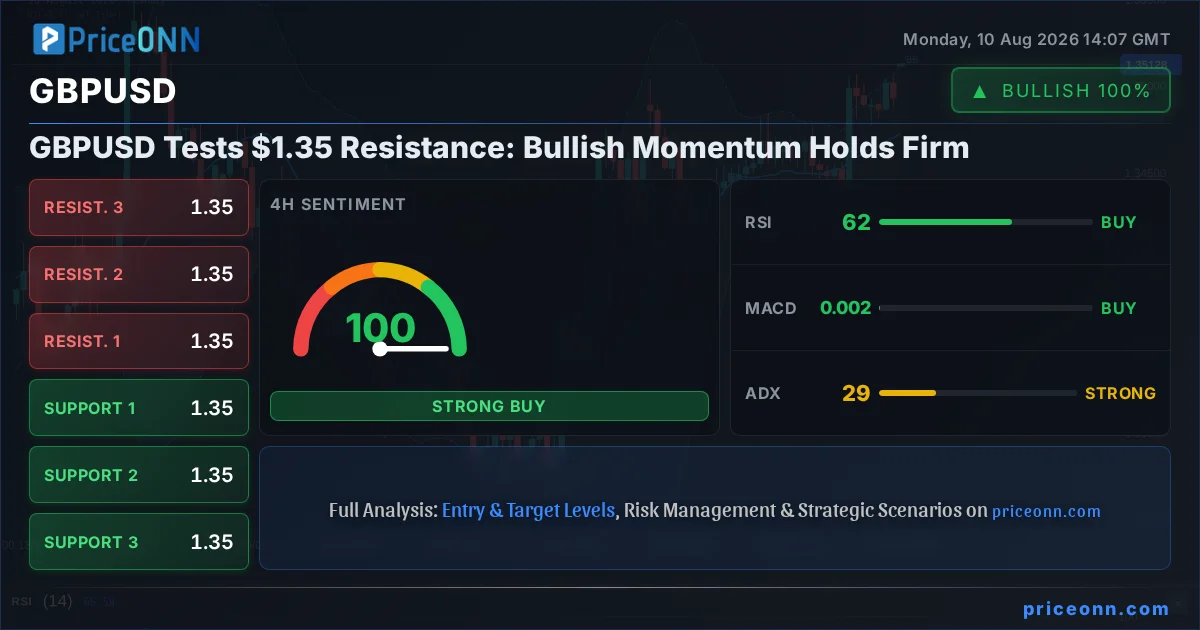
GBPUSD is currently navigating a critical juncture, trading at the $1.35 mark. This level represents not just a psychological threshold but a significant area of resistance that has historically dictated the pair's short-to-medium term trajectory. The recent surge, fueled by a potent mix of technical indicators and shifting market sentiment, has brought Sterling to this pivotal point. Now, the question on every trader's mind is whether this bullish momentum can overcome the overhead resistance, or if a consolidation or pullback is on the cards.
- GBPUSD is trading at $1.35, testing a key resistance level.
- RSI at 62.92 on the 1H chart signals bullish momentum, though approaching overbought territory.
- ADX at 28.68 on the 4H chart indicates a strong uptrend, suggesting further potential upside.
- Key resistance is identified at $1.35277, with support found at $1.34719.
The narrative surrounding GBPUSD has shifted considerably in recent weeks. Following a period of consolidation, the pair has embarked on a discernible upward trend, driven by a confluence of factors. From a technical standpoint, the visual cues on the charts are compelling. The 4-hour timeframe, in particular, paints a picture of strength, with an ADX reading of 28.68 suggesting a firmly established uptrend. This is not a fleeting move; it's a trend with conviction behind it, backed by solid price action and positive momentum indicators across multiple timeframes. The recent upward push has been significant, bringing GBPUSD to its current test of the $1.35 psychological barrier and immediate resistance levels.
Delving deeper into the technical indicators provides a more nuanced view of the current market dynamics. On the 1-hour chart, the Relative Strength Index (RSI) stands at 62.92. While this indicates bullish momentum, it's also approaching the threshold that often precedes a period of consolidation or profit-taking. Traders are watching this closely; a sustained push above 70 could signal an overbought condition, but currently, it suggests there's still room for buyers to exert influence. The Moving Average Convergence Divergence (MACD) histogram is showing positive momentum on the 4-hour and daily charts, reinforcing the bullish sentiment. However, the 1-hour MACD is currently less decisive, indicating a potential stabilization or slight pullback in immediate intraday trading. This divergence between timeframes is crucial for understanding the immediate intraday versus the broader trend.
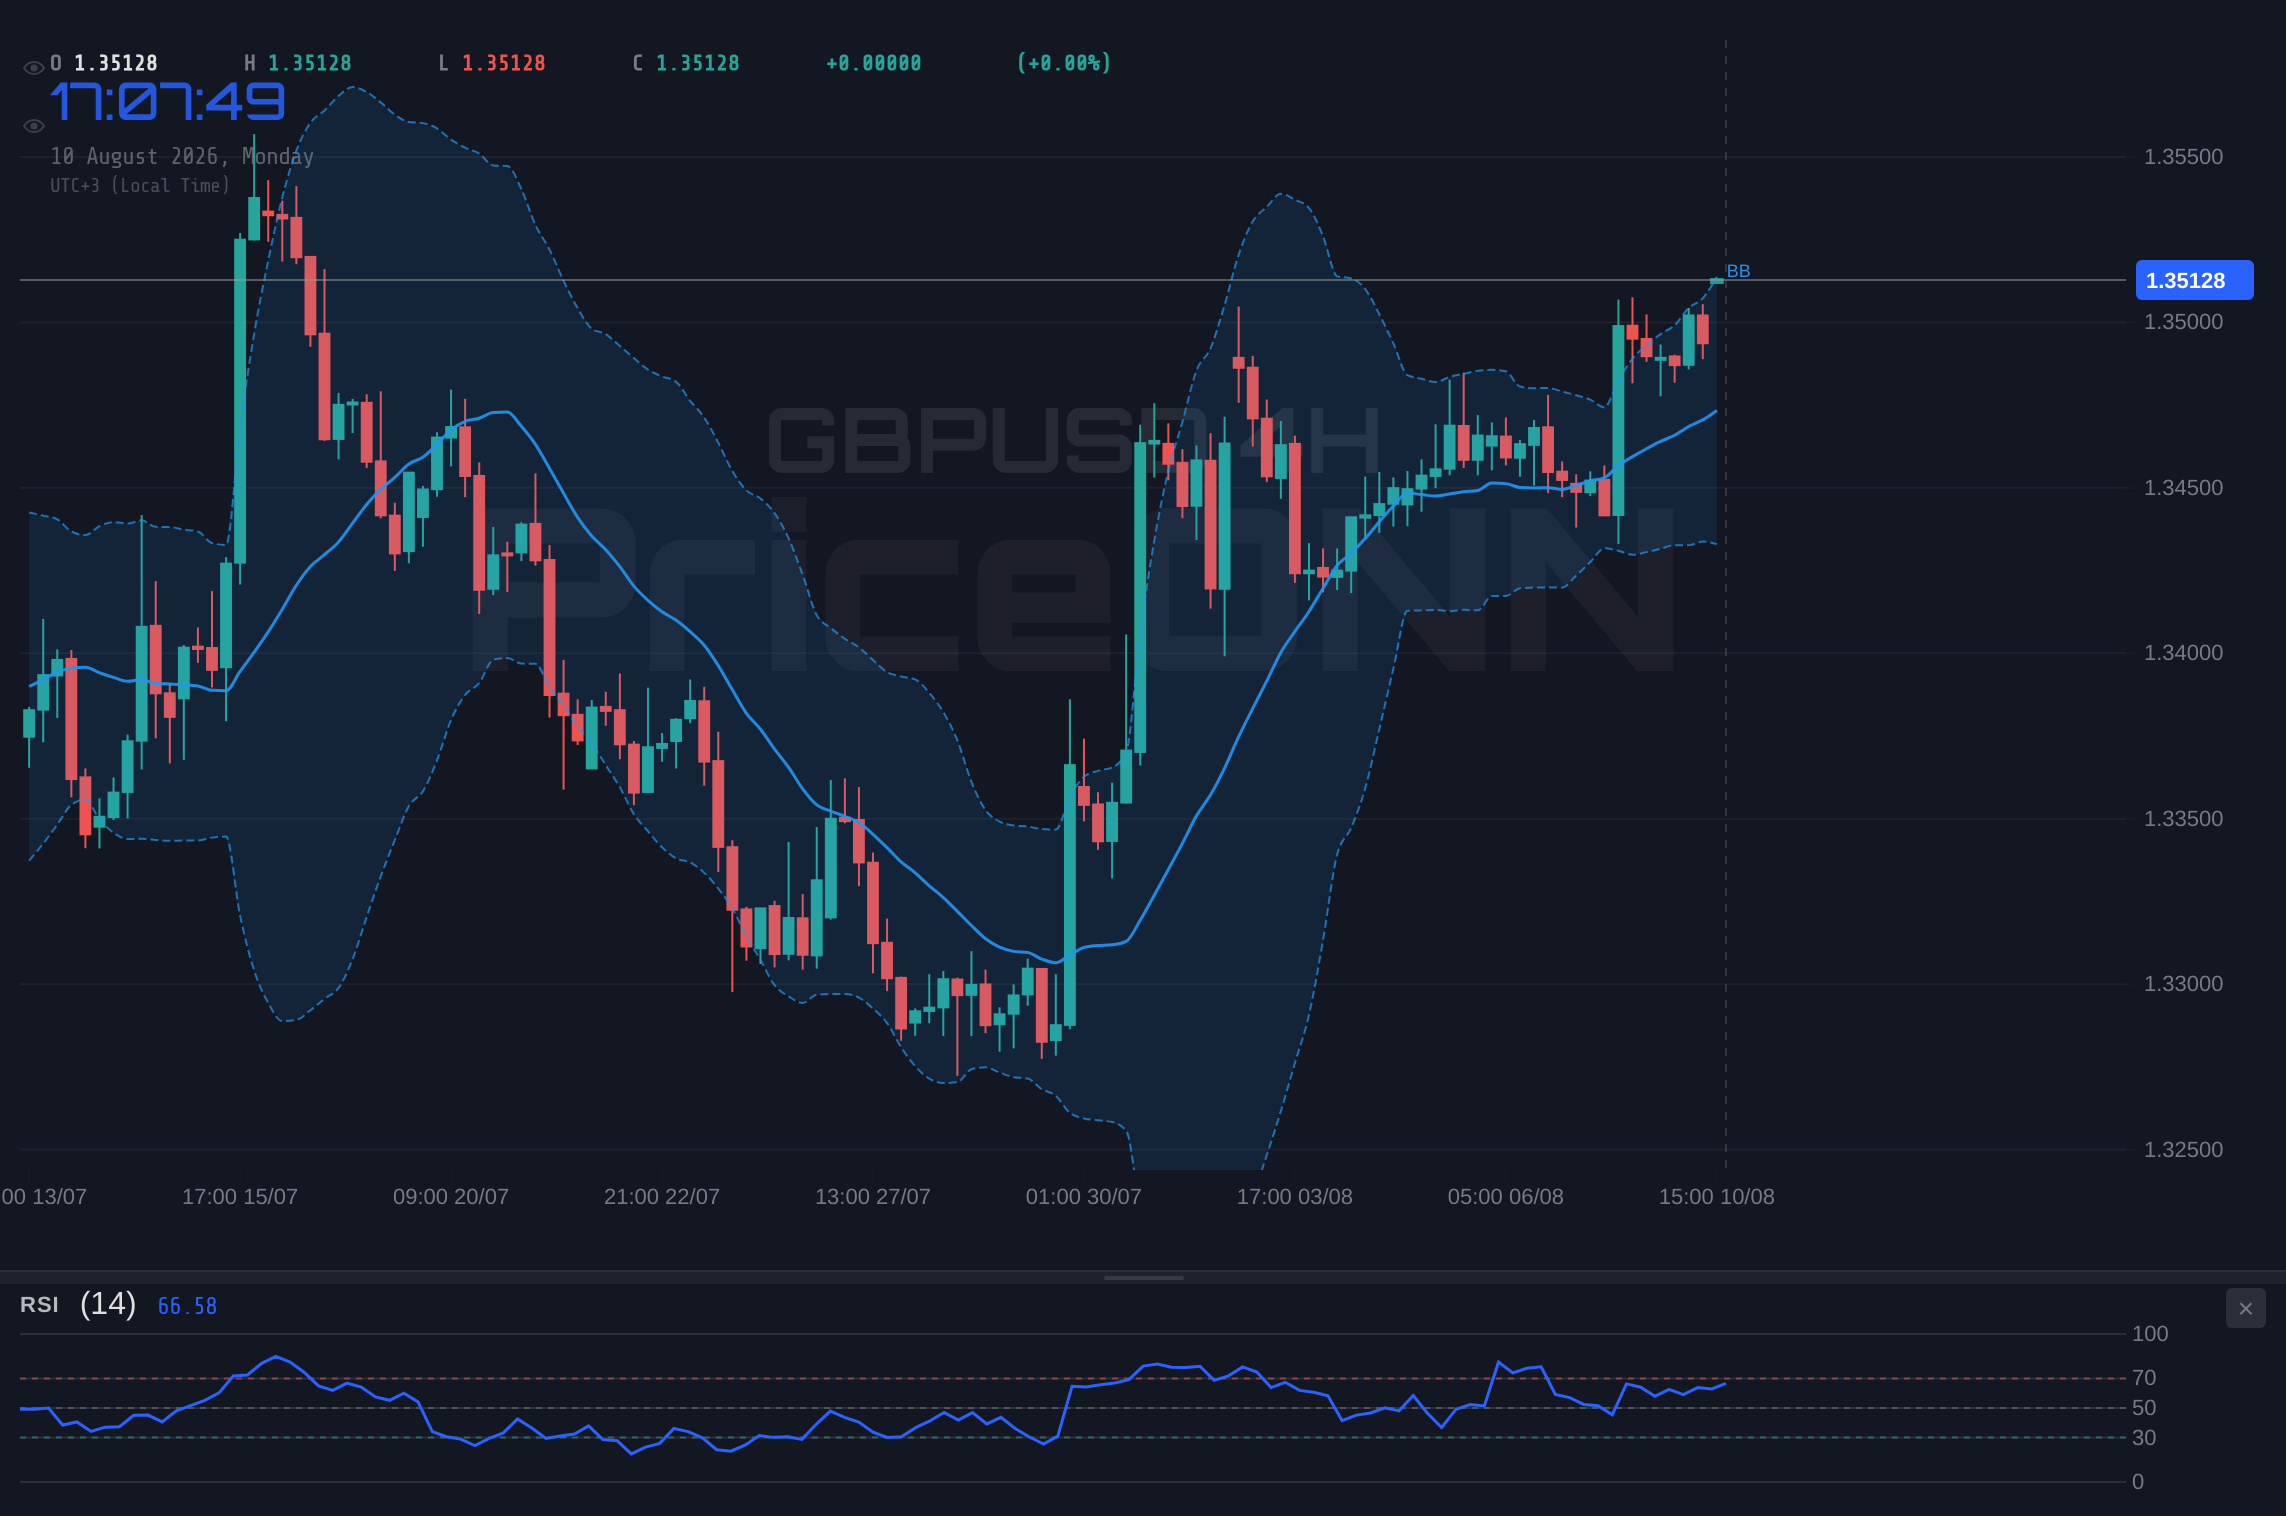
Looking at the 4-hour chart, the ADX at 28.68 is a significant marker. An ADX value above 25 generally signifies a strong trend, and its position here confirms that the recent upward move in GBPUSD has substantial backing. This suggests that the underlying trend is robust and may have further room to run. The Stochastic Oscillator on the same timeframe shows %K at 82.17 and %D at 76.46, indicating an overbought condition. While this can sometimes precede a reversal, in a strong trend, it can also persist for some time. The key is to watch for divergence or a clear cross-over signal, which would be a more reliable indicator of a potential shift. The daily chart echoes this bullish sentiment, with RSI at 58.58 and positive MACD momentum, further validating the strength of the prevailing uptrend.
The immediate price action reveals key levels that are crucial for traders to monitor. On the downside, support is clearly defined on the 4-hour chart at $1.34905 (S1), followed by $1.34788 (S2) and $1.34719 (S3). A decisive break below these levels would signal a potential shift in sentiment and could initiate a pullback. Conversely, the resistance levels are where the current battle is being waged. The first significant resistance is found at $1.35091 (R1), followed by $1.3516 (R2) and $1.35277 (R3). A sustained close above $1.35277, particularly on the 4-hour chart, would be a strong signal that the bullish trend is continuing and could pave the way for further upside.
The broader market context also plays a vital role in understanding the forces influencing GBPUSD. The US Dollar Index (DXY) is currently trading around 99.8. While the DXY has shown some strength recently, its upward momentum has been somewhat capped, which indirectly supports GBPUSD. A stronger dollar typically exerts downward pressure on GBPUSD, but if the DXY's gains are limited or if it begins to decline, Sterling has more room to appreciate. The recent US labor market data for July 2026, particularly the Non-Farm Payrolls (NFP) report released on August 7th, showed a mixed picture. While the headline NFP number might have been strong enough to prevent immediate Fed rate cuts, underlying wage growth figures and revisions suggested some cooling, which could temper the dollar's strength and provide a tailwind for GBPUSD.
Geopolitical factors, while not the primary driver currently, always remain in the background. Tensions in the Middle East, particularly concerning oil supply routes, continue to influence global risk sentiment. However, the US energy sector's resilience, as noted in recent reports, has somewhat mitigated immediate supply shock fears, preventing a significant risk-off move that would typically benefit safe-haven currencies over Sterling. The Eurozone's Sentix Investor Confidence index turning positive in August is also a subtle positive for Sterling, as a healthier European economy often correlates with better global trade conditions, indirectly benefiting the UK.
The interplay between these fundamental drivers and the technical picture creates a compelling scenario for GBPUSD. While the daily and 4-hour charts scream 'bullish trend', the 1-hour RSI hovering around 63 and the Stochastic nearing overbought territory on the 4-hour chart suggest that immediate intraday gains might be capped. This creates a classic resistance test scenario. If buyers can push through the immediate resistance levels with conviction, supported by strong volume and a DXY that fails to regain significant upward momentum, then the path to higher levels opens up. However, failure to break through could see a retracement towards the support levels we've identified, offering a different trading opportunity.
From a trader's perspective, managing risk around this key resistance level is paramount. A breakout strategy would involve looking for a decisive close above $1.35277 on a significant timeframe, perhaps the 4-hour or daily chart, ideally with increased volume confirming the move. Entry would be placed on confirmation of the breakout, with initial targets set at the next psychological levels and potentially higher resistance points identified further out. Stop-loss orders would be crucial, placed below the breakout level or a key support level like $1.34719 to cap potential losses if the breakout fails.
Alternatively, a pullback strategy could be considered if the resistance at $1.35277 holds firm. This would involve waiting for price to retrace towards the identified support levels, such as $1.34905 or $1.34719. A bounce off these support levels, confirmed by bullish reversal patterns or indicators, could present a buying opportunity with tighter risk management. The key here is patience and waiting for the market to signal its next clear direction rather than trying to anticipate a top or bottom prematurely.
The upcoming economic calendar, particularly any further data releases from the US and UK, will be crucial in shaping the next move. While the recent US labor market data provided some insight, upcoming inflation figures or central bank commentary could significantly alter the outlook for both the dollar and Sterling. Investors will be closely watching for any hints regarding future monetary policy from both the Federal Reserve and the Bank of England. Any unexpected hawkish or dovish signals could easily sway GBPUSD out of its current consolidation pattern.
The current technical setup for GBPUSD presents a compelling case for a potential continuation of the bullish trend, provided the resistance at $1.35277 can be decisively overcome. The strong ADX reading on the 4-hour chart suggests underlying trend strength, and positive momentum on longer timeframes lends further credence to the bullish outlook. However, the proximity to overbought conditions on shorter timeframes and the psychological significance of the $1.35 level mean that caution is warranted. Traders must remain vigilant, closely monitoring price action around the identified support and resistance levels, and be prepared to adapt their strategies based on incoming data and market reactions.
Bearish Scenario: Resistance Holds
30% ProbabilityNeutral Scenario: Consolidation Around $1.35
35% ProbabilityBullish Scenario: Breakout Continuation
35% ProbabilityFrequently Asked Questions: GBPUSD Analysis
What happens if GBPUSD breaks above the $1.35277 resistance level?
A confirmed break above $1.35277, especially on the 4-hour chart, would invalidate immediate bearish concerns and likely trigger further buying. This could see GBPUSD target resistance levels like $1.35617 and potentially extend towards $1.35824 as the bullish trend gains renewed momentum.
Should I buy GBPUSD at current levels around $1.35 given the RSI is at 62.92?
Buying at $1.35 requires caution as it's a key resistance zone. While the RSI at 62.92 indicates bullish momentum, it's approaching overbought territory on the 1H chart. A more prudent approach might be to wait for a confirmed breakout above $1.35277 or a pullback to support around $1.34905, offering a better risk-reward setup.
Is the ADX at 28.68 a strong sell signal for GBPUSD?
No, an ADX of 28.68 on the 4-hour chart is not a sell signal; it indicates a strong trend. This value signifies that the current upward move has significant conviction. While it doesn't tell us the direction, in conjunction with other indicators showing bullish momentum, it supports the idea of a continuing uptrend rather than a reversal.
How will upcoming US labor market data affect GBPUSD this week?
Any significant deviation in upcoming US labor market data from expectations could impact the DXY and, consequently, GBPUSD. Stronger-than-expected data might boost the dollar, pressuring GBPUSD lower, while weaker data could weaken the dollar, providing a tailwind for Sterling to potentially break through current resistance levels.
| Indicator | Value | Signal | Interpretation |
|---|---|---|---|
| RSI (14) | 62.92 | Neutral | Bullish momentum, approaching overbought territory on 1H. |
| MACD Histogram | +0.00078 | Bullish | Positive momentum on 4H, less clear on 1H. |
| Stochastic | K:82.17, D:76.46 | Bullish | Overbought on 4H, suggests potential consolidation or continuation. |
| ADX | 28.68 | Bullish | Strong uptrend confirmed on 4H. |
| Bollinger Bands | Upper Band | Bullish | Price above middle band on 4H, indicating upward pressure. |
Track markets in real-time
AI-powered analysis, technical indicators and real-time price data.
Join Our Telegram Channel
Breaking market news, AI analysis and trading signals instantly.
Join Channel