

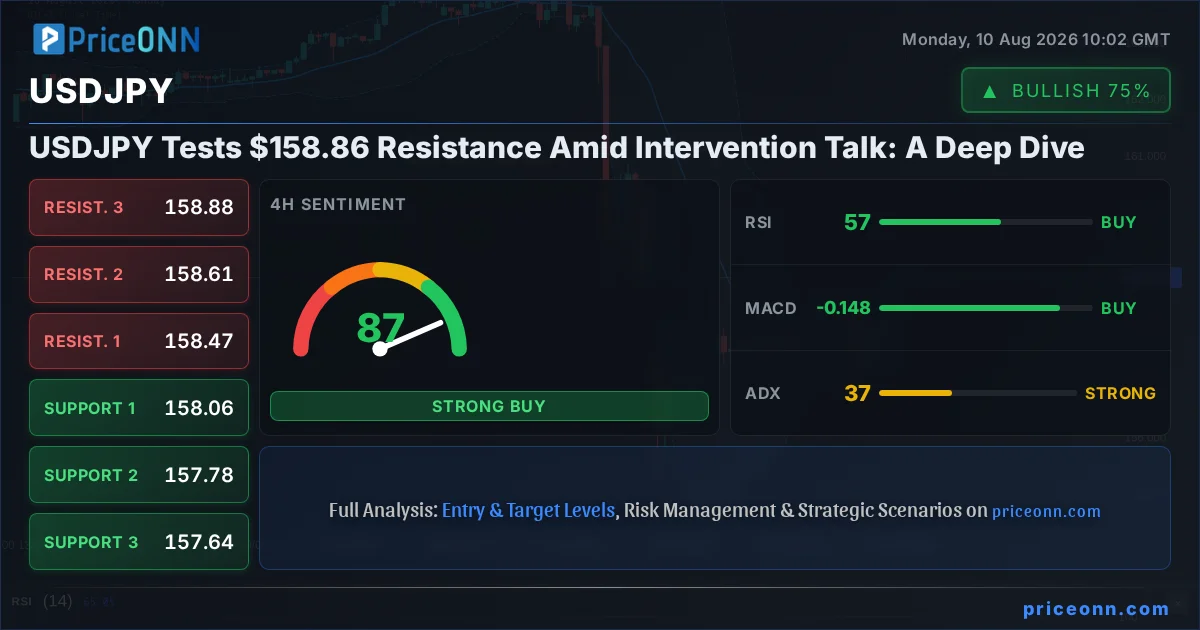
The currency pair USDJPY is currently finding itself at a critical juncture, hovering precariously around the $158.86 mark. This level, a significant resistance point, is being tested amidst a chorus of speculation about potential currency intervention from both Japanese and US authorities. The market is holding its breath, weighing the implications of this technical resistance against the backdrop of escalating geopolitical tensions and divergent monetary policy expectations. This dance between technical levels and fundamental pressures creates a complex environment for traders, demanding a nuanced approach to navigating the pair's next move. The question on everyone's mind is whether the current uptrend can sustain its momentum or if intervention fears will finally bring this powerful rally to a halt.
- USDJPY is currently trading at $158.86, testing a significant resistance level.
- The 1-day ADX at 37.26 indicates a strong downtrend, contradicting shorter-term signals and highlighting potential trend exhaustion.
- RSI(14) at 39.89 on the daily chart suggests further downside potential, despite shorter-term bullish signals.
- Intervention talk and geopolitical risks are creating significant market uncertainty, impacting USDJPY's correlation with DXY and safe-haven assets.
The recent surge in USDJPY has been nothing short of dramatic, pushing the pair towards levels not seen in a considerable time. On the 1-hour chart, the trend is technically neutral, but the ADX reading of 24.95 still points to a moderately strong uptrend, suggesting that momentum traders are still in play. However, a closer look at the longer timeframes reveals a more complex picture. The 4-hour chart shows a neutral trend with a strong ADX of 37.36, indicating a robust trend, though the direction is not clearly defined by the ADX alone. It's the daily chart that paints a more cautious narrative. While shorter-term indicators might hint at continued upside, the daily ADX at 37.26 signifies a strong downtrend, which is a significant contradiction. This divergence across timeframes is precisely where the market's current tension lies, creating a battleground between short-term bullish momentum and longer-term bearish undertones.
The technical indicators on the shorter timeframes offer a mixed bag, but lean towards caution when viewed holistically. On the 1-hour chart, the RSI(14) is sitting at 70.83, firmly in overbought territory, signaling that the recent upward move might be getting stretched and vulnerable to a pullback. This is further corroborated by the Stochastic oscillator, with %K at 97.62 and %D at 94.06, both in extreme overbought conditions and suggesting a potential reversal or at least a pause. The MACD, however, remains positive, with its histogram above the signal line, indicating that bullish momentum is still present, albeit potentially weakening. The Bollinger Bands on this timeframe are also showing the price trading above the upper band, which can sometimes precede a sharp reversal or a period of consolidation.
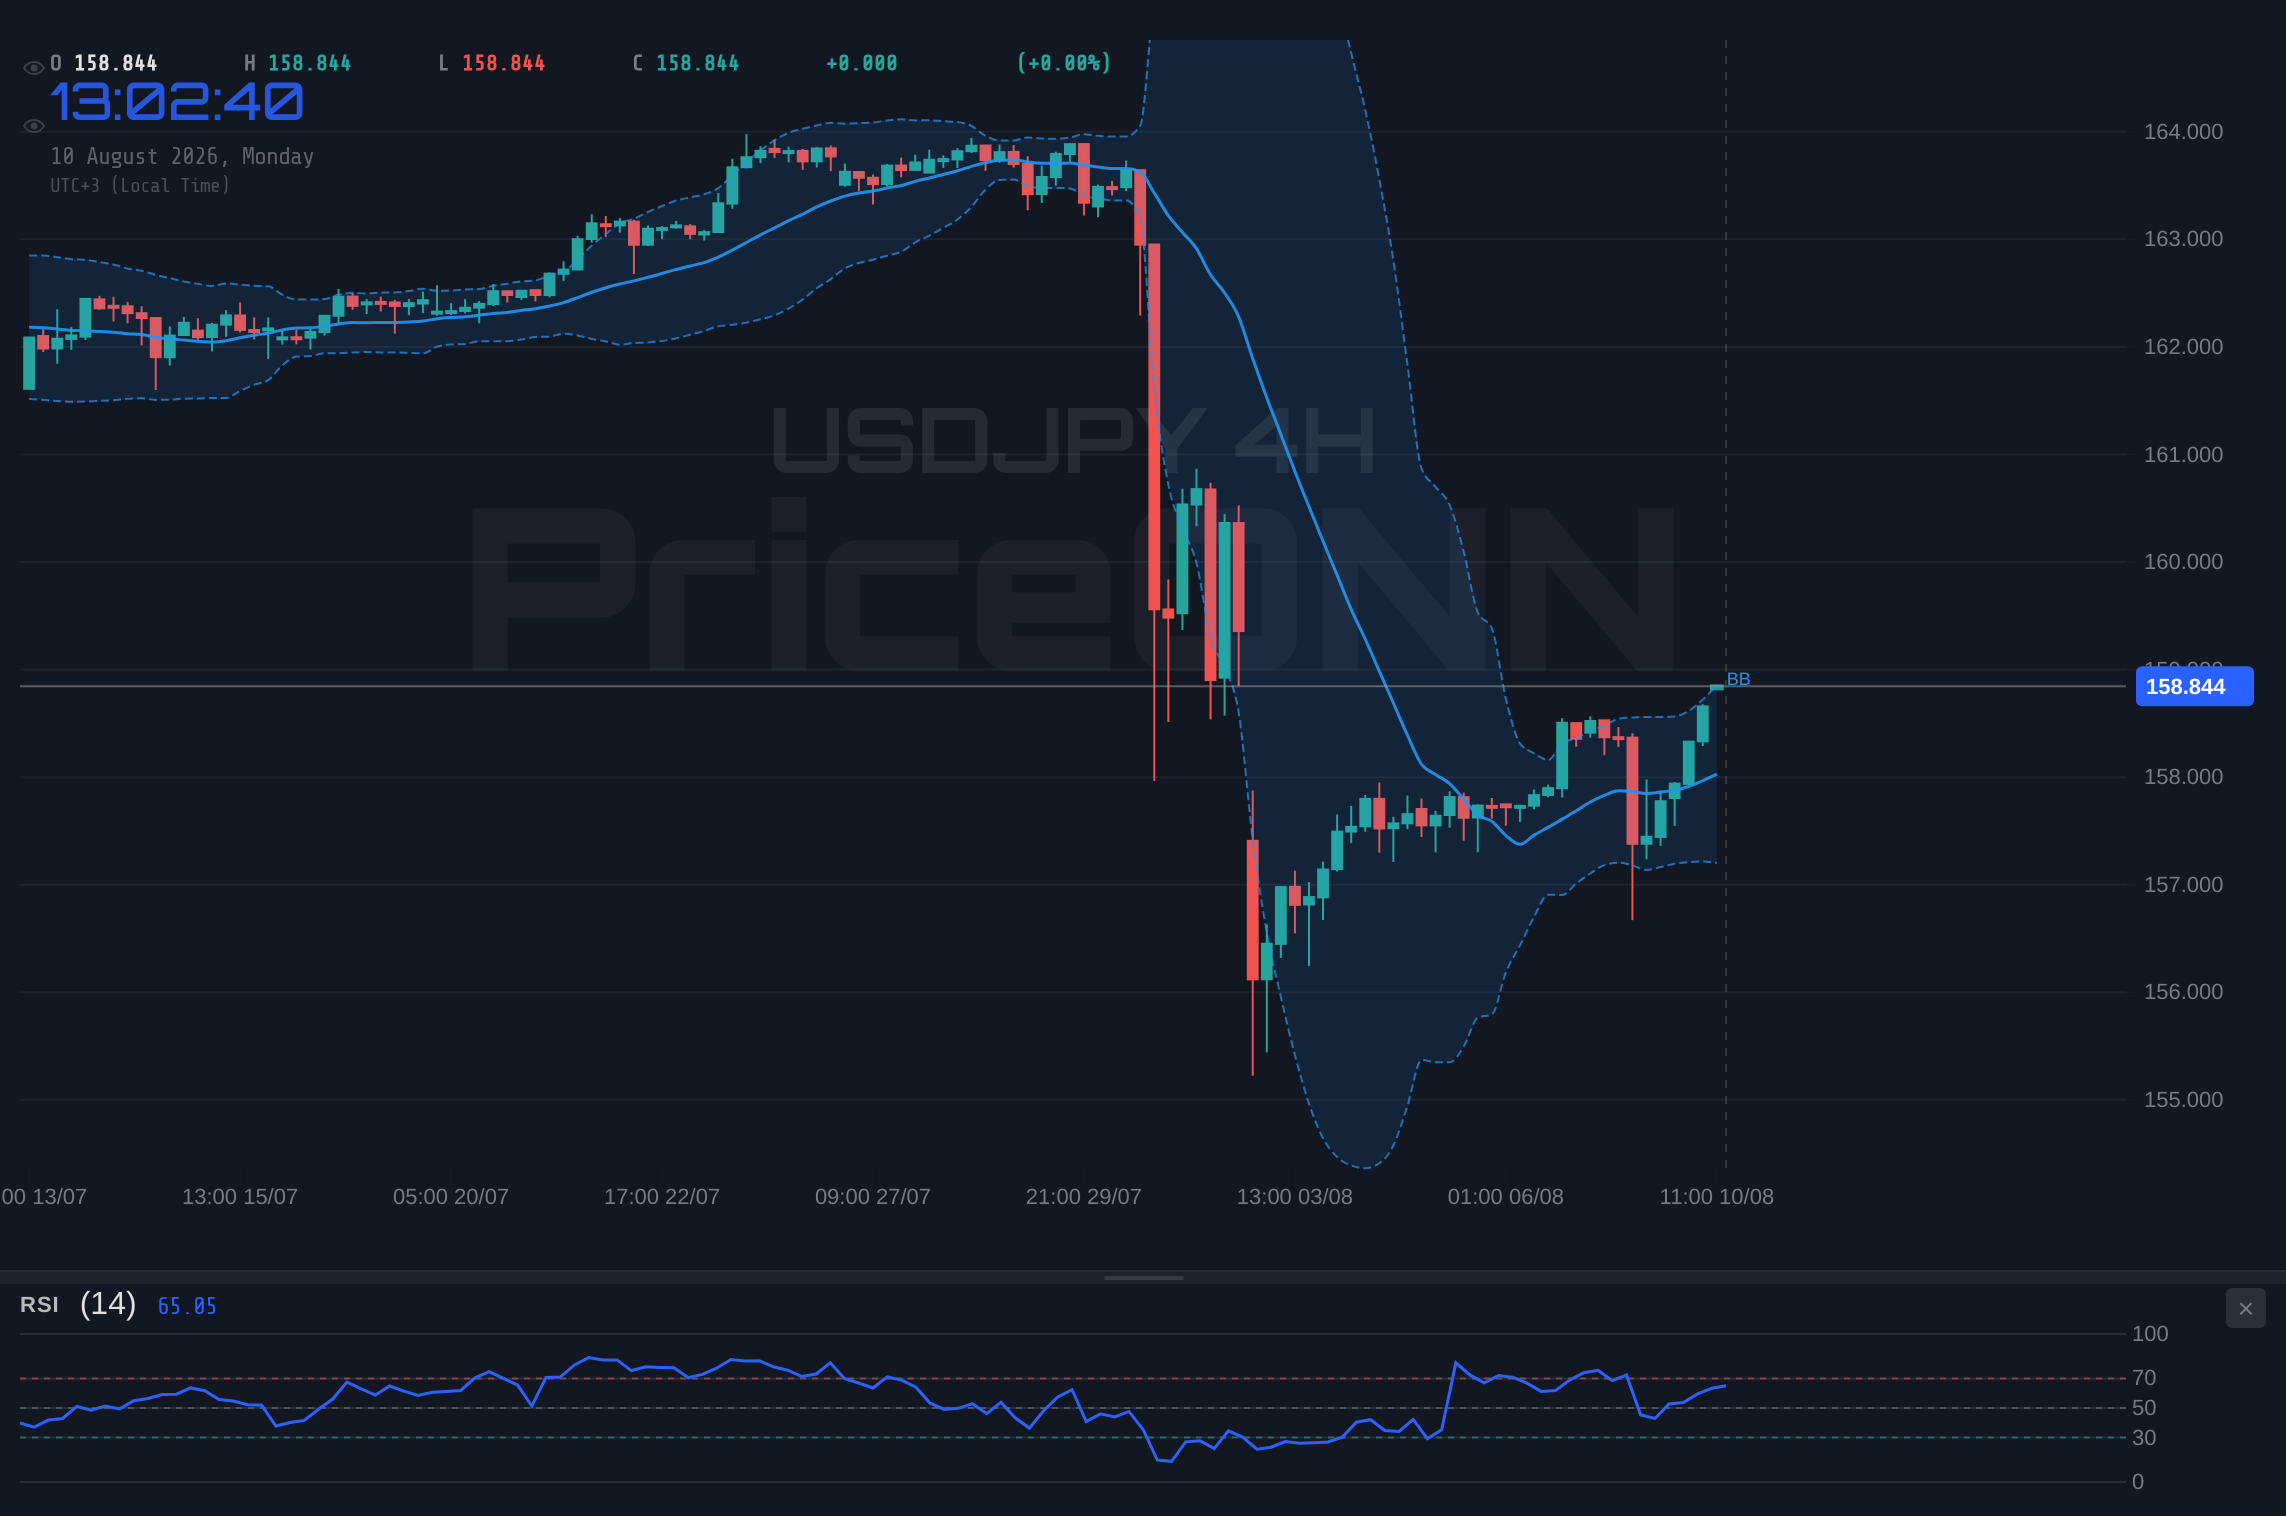
Moving to the 4-hour timeframe, the picture becomes slightly more constructive for the bulls in the immediate sense, but the underlying risks remain. The RSI(14) is at 57.26, still within neutral territory and suggesting room for further upward movement, though not aggressively so. The MACD here is also positive, continuing the bullish momentum seen on the hourly chart. The Stochastic K value at 84.85 and D value at 62.66 indicate that the pair is entering overbought territory, but %K is still above %D, suggesting the upward move might have a little more gas in the tank before a potential pullback. The ADX at 37.36 on this timeframe confirms a strong trend is in place, but again, the direction isn't solely dictated by ADX. It's the confluence of these indicators, coupled with the price action around the $158.86 resistance, that demands careful interpretation. A failure to decisively break above this level could quickly see these shorter-term bullish signals invalidated.
Now, let's talk about the daily chart, where the real battle for the trend seems to be unfolding. The RSI(14) at 39.89 is far from overbought; in fact, it suggests there's still significant room for the price to fall before hitting oversold conditions. This is a critical point that often gets overlooked when focusing solely on shorter-term charts. The MACD on the daily chart is showing negative momentum, with the histogram below the signal line, reinforcing the bearish undertone. The Stochastic here is also in the oversold region, with %K at 35.69 and %D at 26.23, which, while often seen as a bullish reversal signal, on this daily timeframe, simply highlights the extent of the recent bearish pressure. The ADX at 37.26 is a strong signal of a defined trend, but given the other indicators, it suggests the *existing* trend is strong, which, in this case, is a downtrend. This stark contrast between the hourly and daily indicators highlights the key conflict: is this a short-covering rally within a larger downtrend, or is the market poised for a significant trend reversal?
The recent news flow adds another layer of complexity to the USDJPY narrative. Reports suggest that intervention talk is heating up, a sentiment echoed by ForexLive and other financial news outlets. When authorities, particularly from Japan's Ministry of Finance or the Bank of Japan, signal concerns about excessive currency movements, it often translates into direct market action or verbal intervention. Such chatter can be enough to spook traders and trigger a sell-off, even if the underlying technicals suggest otherwise. This is especially true when the pair is approaching significant resistance levels like $158.86. Furthermore, the weak NFP report from August 7th has flipped Fed rate cut expectations, suggesting a potential pause or even a pivot in monetary policy, which could theoretically weaken the dollar. However, the market's reaction has been nuanced, with Brent crude prices remaining above $80, keeping inflation concerns alive and complicating the Fed's path forward. This tug-of-war between weak employment data and sticky inflation creates a volatile environment where intervention fears can easily gain traction.
The correlation with the DXY (Dollar Index) is also a crucial piece of the puzzle. The DXY is currently showing strength, trading around 99.72, which typically puts downward pressure on pairs like USDJPY. The fact that USDJPY is showing resilience, or even attempting to push higher despite dollar strength, is a testament to the unique factors at play, such as the interest rate differential between the US and Japan and the ongoing intervention speculation. The daily chart for DXY shows a downtrend with an ADX of 28.34, but the price is currently hovering around its mid-Bollinger band, indicating a potential for a reversal or a period of consolidation. If the DXY were to break higher from here, it would add significant headwinds to any bullish USDJPY aspirations. Conversely, a weakening DXY could provide the catalyst for USDJPY to break through its current resistance, but only if intervention fears subside.
Considering the interplay of these factors - the technical resistance at $158.86, the conflicting signals across different timeframes, the whispers of intervention, and the broader macroeconomic backdrop - a clear trade plan requires careful consideration of risk management. The strong ADX readings on the daily and 4-hour charts suggest that a trend is indeed in play, but the direction is ambiguous due to the conflicting RSI and MACD signals. This suggests we might be in a period of consolidation or a potential trend exhaustion rather than a clear continuation setup. The market is essentially caught between the possibility of further upside driven by carry trades and yield differentials, and the threat of intervention or a broader market risk-off sentiment that could quickly reverse the gains.
For traders looking to position themselves, the $158.86 resistance level is the immediate focal point. A decisive break and hold above this level, especially on increased volume and with positive follow-through on shorter timeframes, could signal a continuation of the bullish momentum. However, given the daily chart's bearish undertones and the intervention chatter, such a breakout would need to be treated with caution. Confirmation would likely require not only a break of resistance but also a shift in the daily indicators, perhaps a rising RSI and a bullish MACD crossover on the daily chart. Until then, the risk of a sharp reversal or consolidation remains elevated. The market is grappling with whether the fundamental drivers supporting a stronger yen (or a weaker dollar) are strong enough to overcome the current technical momentum and the ever-present threat of official action.
Let's delve into the scenario analysis. The prevailing sentiment among technical indicators, particularly on shorter timeframes, suggests a potential for further upside, but the daily chart and intervention talks cast a long shadow of doubt. This creates a situation ripe for consolidation or a sharp reversal if key levels fail. The ADX readings across timeframes are notable; while the 1-hour and 4-hour charts show strong trends (24.95 and 37.36 respectively), the daily ADX at 37.26 points to a strong downtrend. This is a significant divergence. If the strong daily downtrend ADX prevails, any rallies towards $158.86 might be met with significant selling pressure. Conversely, if the shorter-term bullish signals and the carry trade dynamics win out, we could see a push towards higher resistance levels, but the threat of intervention would loom large.
The core tension for USDJPY revolves around the Bank of Japan's tolerance for yen weakness versus the market's appetite for yield differentials. Historically, Japanese authorities have intervened to prevent excessive yen depreciation, and the current levels may be testing their patience. The CME FedWatch tool, while not provided here, would typically show expectations for the Federal Reserve's next move. A weaker NFP report generally increases the probability of a Fed pause or cut, which could weaken the dollar. However, if inflation remains sticky, as suggested by Brent crude prices above $80, the Fed might maintain a hawkish stance, supporting the dollar. This complex interplay is what makes USDJPY so dynamic right now.
The price action around $158.86 is critical. A failure to break decisively above this level could lead to a retracement, potentially testing the support levels identified at $158.498, $158.339, and $158.249 on the 1-hour chart. If these supports give way, we could see a more significant move lower, targeting the 4-hour support levels around $158.057. On the other hand, a strong breakout above $158.86, confirmed by daily indicators and sustained volume, could open the door for further upside, with the next key resistance levels appearing at $158.747, $158.837, and potentially pushing towards $158.996. However, any move higher would be under the constant threat of verbal or actual intervention, making such a scenario risky without clear confirmation of underlying strength.
The market sentiment is currently quite divided. While some technical indicators on shorter timeframes suggest bullish continuation, the longer-term daily indicators, coupled with the persistent chatter about intervention, create a significant degree of uncertainty. This suggests that volatility is likely to remain elevated, and traders should exercise extreme caution. The key takeaway is that while the pair has shown remarkable strength, the resistance at $158.86, combined with the potential for official action, presents a formidable barrier. Patience and a disciplined approach to risk management will be paramount in navigating this volatile environment. Watching how price reacts to $158.86 and the subsequent follow-through will be crucial in determining the next significant move.
Bearish Scenario: Intervention Fears Mount
65% ProbabilityNeutral Scenario: Consolidation Around Resistance
25% ProbabilityBullish Scenario: Breakout Above Resistance
10% ProbabilityFrequently Asked Questions: USDJPY Analysis
What happens if USDJPY breaks above $158.86 resistance amidst intervention talk?
A decisive break above $158.86, especially with positive daily indicator confirmation and sustained volume, could target higher resistance levels like $159.567. However, the threat of intervention would remain, making such a move volatile and potentially short-lived without clear fundamental support.
Should I trade USDJPY at current levels of $158.86 given the mixed technical signals?
Given the conflicting signals between shorter-term bullish indicators (RSI 70.83 on 1H) and longer-term bearish ones (RSI 39.89 on 1D), caution is advised. A high-probability setup would require clearer confirmation, such as a break above $158.86 with daily indicator alignment, or a clear breakdown below $158.498 support, with a 65% probability favoring a bearish scenario currently.
Is the RSI at 39.89 on the daily chart a sell signal for USDJPY?
An RSI of 39.89 on the daily chart suggests that USDJPY is not overbought and has room for further downside potential. While shorter-term charts might show temporary bullishness, this daily reading indicates that the larger trend might still be bearish, reinforcing the need to watch for potential reversals or consolidations near resistance.
How might intervention fears affect USDJPY's movement this week, given the current price around $158.86?
Intervention fears can significantly increase volatility and lead to sharp reversals, especially near key resistance levels like $158.86. If authorities signal concerns, it could trigger a sell-off, invalidating shorter-term bullish setups and potentially pushing USDJPY towards support levels like $158.498, even if underlying economic data might otherwise support a stronger dollar.
Track markets in real-time
AI-powered analysis, technical indicators and real-time price data.
Join Our Telegram Channel
Breaking market news, AI analysis and trading signals instantly.
Join Channel