

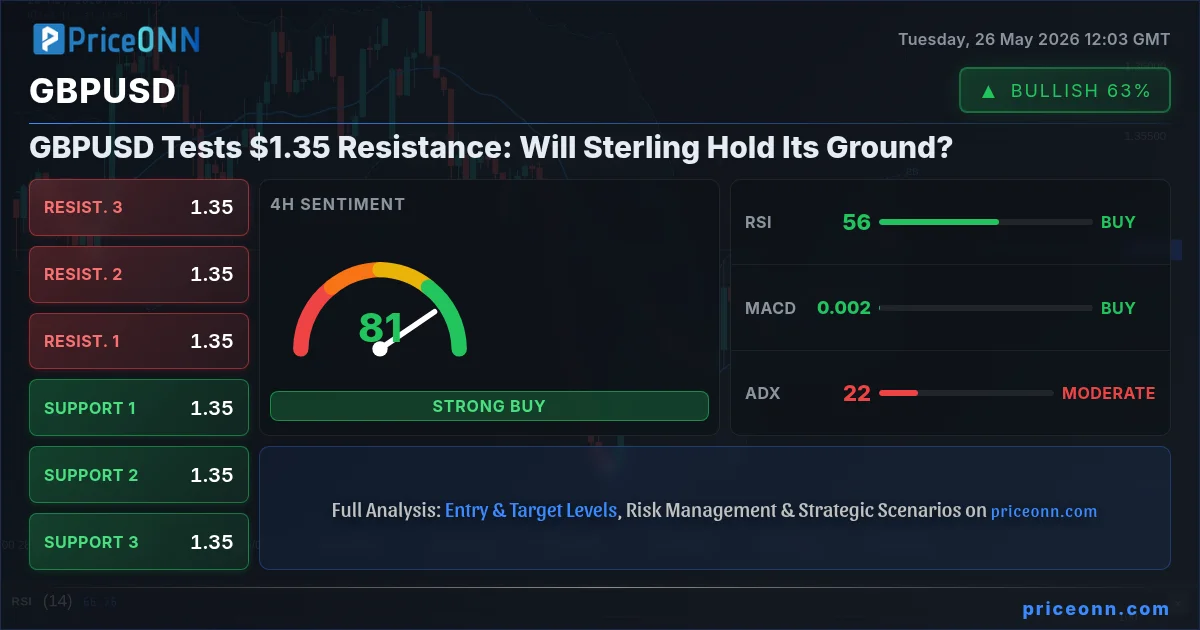
The narrative surrounding GBPUSD is at a critical juncture, with the pair currently hovering around the $1.35 mark. This level isn't just a round number; it represents a significant technical hurdle that has historically dictated short-term price action. As traders eye this pivotal resistance, the market is grappling with a confluence of factors, from the weakening US Dollar to the subtle shifts in global risk sentiment. The recent rejection near the 200-day moving average at $1.3520, as reported by forex news outlets, underscores the significance of the current price action. This article delves into the intricate technical tapestry of GBPUSD, dissecting indicator signals, historical price patterns, and the broader macro environment to paint a comprehensive picture of what lies ahead.
- GBPUSD is testing critical resistance at $1.35, a level that has shown historical significance.
- The RSI at 67.3 suggests building overbought pressure, while the ADX at 21.66 indicates a moderate trend, leaving room for volatility.
- Support is identified at $1.34747 (S1), $1.34697 (S2), and $1.34601 (S3), with resistance seen at $1.34893 (R1), $1.34989 (R2), and $1.35039 (R3).
- The DXY is currently at 98.83, showing a weakening trend which could offer some support to GBPUSD, but the overall trend is cautious.
The past few days have seen GBPUSD exhibit a notable upward bias, carving out a bullish rising channel on the 4-hour chart. This momentum has propelled the pair towards the significant resistance zone near $1.35. However, the technical indicators present a nuanced picture, suggesting that the path higher might not be straightforward. The Relative Strength Index (RSI), a key momentum oscillator, is currently reading 67.36 on the 1-hour chart and 56.36 on the 4-hour chart. While these levels are not yet in extreme overbought territory, they indicate that the bullish momentum is maturing. A reading above 70 typically signals overbought conditions, potentially leading to profit-taking or a reversal. The current levels suggest caution is warranted; bulls are certainly in control of the immediate intraday trend, but the price is approaching levels where sellers have historically stepped in.
Delving deeper into the 1-hour timeframe, the Moving Average Convergence Divergence (MACD) histogram is showing negative momentum, with the MACD line sitting below its signal line. This divergence between the upward price action and the negative MACD momentum is a classic sign of waning strength. Furthermore, the Stochastic Oscillator on the 1-hour chart, while showing a bullish crossover (%K at 50.82, %D at 31.46), is approaching the overbought threshold. This suggests that any further upward movement might be met with increased selling pressure. The Average Directional Index (ADX) at 23.55 on the 1-hour chart indicates a moderately trending market, but the directionality is not yet strongly defined, leaving room for potential whipsaws.
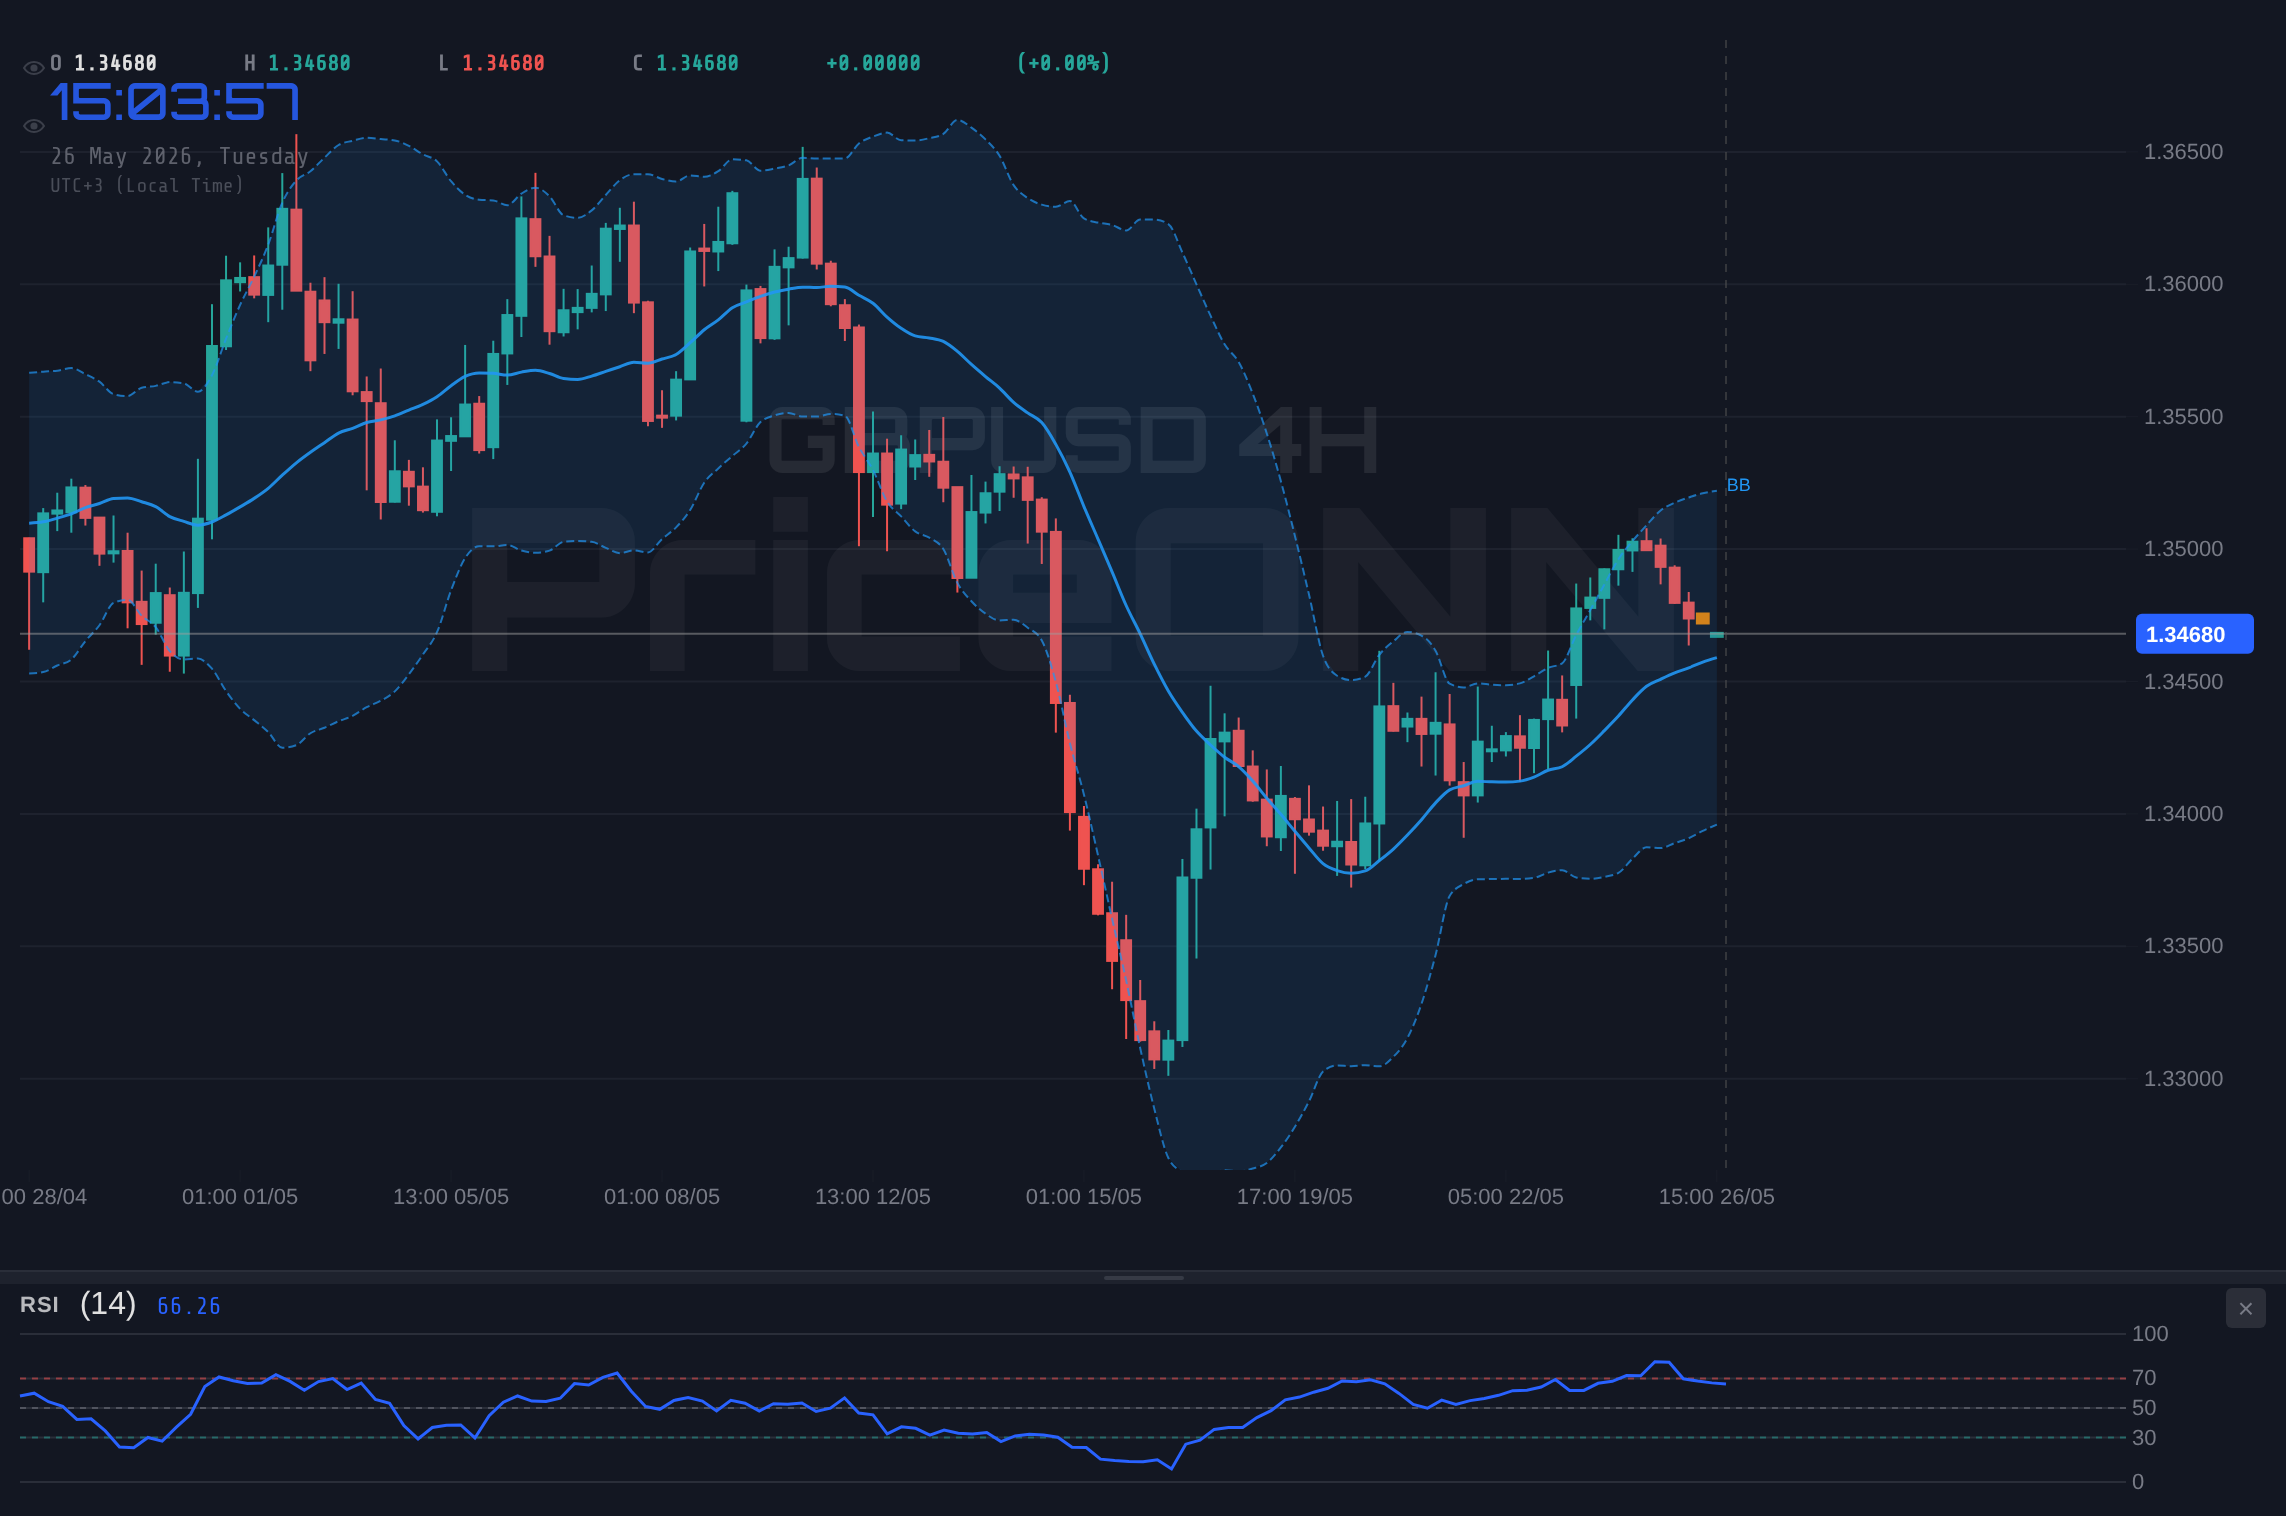
On the 4-hour chart, the picture becomes slightly more constructive for the bulls, at least in the short term. The MACD histogram here displays positive momentum, with the MACD line above its signal line, aligning with the recent upward price movement. The Stochastic Oscillator on this timeframe, however, paints a different story. With %K at 66.65 and %D at 87.11, it signals a bearish divergence, suggesting that the upward momentum might be losing steam and a potential pullback is on the horizon. This conflict between the MACD and Stochastic on the 4-hour chart highlights the indecision in the market. The Bollinger Bands on both the 1-hour and 4-hour charts are also showing signs of tightening, which often precedes a period of increased volatility or a significant price breakout. The current price is trading below the middle band on the 4-hour chart, indicating a bearish lean despite the positive MACD reading.
The daily chart presents a more consolidated view, with the trend currently neutral, though the power percentage is at 50%. The RSI(14) is sitting at 52.19, a level that historically offers little directional conviction. It's neither overbought nor oversold, suggesting a market in balance. The MACD on the daily chart is also showing negative momentum, with the MACD line below its signal line, reinforcing the idea that the broader uptrend might be facing headwinds. The Stochastic Oscillator, with %K at 52.91 and %D at 32.1, provides a bullish signal, indicating potential for upward movement from current levels. However, the ADX at 14.25 on the daily timeframe points to a very weak trend, suggesting that any moves might be short-lived and prone to reversals. This lack of a strong daily trend means that shorter-term signals will likely dominate market sentiment.
Correlating GBPUSD's movements with the US Dollar Index (DXY) offers crucial context. The DXY is currently trading at 98.83, showing a slight daily decline of 0.19%. This weakening dollar environment typically provides a tailwind for currency pairs like GBPUSD, as a weaker dollar makes the British Pound relatively more attractive. On the 1-hour chart, the DXY shows a neutral trend with some upward momentum in its MACD, but its Stochastic is giving a sell signal. The daily chart for the DXY, however, shows a neutral trend with positive MACD momentum, but a bearish Stochastic signal. This mixed picture from the DXY suggests that while there might be some underlying dollar weakness, it's not a definitive driver for a strong GBPUSD rally just yet. The correlation is there, but the dollar's own internal technicals are not providing a clear, strong directional bias.
The recent news cycle also provides valuable insights. A report from Forex News indicated that GBP/USD faced a sharp rejection near the 200-day moving average at $1.3520, signaling waning bullish momentum. This aligns perfectly with our technical observations of resistance around the $1.35 level. Another report mentioned that the Euro is facing significant pressure against both the British Franc and the Swiss Franc amid economic woes, suggesting a potential strengthening of Sterling relative to other major currencies. While this is not a direct driver for GBPUSD, it highlights a broader trend of currency strength that could influence the pair. The lack of strong fundamental news directly impacting the UK economy, coupled with the US Dollar's moderate weakness, places the technicals firmly in the driver's seat for the immediate future.
Bearish Scenario: Approaching Resistance
65% ProbabilityBullish Scenario: Breaking the Ceiling
25% ProbabilityNeutral Scenario: Consolidation at Resistance
10% ProbabilityFrequently Asked Questions: GBPUSD Analysis
What happens if GBPUSD breaks above $1.35039 resistance?
A decisive close above $1.35039 on the 4-hour chart, especially with increased volume, would invalidate the bearish outlook and target $1.3520. This bullish scenario suggests potential further upside towards $1.3570, though it carries only a 25% probability based on current technicals.
Should I trade GBPUSD at current levels of $1.35 given the RSI at 67?
Trading at $1.35 with an RSI of 67 warrants caution. While not extremely overbought, it signals momentum is building. A high-probability bearish scenario (65%) suggests a potential move lower if price breaks below $1.34601, targeting $1.34247. Risk management is paramount.
Is the ADX at 21.66 a sell signal for GBPUSD right now?
An ADX reading of 21.66 on the 1-hour chart indicates a moderately trending market, but not a strong directional conviction. It doesn't inherently signal a sell. Instead, it suggests that the current trend, whatever its direction, has some strength but could be vulnerable. Confirmation from other indicators is crucial.
How will the weakening DXY at 98.83 affect GBPUSD this week?
The DXY's current level of 98.83, showing a slight decline, generally provides a supportive backdrop for GBPUSD. However, the DXY's own mixed technical signals suggest this dollar weakness might be temporary. The primary driver for GBPUSD remains its own technical resistance at $1.35, with the DXY acting as a secondary influence.
Technical Outlook Summary
| Indicator | Value | Signal | Interpretation |
|---|---|---|---|
| RSI (14) | 67.36 | Neutral | Approaching overbought, momentum slowing. |
| MACD Histogram | -0.00005 | Bearish | Negative momentum, suggesting waning upside. |
| Stochastic | K:50.82, D:31.46 | Bullish | Bullish crossover, but approaching overbought. |
| ADX | 23.55 | Neutral | Moderate trend strength, lacks clear direction. |
| Bollinger Bands | Middle Band | Bearish | Price below middle band on 4H, indicating caution. |
Track markets in real-time
AI-powered analysis, technical indicators and real-time price data.
Join Our Telegram Channel
Breaking market news, AI analysis and trading signals instantly.
Join Channel