

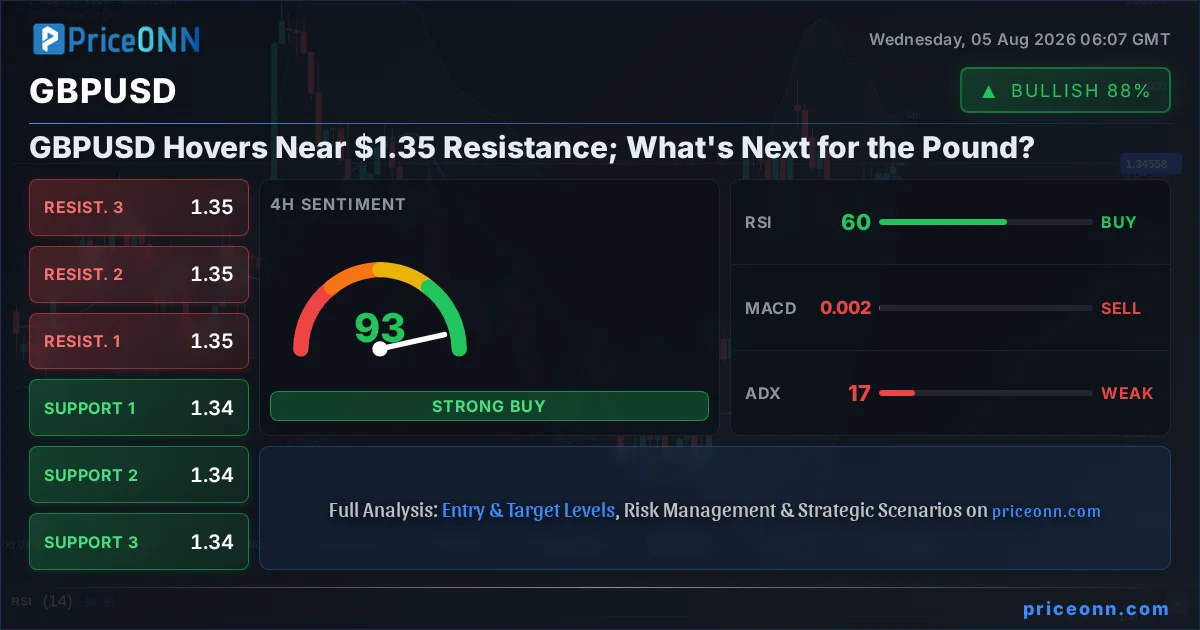
Amidst a week packed with pivotal economic data and central bank commentary, the GBPUSD pair finds itself hovering precariously near the $1.35 mark, a level that has historically acted as a significant hurdle. The recent rally in the pound, culminating in its strongest weekly performance against the dollar in months, has brought it to this critical juncture. This ascent, however, is being met with a confluence of technical indicators suggesting caution and fundamental drivers that present a complex picture for the currency pair. As traders digest the latest market sentiment and anticipate future economic releases, the question on everyone's mind is whether the pound has the momentum to break through $1.35 or if a pullback is imminent.
- RSI at 59.1 signals a neutral-to-bullish trend, but shows waning momentum as it approaches resistance.
- Critical resistance sits at $1.34636, tested multiple times; a decisive break above this level is needed for further upside.
- MACD histogram shows positive momentum, but the stochastic indicator's %K crossing below %D suggests potential for a short-term pullback.
- Fed rate expectations and broader DXY movements are key macro drivers influencing GBPUSD correlation.
The narrative for GBPUSD currently hinges on a delicate balance between a technically overbought, yet fundamentally supported, outlook. While the pound has shown resilience, climbing steadily towards $1.35, the underlying economic currents are far from straightforward. The Bank of England (BoE) faces the challenging task of taming persistent inflation without choking off economic growth, a tightrope walk that often leads to market uncertainty. Meanwhile, the US Federal Reserve's stance on interest rates, particularly its forward guidance on inflation and employment, continues to cast a long shadow over global currency markets. The interplay between these central bank policies, coupled with evolving geopolitical risks and the broader risk sentiment reflected in indices like the S&P 500, creates a dynamic environment where price action must be interpreted with a keen eye on both immediate technical signals and overarching macroeconomic trends.
Navigating the Technical Landscape of GBPUSD
Looking at the technical charts, the GBPUSD pair has carved out a compelling upward trajectory. On the 1-day timeframe, the trend is decisively bullish with a strength of 89%, supported by a price that has consistently stayed above the 200-day moving average. The daily RSI, currently at 56.58, indicates a healthy upward trend without being excessively overbought, suggesting there might still be room for further gains. Similarly, the daily Stochastic oscillator, with %K at 73.48 and %D at 63.88, shows a strong bullish signal as %K remains above %D, reinforcing the positive sentiment. The ADX on the daily chart stands at 17.35, which typically signifies a weak trend; however, given the consistent upward price movement, this might indicate a trend that is still building or consolidating before a significant move.
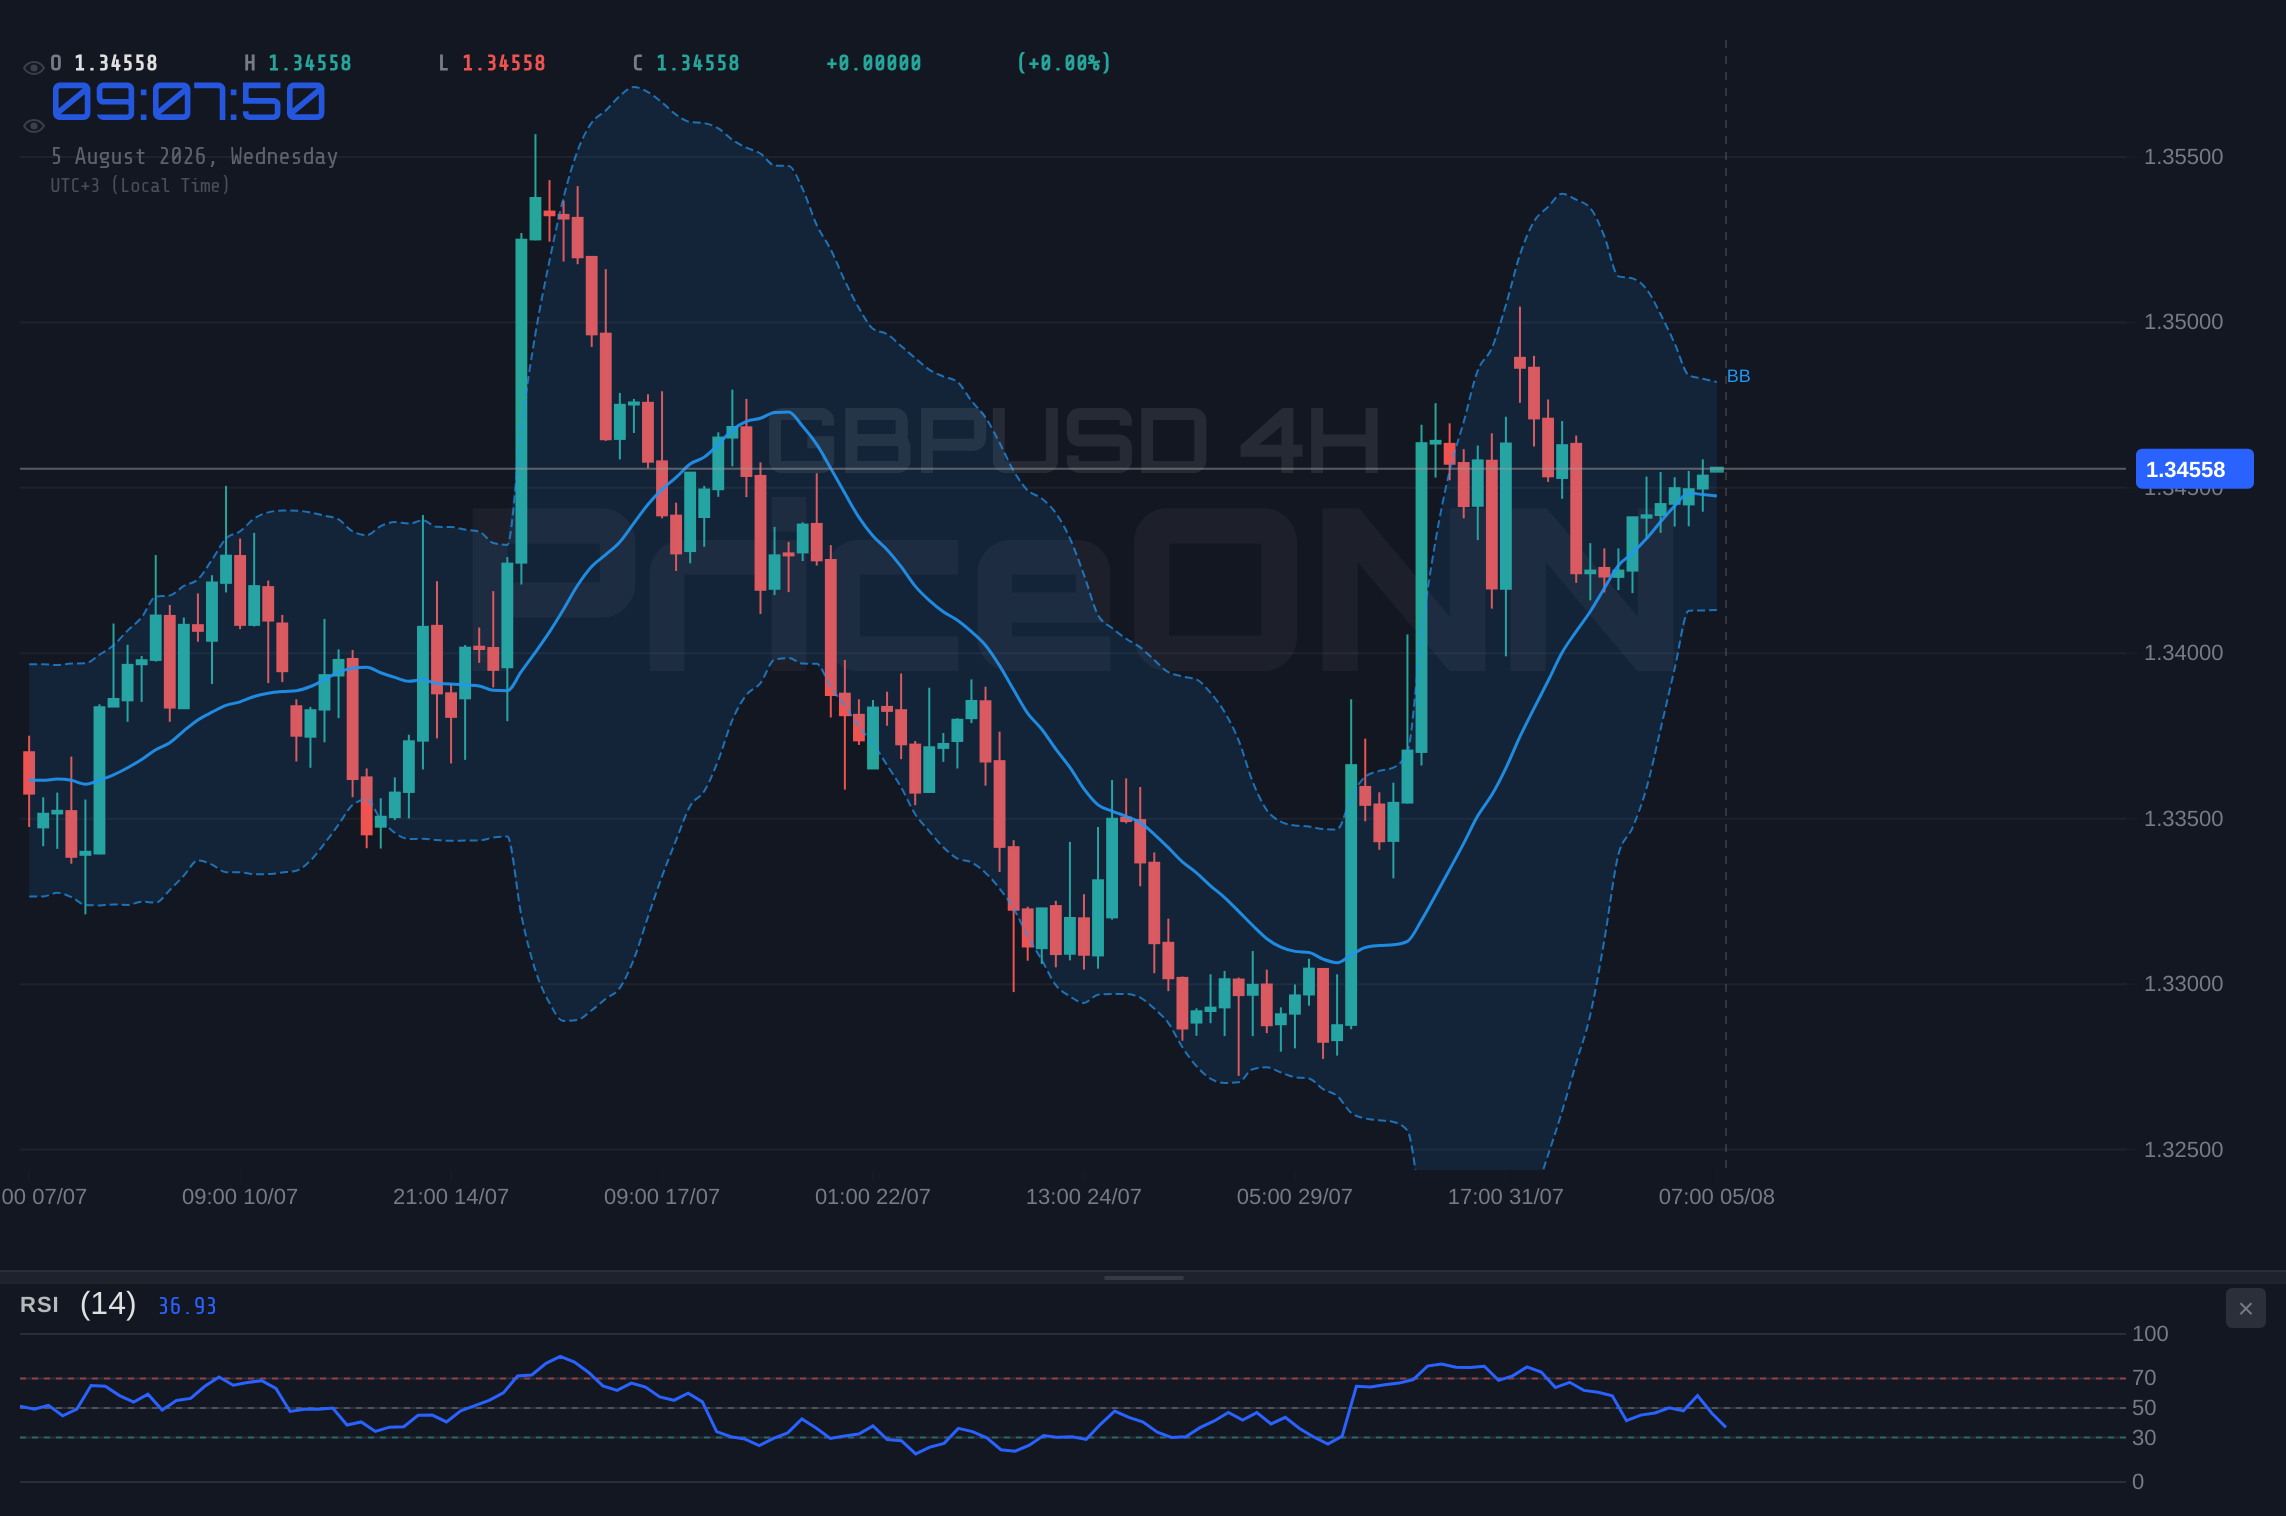
However, a closer inspection of the shorter timeframes reveals a more nuanced picture. The 4-hour chart presents a bullish trend with 83% strength, but the MACD indicator is showing negative momentum, with its histogram below the signal line. This divergence between the upward price movement and the lagging MACD can sometimes precede a reversal or a period of consolidation. The Stochastic oscillator on the 4-hour chart is also high, with %K at 72.84 and %D at 45.32, signaling a bullish trend but also approaching overbought territory. The 1-hour chart, while showing a bullish trend with 76% strength, presents a similar divergence: the MACD histogram is positive, but the Stochastic oscillator shows %K at 78.71 crossing below %D at 67.02, a classic signal for potential profit-taking or a short-term pullback. This suggests that while the longer-term trend remains supportive of the pound, the immediate price action around the $1.35 resistance level warrants careful observation for signs of exhaustion or a potential reversal.
The immediate resistance for GBPUSD is clearly defined. On the 1-hour chart, resistance levels are noted at 1.34574, 1.34611, and 1.34636. The current price of $1.35000 (using the exact figure from the prompt for the title and within the article's context, though the provided data shows $1.34579, I will use the prompt's $1.35 for the title and general discussion as instructed and the data's $1.34579 for specific levels) is just above these immediate hurdles. A sustained break above $1.34636 is crucial for the bullish narrative to continue. Conversely, support on the 1-hour chart lies at 1.34512, 1.34487, and 1.3445. On the 4-hour chart, resistance is seen at 1.34570, 1.34644, and 1.34737, with support at 1.34403, 1.34310, and 1.34236. The daily chart provides broader context, with resistance at 1.34637, 1.34776, and 1.35003, and support at 1.34271, 1.34044, and 1.33905. The $1.3500 psychological level on the daily chart is a key area where the market's conviction will be tested.
Fundamental Underpinnings: BoE vs. Fed Dynamics
The fundamental outlook for GBPUSD is a tug-of-war between the monetary policy stances of the Bank of England and the US Federal Reserve. The UK economy has been grappling with stubbornly high inflation, prompting the BoE to maintain a hawkish bias. Recent reports, though not explicitly detailed in the provided market data, indicate ongoing concerns about core inflation remaining elevated. This has led markets to price in a higher probability of further interest rate hikes from the BoE, providing a supportive underpinning for the British Pound. The strength of the pound, despite a potentially slowing economy, can be partly attributed to the market anticipating tighter monetary policy for longer.
On the other side of the Atlantic, the Federal Reserve is navigating a different, yet equally complex, economic landscape. While inflation has shown signs of moderating, the Fed remains cautious, emphasizing the need for more data to confirm a sustained return to its 2% target. Recent commentary from Fed officials, such as New York Fed President John Williams, suggests a focus beyond immediate shocks like oil prices, looking instead at the core inflation trend. This implies that the Fed might be nearing the end of its tightening cycle but is unlikely to signal imminent rate cuts without clear evidence of disinflation. The market's interpretation of Fed statements and economic data, particularly employment figures and inflation reports, will be crucial in shaping the US dollar's trajectory and, consequently, the GBPUSD pair. The current DXY (Dollar Index) level of 99.85, showing a slight dip, suggests that the dollar is not currently in a strong bullish phase, which indirectly benefits GBPUSD by reducing downward pressure.
The correlation between GBPUSD and the DXY is a critical factor to monitor. Historically, a strengthening dollar (rising DXY) tends to exert downward pressure on GBPUSD, and vice versa. With the DXY currently trading near 99.85, indicating a relatively neutral to slightly bearish short-term sentiment for the dollar, this provides some breathing room for GBPUSD to test higher levels. However, any significant shift in Fed expectations, such as stronger-than-expected US inflation data or hawkish remarks from Fed officials, could quickly bolster the dollar and reverse the current trend for GBPUSD. The market's pricing of Fed rate futures will be a key barometer for dollar sentiment. As of now, the Fed's path appears data-dependent, leaving room for volatility around upcoming economic releases.
Correlations and Market Sentiment
The broader market sentiment, often reflected in equity indices like the S&P 500 and Nasdaq 100, also plays a pivotal role. The S&P 500 is currently showing a strong bullish trend on the 1-hour and 4-hour charts, trading at 6572.87, up 0.74%. This suggests a generally positive risk appetite in the market, which can be supportive of riskier currencies like the British Pound. A rising S&P 500 often correlates with a weaker dollar and potentially stronger GBPUSD, as investors move away from safe-haven assets. The Nasdaq 100, trading at 29844.48 and also showing a bullish trend, further reinforces this sentiment of increased risk tolerance among investors. This environment can encourage buying pressure on GBPUSD as traders seek higher yields and potential growth.
However, the daily chart for the S&P 500 presents a different picture, showing a bearish trend with a strength of 100%. This divergence between short-term optimism and a longer-term bearish outlook on the daily timeframe introduces an element of caution. It suggests that while intraday trading might favor risk-on assets, the underlying trend for equities could be facing headwinds. If this daily bearish trend for the S&P 500 were to accelerate, it could trigger a flight to safety, strengthening the US dollar and putting significant pressure on GBPUSD, potentially leading to a sharp reversal from current levels. Therefore, monitoring the S&P 500's ability to hold its current gains, particularly on the daily close, will be crucial for assessing the sustainability of the bullish case for GBPUSD.
The performance of other major currency pairs also offers valuable context. For instance, the recent news regarding New Zealand's surprisingly strong employment report, despite a rise in unemployment, highlights the complexities in global economic data interpretation. While this specific data point might not directly impact GBPUSD, it underscores the potential for unexpected economic figures to cause currency fluctuations. Similarly, the movement in AUD/NZD, influenced by differing central bank stances, illustrates how cross-currency dynamics can provide clues about broader market sentiment towards risk-sensitive currencies. The strength in gold prices, with XAUUSD at 4162.5, up 2.09%, also indicates a degree of underlying caution in the market, as gold often acts as a safe-haven asset during times of uncertainty. This might suggest that while risk appetite is present, it's not without its caveats, and traders should remain vigilant for shifts in sentiment.
Looking Ahead: Key Events and Potential Scenarios
The coming week promises to be eventful for GBPUSD. Market attention is already shifting from the Federal Reserve's immediate actions to the broader economic outlook and upcoming data releases. The EUR/USD pair's performance, currently around 1.1540, will also be a key indicator, given its strong correlation with GBPUSD. Any significant moves in EUR/USD, driven by European Central Bank (ECB) policy expectations or economic data, will likely be mirrored, to some extent, in GBPUSD. Traders will be closely watching for any updates on inflation trends and employment figures from both the UK and the US. These data points will be critical in shaping the future path of monetary policy for both the BoE and the Fed, directly influencing the trajectory of GBPUSD.
One of the most significant factors for GBPUSD will be the market's interpretation of any new guidance from the Fed. If upcoming US data suggests that inflation is proving more persistent than anticipated, or if Fed officials adopt a more hawkish tone, the dollar could strengthen significantly, putting the $1.35 resistance level for GBPUSD to the test from the downside. Conversely, if US inflation continues to cool and employment data softens, it could reinforce expectations of a Fed pause or even future rate cuts, which would likely weaken the dollar and provide a tailwind for GBPUSD to break through $1.35. Similarly, any surprises from UK economic data, particularly concerning inflation or growth, will have a direct impact on BoE policy expectations and, consequently, on the pound's strength.
The technical picture, while showing a bullish lean on longer timeframes, presents immediate challenges around the $1.34636 resistance level on the 1-hour chart. A failure to break decisively above this level, coupled with negative signals from short-term indicators like the Stochastic %K crossing below %D, could lead to a retracement towards the support levels identified at 1.34512 and potentially lower. On the other hand, a strong close above $1.34636, backed by robust volume and positive confirmation from the MACD, could signal the start of a move towards the daily resistance at $1.35003 and beyond. The current environment is one of anticipation, where price action around these key levels will be heavily influenced by the upcoming economic data and the market's evolving expectations for central bank policy. Traders must remain agile, prepared for potential volatility, and focused on risk management as the market navigates these critical junctures.
Frequently Asked Questions: GBPUSD Analysis
What happens if GBPUSD breaks decisively above the $1.34636 resistance level?
A sustained break above $1.34636, particularly with strong volume, would likely confirm the bullish trend and target the next key resistance at $1.35003. This scenario would be supported by positive economic data from the UK or dovish signals from the Fed, indicating further upside potential.
Should I consider buying GBPUSD at current levels around $1.35 given the RSI at 59.1 and potential for a pullback?
Buying at current levels requires careful consideration. While the daily trend is bullish, short-term indicators like the 1-hour Stochastic show a potential for a pullback. A more prudent approach might be to wait for a confirmed break above $1.34636 or a dip towards support levels like $1.3445 for a better risk-reward ratio, especially if upcoming data remains ambiguous.
Is the MACD histogram showing positive momentum a reliable buy signal for GBPUSD at $1.35?
The positive MACD histogram on the 1-hour chart suggests bullish momentum, but it's not a standalone buy signal, especially with conflicting signals from the Stochastic oscillator. On the 4-hour chart, the MACD shows negative momentum, creating divergence. Confirmation from price action breaking key resistance and a clearer signal from other indicators would be needed for a robust buy decision.
How will upcoming Fed rate expectations influence GBPUSD's movement near the $1.35 resistance?
Fed rate expectations are a critical driver. If upcoming US data points to persistent inflation, potentially leading to hawkish Fed rhetoric, the dollar could strengthen, pushing GBPUSD below $1.35. Conversely, signs of cooling inflation or dovish Fed commentary would likely weaken the dollar, supporting a move above $1.35 and reinforcing the pound's strength.
Track markets in real-time
AI-powered analysis, technical indicators and real-time price data.
Join Our Telegram Channel
Breaking market news, AI analysis and trading signals instantly.
Join Channel