

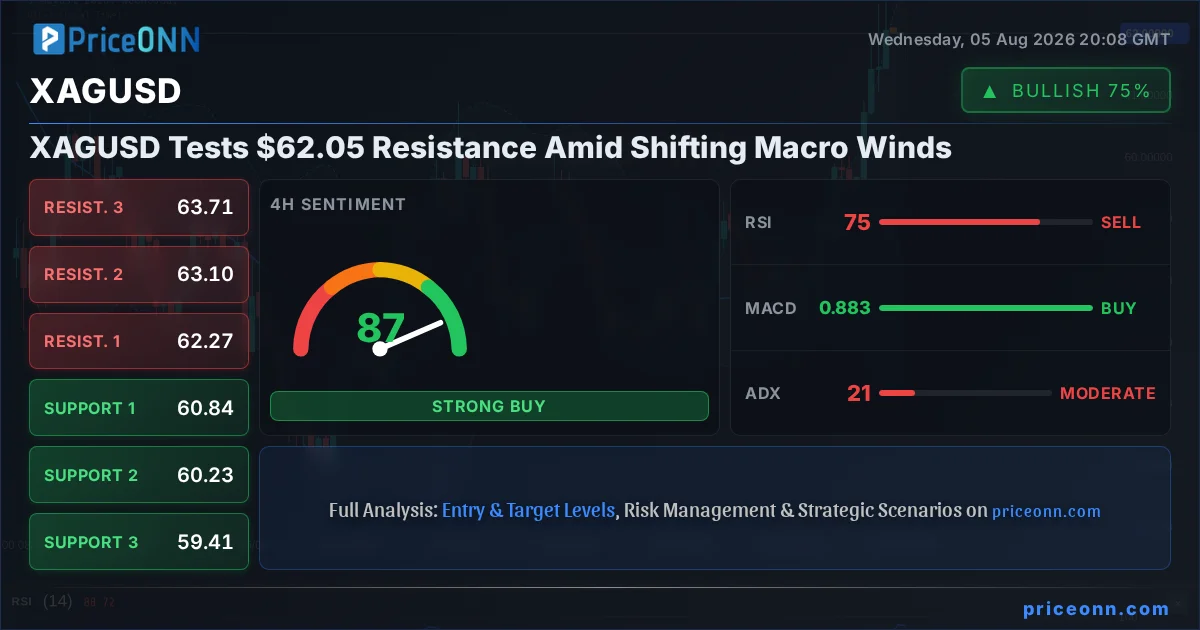
The intricate dance between precious metals and the broader economic landscape has never been more apparent than in the current movements of XAGUSD. As silver hovers around the critical $62.05 mark, a complex interplay of technical signals and fundamental drivers is shaping market sentiment. While the 1-hour and 4-hour charts hint at a strong bullish momentum, the longer-term daily outlook presents a more neutral picture, suggesting that significant price action may hinge on external macroeconomic factors and central bank policy shifts. This analysis delves into the nuances of XAGUSD's current position, exploring the technical underpinnings and the fundamental forces that could dictate its next significant move. We will dissect the indicators, correlate them with global market dynamics, and assess the potential impact of upcoming economic events, painting a comprehensive picture for traders navigating this volatile market.
- Silver's RSI at 64.71 on the 1H chart signals a neutral-to-bullish inclination, with room for further upside before reaching overbought territory.
- The critical resistance level to watch is $62.34, a breach of which could ignite further upward momentum.
- Conversely, immediate support at $62.06 is being tested, and a break below could signal a short-term pullback.
- The US Dollar Index (DXY) is currently trading around 99.72, and its downward trajectory could provide a tailwind for XAGUSD.
The recent performance of XAGUSD, currently trading at $62.05, presents a fascinating case study in market dynamics. On shorter timeframes, the technical indicators paint a decidedly bullish picture. The 1-hour chart showcases a strong upward trend with an ADX reading of 49.14, indicating a robust trending environment. The RSI at 64.71 suggests there's still appetite for buyers to push higher before hitting overbought conditions, and the MACD is showing positive momentum. This confluence of factors on the 1-hour chart points towards continued strength, with immediate resistance identified at $62.34. A decisive break above this level could potentially open the door for further gains, targeting subsequent resistance levels. However, traders must remain vigilant as short-term pullbacks remain a possibility, with support nearby at $62.06.
Shifting to the 4-hour timeframe, the bullish narrative for silver continues, albeit with a few more caveats. The trend remains firmly in the bullish camp, with an ADX of 21.39 suggesting a moderately trending market. The RSI is creeping into overbought territory at 74.84, a level that historically can precede a period of consolidation or a minor pullback as sellers look to capitalize. The Bollinger Bands are also showing the price trading above the upper band, a sign of strong upward momentum but also a potential indicator of an overheated market in the short term. Stochastic indicators are also in the overbought zone, reinforcing the notion that upward momentum might be losing steam. Despite these short-term overbought signals, the overall trend bias remains bullish, with key support found at $60.84 and resistance at $62.27. This suggests that while immediate gains might be capped, the underlying trend is still upward.
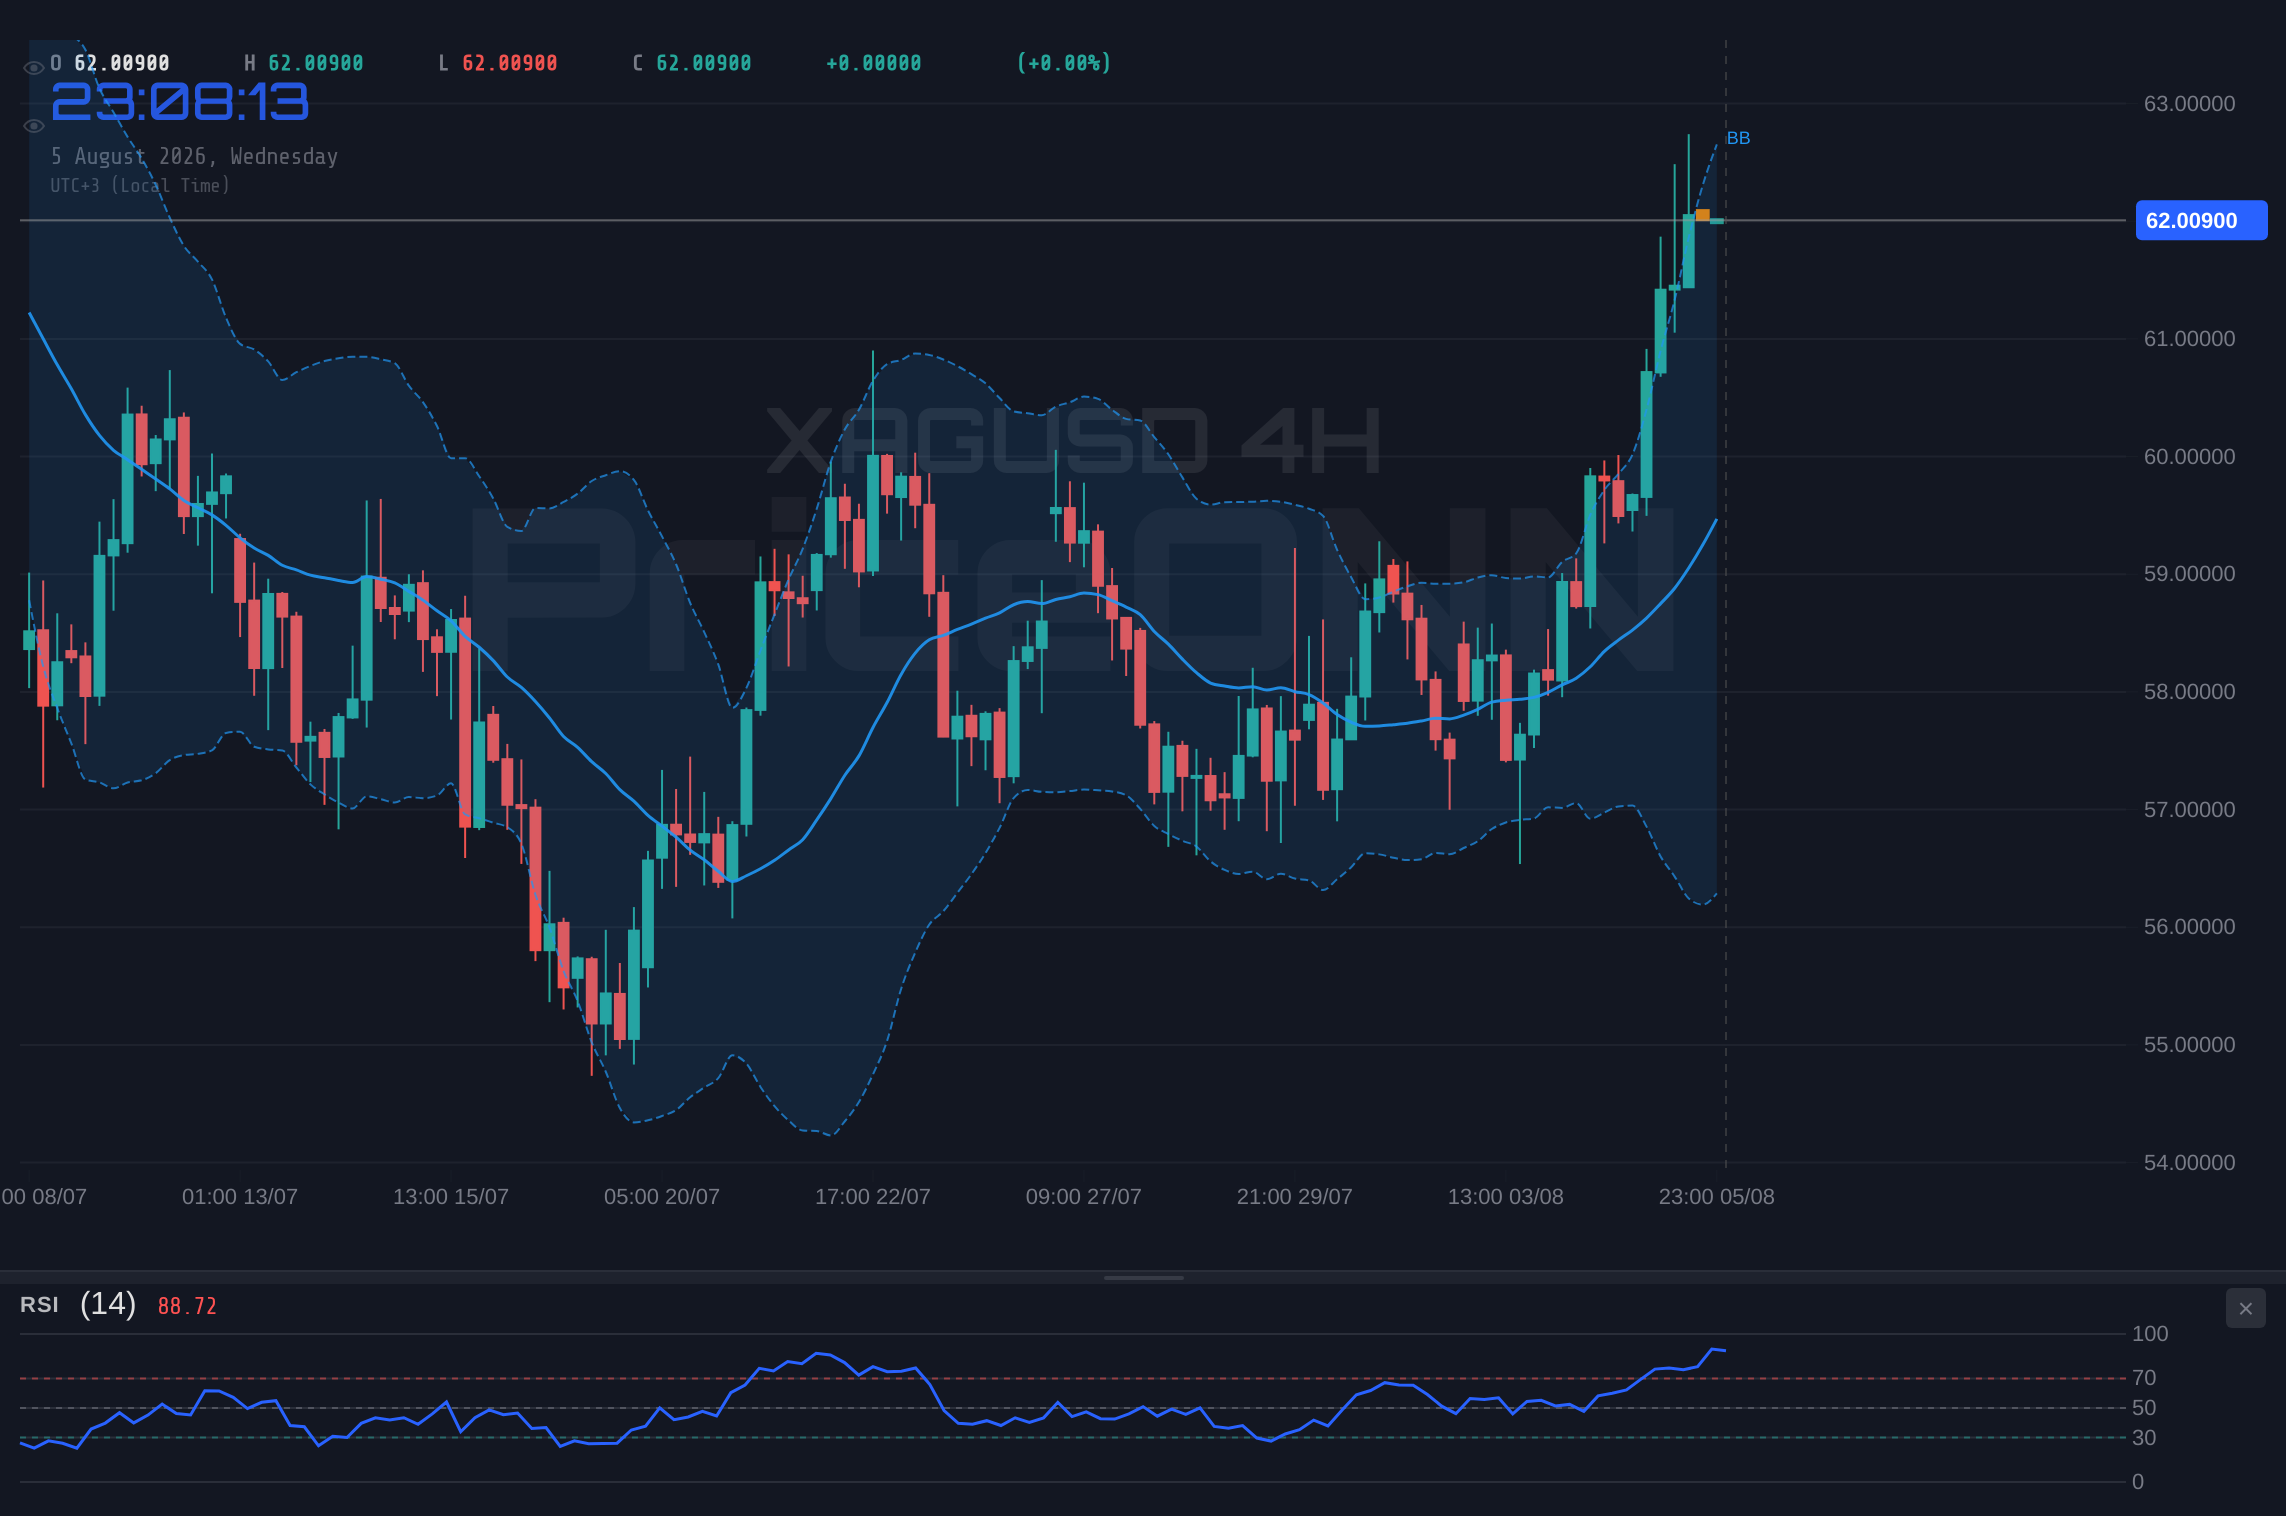
The daily chart, however, introduces a layer of complexity, painting a neutral trend with a strength of 50%. This divergence between the shorter timeframes and the daily outlook is crucial for understanding the larger market sentiment. While the 1-hour and 4-hour charts are driven by immediate buying pressure, the daily view suggests that the broader market might be awaiting clearer directional cues. The RSI at 60.63 sits comfortably in neutral territory, indicating no immediate overbought or oversold conditions on a longer timeframe. The MACD shows positive momentum, and the Stochastic is signaling an upward move with %K above %D. Yet, the ADX at 26.11, while indicating a decent trend, doesn't scream aggressive conviction. This neutral stance on the daily chart implies that while the current upward move has support, a sustained rally will likely require a stronger fundamental catalyst or a clear break of significant daily resistance levels, such as the $60.35 level highlighted in the topic, which is now acting as a resistance after being a key pivot.
The Dollar's Shadow: DXY's Influence on Silver
The US Dollar Index (DXY) is a critical barometer for precious metals, and its recent movements provide essential context for XAGUSD's performance. Currently trading around 99.72, the DXY is exhibiting a bearish trend on the 1-hour and 4-hour charts, with a strong downward trend indicated by its ADX. This weakening dollar environment often correlates with increased demand for safe-haven assets like silver. As the dollar loses value, it takes more dollars to purchase the same amount of silver, driving up its nominal price. Conversely, a strengthening dollar typically exerts downward pressure on silver prices. The current bearish sentiment surrounding the DXY, with its RSI in neutral territory and MACD showing negative momentum, suggests that the dollar might continue to weaken in the short term. This could provide a supportive backdrop for XAGUSD, potentially helping it overcome immediate resistance levels and extend its gains. Traders are closely watching the DXY's ability to maintain its current downward trajectory; a decisive break below key support levels on the DXY could further embolden silver bulls.
The correlation between silver and the dollar is not merely academic; it has tangible implications for trading strategies. When the DXY is in a clear downtrend, as it appears to be on the shorter timeframes, it often signifies a global risk-on sentiment or a shift in monetary policy expectations that favors assets other than the dollar. This can translate into increased investment flows into commodities like silver, which are perceived as inflation hedges or stores of value. The fact that XAGUSD is showing strength even as the dollar weakens highlights the interplay of multiple factors. While a weaker dollar is a tailwind, the robust technical signals on the shorter timeframes for silver suggest underlying buying interest independent of currency movements. However, any significant reversal in the DXY's trend, perhaps spurred by stronger-than-expected US economic data or hawkish commentary from the Federal Reserve, could quickly dampen silver's bullish prospects.
Economic Catalysts: What's Driving the Macro Picture?
Looking beyond technical charts and currency correlations, the fundamental economic data releases are the true arbiters of sustained price movements. Recent news indicates that New Zealand's labor market delivered a surprisingly strong employment report, with robust hiring despite a rise in unemployment. While this specific data point is for the NZD, it reflects a broader theme of economic resilience in some regions, which can influence global risk appetite and, by extension, commodity prices. More critically for XAGUSD, upcoming economic events will be pivotal. The US ADP Employment Report, which showed weaker-than-expected job creation at 44k, has reinforced market convictions that the Federal Reserve might be nearing the end of its rate-hiking cycle. This anticipation of a Fed pause or pivot is generally bullish for commodities like silver, as it reduces the attractiveness of interest-bearing assets and can signal a more accommodative monetary policy environment ahead.
The market's reaction to economic data is often as important as the data itself. The weaker ADP numbers, for instance, have led to a slip in the dollar, as traders reassess the likelihood of further Fed tightening. This is precisely the kind of scenario that can boost precious metals. If upcoming inflation data, such as CPI or PPI reports, also show signs of cooling, it would further solidify expectations of a Fed pivot, potentially unleashing a stronger rally in silver. Conversely, any data that suggests inflation remains stubbornly high or that the labor market is overheating could reignite hawkish Fed expectations, strengthening the dollar and pressuring XAGUSD. Investors are also keeping a close eye on geopolitical developments, particularly those that could impact energy prices and inflation expectations. News regarding India weighing a gas levy to bankroll its fuel reserve plan, for example, highlights ongoing concerns about energy security and potential inflationary pressures, which can indirectly support silver as an inflation hedge.
Navigating Technical Signals: A Deeper Dive
Delving deeper into the technical indicators, the ADX (Average Directional Index) provides crucial insights into trend strength. On the 1-hour chart, the ADX stands at 49.14, indicating a very strong trending market. This suggests that the current price action is not merely a fluctuation but part of a committed trend. However, on the 4-hour chart, the ADX drops to 19.93, signaling a weaker trend. This divergence is important: it implies that while short-term momentum is strong, the longer-term trend may be consolidating or losing conviction. On the daily chart, the ADX is 26.11, indicating a strong trend, which creates a conflict with the 4-hour reading. This suggests that while there is directional movement, the conviction behind it varies significantly across different timeframes. Traders often look for confluence across multiple timeframes to confirm a trade setup, and this conflicting ADX data warrants caution.
The Relative Strength Index (RSI) further illustrates this divergence. On the 1-hour chart, the RSI is at 64.71, well within neutral territory and suggesting room for upward movement. However, on the 4-hour chart, it reaches 74.84, firmly in overbought territory. This indicates that the recent sharp move higher has pushed silver into a region where pullbacks are more probable. On the daily chart, the RSI is at 60.63, which is healthy and does not signal overbought conditions. This reinforces the idea that while the immediate price action might be experiencing selling pressure due to overbought conditions on shorter timeframes, the longer-term outlook remains more balanced. The Stochastic Oscillator, showing %K above %D on the 1-hour and 1-day charts, generally supports a bullish bias, but its high readings on the 4-hour chart (83.1) also point towards overbought conditions. This mixed signal from the oscillators suggests that traders should be cautious about chasing the rally and instead look for confirmation of continued strength or potential consolidation.
The Role of Support and Resistance
Understanding key support and resistance levels is paramount for any trader. For XAGUSD, currently priced at $62.05, the immediate focus is on the resistance level at $62.34 on the 1-hour chart. A decisive close above this price point could trigger further buying, potentially targeting the next resistance at $62.49. On the other hand, immediate support lies at $62.06. A break below this level could lead to a test of the next support at $61.93. On the daily chart, the resistance level of $60.35 mentioned in the topic is now a critical pivot point. While the current price is above this, it represents a significant area that has previously acted as both support and resistance, and its breach to the upside confirms the recent bullish momentum. The longer-term support levels are significantly lower, with $58.30 and $57.10 identified as key areas of interest should a more substantial correction occur. The proximity of immediate support at $62.06 to the current price of $62.05 means that the market is treading on thin ice in the very short term, and any negative catalyst could trigger a swift move lower.
The interplay between these levels and the broader market sentiment is what creates trading opportunities. A bullish scenario would involve XAGUSD holding above the $62.06 support, consolidating, and then breaking decisively above the $62.34 resistance. This would likely be fueled by continued dollar weakness and positive economic data. Conversely, a bearish scenario would see a break below $62.06, followed by a failure to reclaim it, potentially leading to a test of lower support levels. This could be triggered by stronger-than-expected US economic data, hawkish Fed commentary, or a sharp uptick in the DXY. The neutral stance on the daily chart suggests that the market is in a wait-and-see mode, and the resolution of these immediate support and resistance levels will likely dictate the short-to-medium term direction. Traders should be looking for confirmation, such as a strong volume surge on a breakout or breakdown, to validate their positions.
Integrating Fundamental and Technical Analysis
The most effective trading strategies integrate both fundamental and technical analysis. For XAGUSD at $62.05, the current technical picture is a mix of strong short-term bullish signals and cautionary overbought conditions on the 4-hour chart, alongside a neutral daily outlook. This suggests that while there is upward momentum, it may not be sustainable without fundamental backing. The weakening DXY and the market's fading expectations of further Fed rate hikes are significant fundamental tailwinds. If upcoming economic data, such as inflation reports or further employment figures, continue to support a less hawkish Fed stance, silver could see sustained upward pressure. The recent news about India's energy reserve plans also adds a layer of complexity, hinting at potential inflationary pressures that could benefit silver as a hedge.
However, traders must remain aware of potential headwinds. Any unexpected inflation surge or hawkish shift in central bank rhetoric could quickly reverse the current sentiment. The conflict in ADX readings across timeframes also indicates that the trend's conviction is not uniform. This calls for a disciplined approach, emphasizing risk management. For instance, a trader might wait for a clear break above $62.34 with confirming volume and positive DXY action before entering a long position, while setting a tight stop-loss below $62.06. Alternatively, a break below $62.06 could signal an opportunity for a short trade, targeting lower support levels, but only if the fundamental backdrop also turns bearish. The key is to let the price action and the confirmed fundamental drivers dictate the strategy, rather than forcing a trade based on incomplete signals.
The Path Forward: Scenarios and Probabilities
Considering the current data, several scenarios are plausible for XAGUSD. The dominant narrative on shorter timeframes is bullish, but the neutral daily outlook and mixed indicator signals introduce uncertainty. The primary scenario favors a continuation of the upward trend, contingent on XAGUSD holding above the immediate support at $62.06 and breaking through the $62.34 resistance. This would likely be supported by a continued weakening of the US dollar and potentially softer inflation data. If this scenario plays out, we could see silver testing higher resistance levels, possibly aiming for the $63.00 psychological mark and beyond. The probability of this scenario is moderately high, given the current bullish technicals on lower timeframes and supportive macro factors.
A contrasting bearish scenario would emerge if XAGUSD fails to hold the $62.06 support and breaks decisively below it. This could be triggered by stronger-than-expected US economic data, a sudden hawkish shift from the Fed, or a significant geopolitical event that bolsters the dollar and dampens risk appetite. In this case, silver could retrace significantly, testing the support levels around $60.84 and potentially lower. The probability of this scenario is moderate, given the overbought signals on the 4-hour chart and the neutral daily trend. A third scenario involves consolidation. Given the conflicting signals across timeframes and the anticipation of key economic data releases, XAGUSD might enter a period of range-bound trading. This would likely occur between the immediate support at $62.06 and resistance at $62.34, with price action potentially becoming more volatile as key economic events approach. The probability of consolidation is also moderate, especially as traders position themselves ahead of major data releases.
Frequently Asked Questions: XAGUSD Analysis
What happens if XAGUSD breaks above the $62.34 resistance level?
A decisive close above $62.34, especially with strong volume and supportive macro conditions like a weakening DXY, would likely trigger further upside momentum. This could lead to silver testing higher resistance levels, potentially targeting the $63.00 psychological mark and subsequent daily resistance points around $63.71.
Is the RSI at 64.71 on the 1H chart a buy signal for XAGUSD at $62.05?
An RSI of 64.71 on the 1-hour chart is in neutral territory, suggesting room for further upside before becoming overbought. While not an immediate buy signal on its own, it indicates current bullish momentum is healthy. Confirmation from other indicators and price action breaking resistance would strengthen the bullish case.
How will the upcoming US economic data releases affect XAGUSD?
Upcoming data releases, particularly inflation and employment figures, will be critical. Data suggesting cooling inflation or a softening labor market could reinforce expectations of a Fed pause, strengthening XAGUSD. Conversely, hot data could lead to renewed Fed tightening bets, weakening silver.
Should traders consider buying XAGUSD at current levels of $62.05 given the mixed technical signals?
Buying at $62.05 requires careful consideration due to mixed signals across timeframes. A more prudent approach might involve waiting for confirmation: either a hold above $62.06 support with a clear bullish setup or a confirmed breakout above $62.34 resistance. Strict risk management is advised.
Track markets in real-time
AI-powered analysis, technical indicators and real-time price data.
Join Our Telegram Channel
Breaking market news, AI analysis and trading signals instantly.
Join Channel