

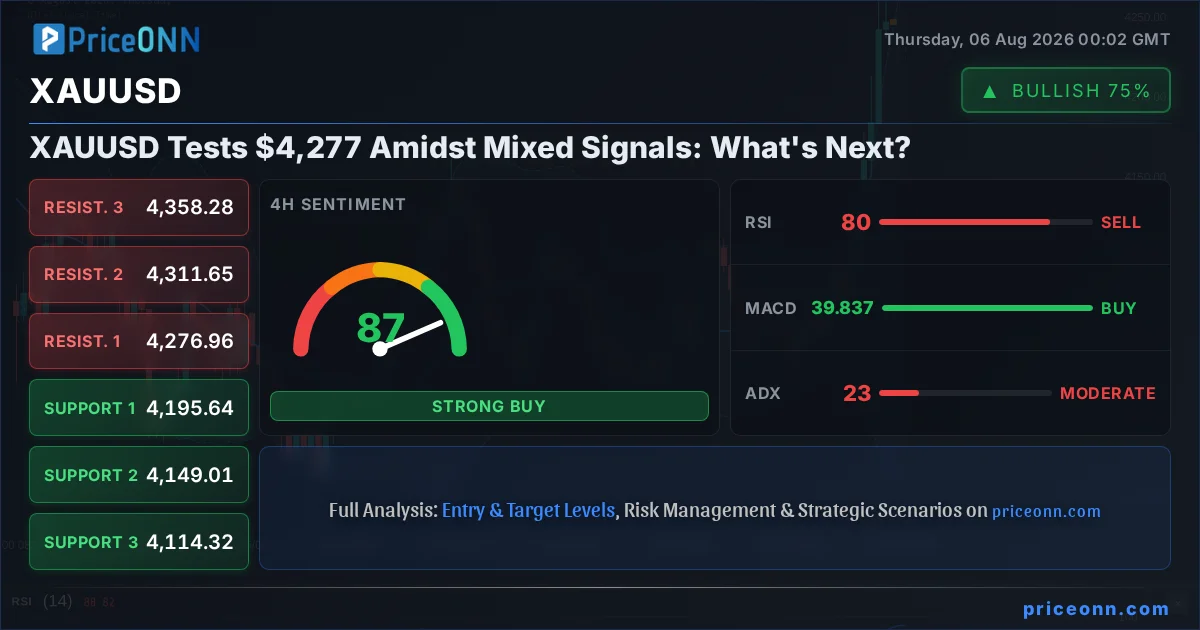
Is the current consolidation in gold, trading at $4,277.05, a pause before the next major move, or a sign of indecision? The precious metal has been on a significant uptrend, but recent technical readings present a complex picture, with key support levels hovering well below current prices. This analysis delves into the intricate interplay of indicators, price action, and potential scenarios to decipher the immediate future for XAUUSD.
- Gold's current price is $4,277.05, with RSI at 67.36 indicating rising but not yet overbought conditions.
- Critical support identified at $4,044.40; a sustained break below this level would signal a bearish shift.
- The ADX at 26.2 on the daily chart suggests a strong trend is in play, yet conflicting signals from other indicators warrant caution.
- DXY's current level near 99.68 and its inverse correlation with gold are crucial factors to monitor for directional bias.
The ascent of gold has been remarkable, pushing prices to $4,277.05. However, the technical landscape is far from straightforward. On the 1-hour chart, the trend is decidedly bullish with 100% strength, supported by an RSI at 79.18, indicating an extremely overbought condition that historically precedes pullbacks. The MACD remains positive, and the Bollinger Bands are showing expansion above the middle band, suggesting upward momentum. Stochastic oscillators are also deep in overbought territory, with %K at 82.78 and %D at 83.29. The ADX reading of 58.46 on this timeframe screams a very strong trend. Yet, this short-term exuberance is tempered by the daily chart's more neutral stance, where the trend strength is only 50%. This divergence across timeframes is precisely where the market's current indecision lies.
On the 4-hour chart, the picture remains bullish overall, but with nuances. The trend is strong at 100% strength, and the RSI sits at a very high 81, further confirming the overbought nature of the current price action. This level suggests that while the buying pressure is immense, the potential for profit-taking or a sharp correction increases significantly. The MACD continues to show positive momentum, and prices are trading above the upper Bollinger Band, a sign of strong upward pressure but also potential exhaustion. Stochastic readings are even more extreme here, with %K at 90.81 and %D at 84.53, firmly in overbought territory. However, the ADX on this timeframe drops to 22.7, indicating a moderate trend strength, which clashes with the 1-hour's aggressive trend reading. This suggests that while the momentum is strong, the underlying trend's conviction might be wavering, especially when viewed on a slightly longer timeframe.
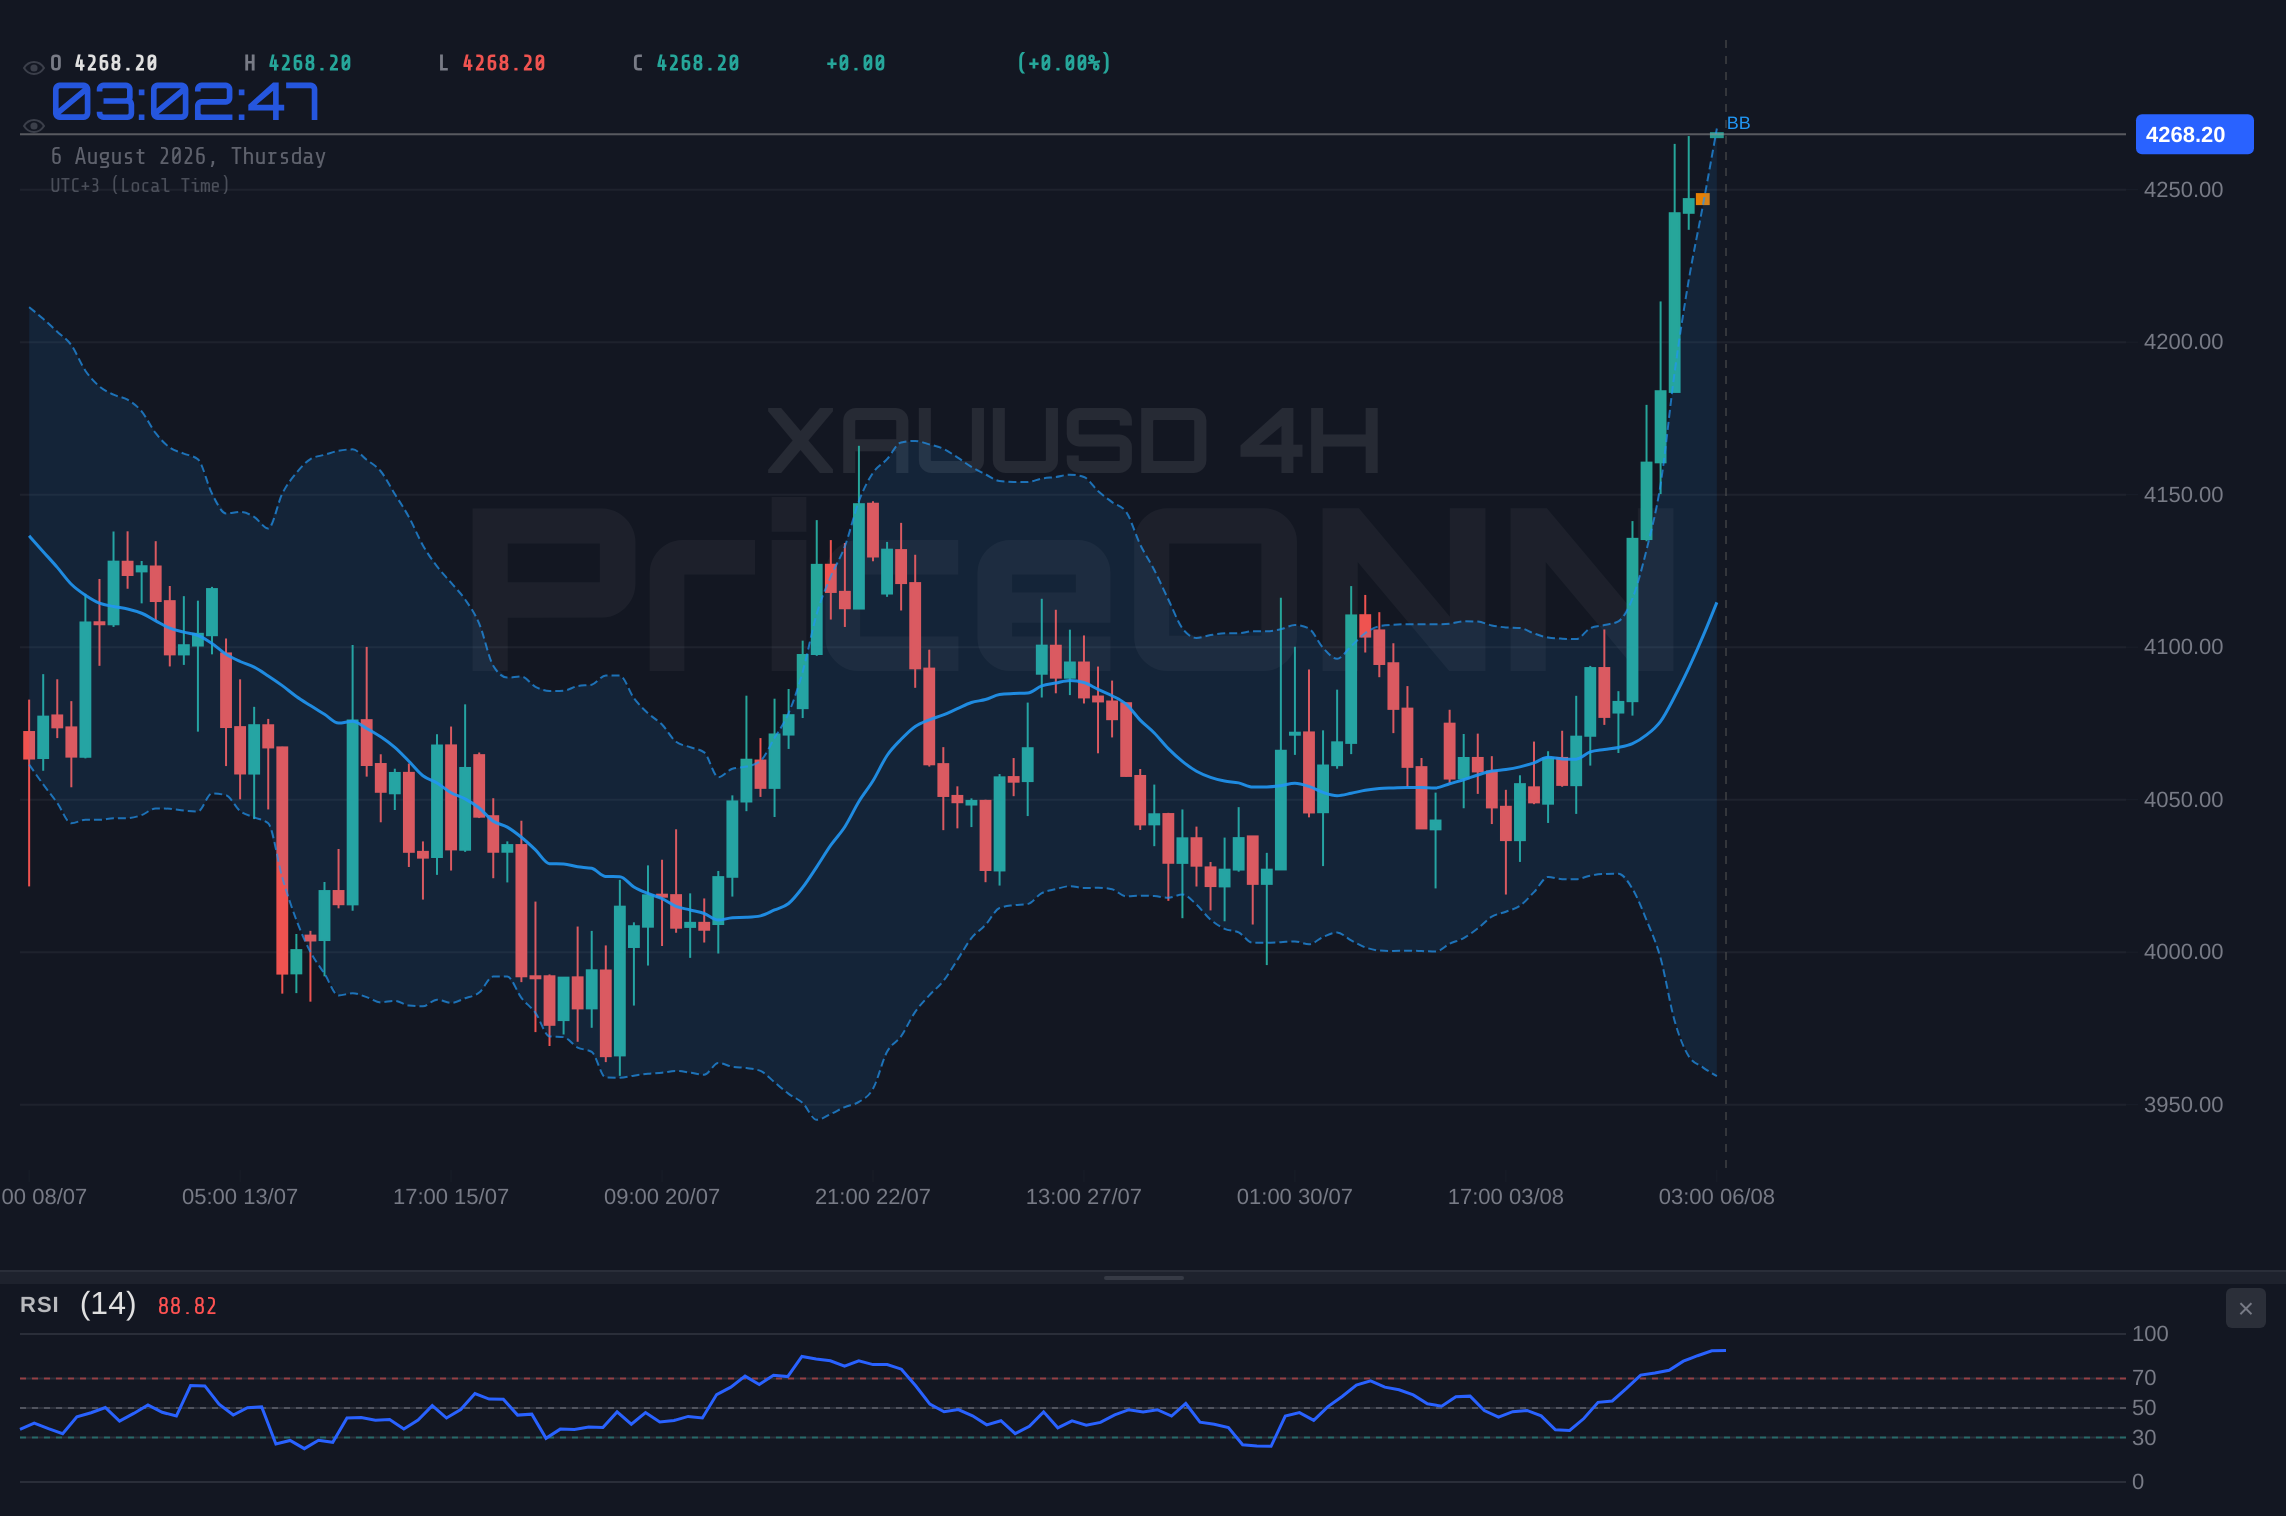
The daily chart, often considered the most reliable for long-term direction, paints a more neutral picture for XAUUSD, with a trend strength of 50%. Here, the RSI is at 62.13, comfortably in the neutral zone and still showing room for upward movement, unlike its shorter-term counterparts. The MACD is positive with its signal line above, indicating bullish momentum. Prices are also trading above the upper Bollinger Band, hinting at potential overextension, but without the extreme readings seen on intraday charts. Stochastic oscillators, with %K at 63.65 and %D at 49, show a bullish signal as %K crosses above %D, suggesting further upside potential. The ADX at 26.2 indicates a strong uptrend, which aligns better with the shorter-term trend strength but still presents a more moderate view than the 1-hour chart. This daily perspective is crucial; it suggests that while short-term traders might be experiencing an overheated market, the longer-term trend still holds some promise, provided key support levels are maintained.
Why $4,044 is the Line in the Sand
The crucial support levels for gold are paramount in understanding the current market's vulnerability. On the 1-hour chart, immediate support is seen at $4,245.87, followed by $4,241.75 and $4,237.74. These are relatively close to the current price and could offer intraday bounce opportunities. However, the more significant levels lie further down. The 4-hour chart identifies support at $4,195.64, $4,149.01, and $4,114.32. These are substantial cushions that would need to be breached for the bullish sentiment to truly falter on this timeframe. But the ultimate line in the sand, as indicated by the daily data, is $4,044.40. This level, along with $4,011.66 and $3,980.95, represents the bedrock of the current upward trend. A decisive break below $4,044.40 on the daily chart would invalidate the bullish thesis and likely trigger a significant sell-off, potentially reversing months of gains. Traders are watching this zone intently; a failure to hold here would signal a major shift in market sentiment and risk appetite.
The correlation with the US Dollar Index (DXY) cannot be overstated. With the DXY currently trading around 99.68 and showing a bearish trend on multiple timeframes, this typically provides a tailwind for gold. A weaker dollar generally makes dollar-denominated assets like gold cheaper for holders of other currencies, increasing demand. The DXY's recent pullback, driven by fading Fed rate hike expectations evidenced by weak ADP employment data (44k versus expectations), has likely contributed to gold's surge. However, if the dollar finds support or reverses its trend, it could quickly put pressure on XAUUSD, even if other factors remain supportive. The market's focus is shifting towards upcoming economic reports, and any data that strengthens the case for continued Fed caution could keep the dollar subdued, indirectly supporting gold. Conversely, any hawkish signals from Fed officials or stronger-than-expected US economic data could quickly reverse this dynamic.
Considering the broader market context, the performance of equities like the S&P 500 and Nasdaq is also a vital clue. The S&P 500 is showing a mixed but generally upward trend on intraday charts, currently at 6572.87, while the Nasdaq is down slightly at 29454.4. This mixed equity performance doesn't offer a clear signal for risk appetite. Typically, a strong risk-on environment supports gold as investors seek opportunities, while a risk-off environment drives demand for safe-haven assets like gold. The current divergence, with the S&P 500 climbing while the Nasdaq pulls back, suggests underlying caution. If risk sentiment were to deteriorate significantly, leading to a sharper decline in major indices, gold could see increased safe-haven flows, potentially overriding some of the overbought technical signals. However, if equities continue their upward trajectory, it might signal a risk-on mood where investors prioritize growth assets over safe havens, potentially capping gold's upside.
The Bull's Roadmap: $4,277 and Beyond
For the bulls to maintain control and push gold higher, several conditions need to be met. The immediate resistance levels on the 1-hour chart are at $4,254, $4,258.01, and $4,262.13. A decisive break and hold above these short-term hurdles, particularly $4,262.13, would be the first sign of renewed upward momentum. The 4-hour chart presents resistance at $4,276.96, $4,311.65, and $4,358.28. A clear breakout above $4,276.96, the current intraday resistance, is essential. If XAUUSD can establish a firm foothold above $4,277.05 and then convincingly clear $4,311.65, the next target would be $4,358.28. This scenario hinges on the daily chart maintaining its bullish bias and avoiding a close below the critical $4,044 support. The RSI would need to cool off from its extreme levels, perhaps settling in the 60-70 range, and the ADX should ideally remain strong, indicating a sustained trend rather than a sharp, unsustainable spike. This path suggests a potential move towards the $4,350-$4,400 range within the next few weeks, contingent on broader market sentiment remaining favourable or turning risk-averse.
Where Bears Take Control: The $4,044 Breakdown
The bearish scenario becomes increasingly probable if gold fails to hold its key support levels. The immediate trigger for concern would be a daily close below $4,044.40. This level has acted as a significant floor, and its breach would likely signal a loss of bullish conviction. Following such a breakdown, the next support to watch on the daily chart is $4,011.66, and then $3,980.95. A break below this cluster could initiate a sharp correction, potentially targeting levels closer to $3,900 or even $3,800 in a more extreme risk-off scenario. This bearish thesis would be supported by a strengthening dollar (DXY moving above 100), a significant risk-on rally in equities, or any geopolitical de-escalation that reduces safe-haven demand for gold. Technically, this would involve the RSI on the daily chart falling below 50, MACD turning negative, and ADX readings starting to decline from their current strong levels, indicating a weakening trend. The Stochastic oscillators would likely also turn downwards from overbought territory across all timeframes.
The Waiting Game: Consolidation Near $4,277
A neutral scenario suggests that gold may remain range-bound, consolidating its recent gains without a clear directional bias in the short to medium term. This would likely occur if the bullish momentum fades due to extreme overbought conditions on shorter timeframes, preventing further upside, while the underlying fundamental support and the daily chart's bullish leanings prevent a significant sell-off. In this scenario, prices might oscillate between the current resistance near $4,277 and the nearest intraday support levels around $4,245. The key levels to watch for range definition would be the upper resistance at $4,276.96 and the immediate support at $4,245.87. Price action could become choppy, with failed attempts to break higher or lower. This neutral stance is often seen when market participants await crucial economic data or central bank policy cues. The ADX readings across timeframes might converge towards lower values, indicating a lack of strong trend conviction. Traders in this environment would focus on range-bound strategies, looking for bounces off support and rejections at resistance, while keeping a close eye on any signs of a breakout or breakdown that could signal the end of the consolidation phase.
The current technical setup for XAUUSD presents a classic 'watch and wait' scenario. While shorter-term indicators scream overbought conditions and potential for a pullback, the daily chart still shows underlying strength and a bullish trend. The ADX readings across different timeframes present a confusing picture: extremely strong on the 1H, moderate on the 4H, and strong again on the 1D. This divergence suggests that the market is grappling with conflicting impulses. The significant gains achieved recently, coupled with extremely high RSI and Stochastic readings on intraday charts, increase the probability of a short-term correction. However, the fundamental backdrop, including a weaker dollar and persistent inflation concerns, provides a solid floor. Therefore, the most likely near-term scenario appears to be a period of consolidation or a mild pullback, rather than a dramatic reversal, unless key support levels are decisively broken. A daily close below $4,044.40 would be the primary signal for a bearish shift.
What I'm Watching This Week
My focus this week is on a few critical triggers that will likely dictate XAUUSD's next significant move. Firstly, I'm watching the $4,276.96 resistance level on the 4-hour chart. A convincing break and hold above this level, supported by increased volume and cooling RSI, could signal a continuation of the bullish trend towards $4,311.65 and beyond. Secondly, the $4,044.40 daily support level is paramount. Any daily candle closing significantly below this mark would invalidate the bullish outlook and likely initiate a sharp downside move. I'll be monitoring the DXY's reaction to upcoming economic data; a sustained rise in the dollar could be the catalyst for gold's decline. Lastly, I'm looking for confirmation from equity markets. A sharp drop in the S&P 500 or Nasdaq could increase safe-haven demand for gold, even if technically overbought, while a strong rally might signal a risk-on environment that could pressure precious metals.
The path forward for gold hinges on its ability to digest recent gains and either push through resistance levels or find a stable footing above key support. The confluence of strong intraday bullish signals and daily chart caution creates a volatile environment. Patience will be key for traders navigating this market. The $4,044.40 level remains the most critical indicator of the trend's health; until then, the possibility of further upside, albeit with potential for pullbacks, remains on the table. Market participants are advised to manage risk diligently and wait for clear directional confirmation before committing to significant positions.
Bearish Scenario: The $4,044 Support Test
65% ProbabilityBullish Scenario: Breaking the $4,300 Barrier
25% ProbabilityNeutral Scenario: Range-Bound Consolidation
10% ProbabilityTechnical Outlook Summary
| Indicator | Value | Signal | Interpretation |
|---|---|---|---|
| RSI (14) | 67.36 | Neutral | RSI at 67.36 suggests room to move, but caution is advised as it approaches overbought territory. |
| MACD Histogram | +199.91 | Bullish | Positive MACD histogram indicates strengthening bullish momentum. |
| Stochastic | K: 82.78, D: 83.29 | Bearish | Stochastic %K and %D are in overbought territory (above 80), signaling potential for a price pullback. |
| ADX | 58.46 | Strong Trend | ADX at 58.46 indicates a very strong trend is in place, favoring continuation. |
| Bollinger Bands | Upper Band | Watch | Price trading above the upper Bollinger Band suggests strong upward momentum but also potential for overextension. |
Frequently Asked Questions: XAUUSD Analysis
What happens if XAUUSD breaks below the $4,044.40 support level?
A daily close below $4,044.40 would invalidate the current bullish outlook and likely trigger a significant sell-off. The next key support levels to watch would be $4,011.66 and then $3,980.95.
Should I buy XAUUSD at current levels near $4,277 given the overbought RSI?
Buying at current levels near $4,277 carries risk due to the overbought RSI (67.36 on daily, higher on intraday) and Stochastic readings. A more prudent approach might be to wait for a pullback to a key support level like $4,195.64 or confirmation of a breakout above immediate resistance at $4,276.96.
Is the ADX at 58.46 on the 1H chart a buy signal for XAUUSD?
An ADX of 58.46 indicates an extremely strong trend, which technically supports the current bullish move. However, this reading, combined with overbought oscillators on the 1H chart, suggests the trend might be nearing exhaustion, making it a risky entry point without further confirmation or a price pullback.
How will the weaker DXY around 99.68 affect XAUUSD this week?
The weaker DXY around 99.68, driven by fading Fed rate hike expectations, generally supports gold prices by making dollar-denominated assets cheaper. This correlation is likely contributing to gold's strength, but a reversal in the dollar's trend could quickly pressure XAUUSD, especially if equities rally.
Track markets in real-time
AI-powered analysis, technical indicators and real-time price data.
Join Our Telegram Channel
Breaking market news, AI analysis and trading signals instantly.
Join Channel