

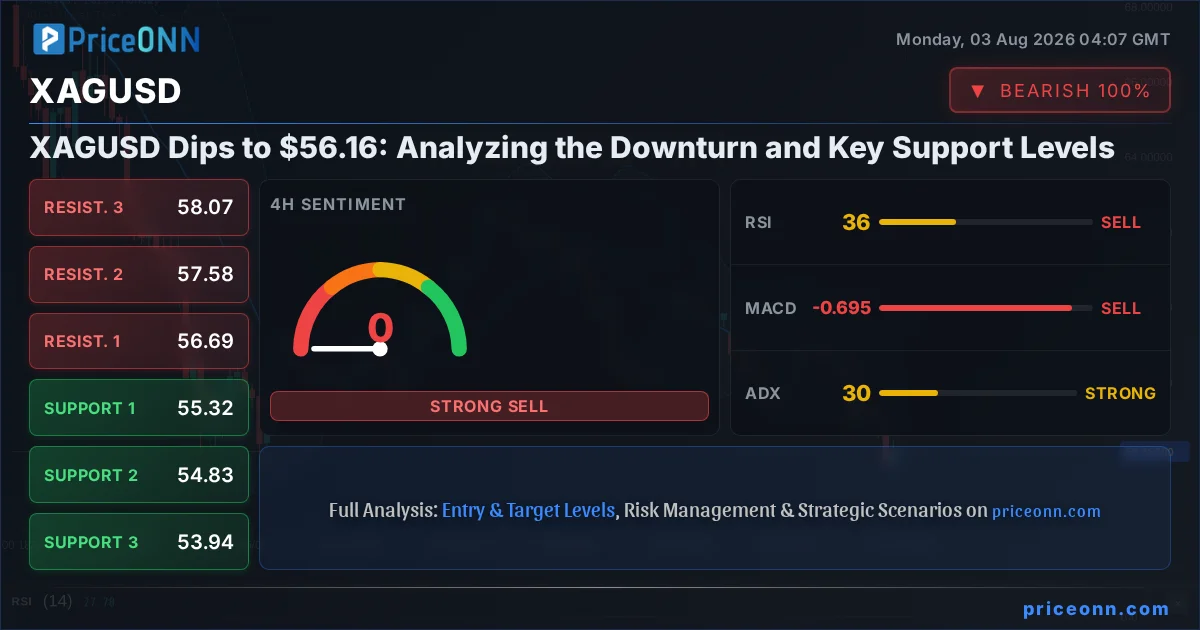
The sharp plunge in silver prices to $56.16 today has captured the attention of traders and analysts alike. This significant move, marking a 2.73% daily decline, brings the precious metal into a critical juncture, testing key support levels that have historically held firm. As the 1H, 4H, and Daily timeframes paint a predominantly bearish picture, understanding the confluence of technical indicators and broader market correlations is paramount for navigating this volatile period. The question on everyone's mind is whether this dip represents a temporary pullback within a larger uptrend, or the beginning of a more sustained bearish phase. This analysis delves into the intricate details of XAGUSD's current technical posture, exploring the critical levels to watch and the potential scenarios that could unfold.
- RSI at 37.11 on the 1H chart signals oversold pressure, but the overall trend remains bearish across multiple timeframes.
- Critical support sits at $55.97 (1H), $55.32 (4H), and $56.54 (1D), tested amidst strong downward momentum.
- MACD histogram shows negative momentum on 1H and 4H, suggesting bearish sentiment is prevailing.
- The ADX reading of 35.29 on the 1H chart indicates a strong downward trend, while the 1D ADX at 42.27 confirms robust trend strength.
- Correlation with a strengthening DXY (100.7) and a falling SP500 (6572.87) adds further pressure on silver.
The Bear's Grip Tightens: Analyzing XAGUSD's Current Technical Landscape
Deeper into the Downtrend: Multi-Timeframe Indicators
The technical indicators across XAGUSD's charts are largely flashing red, painting a consistent picture of bearish momentum. On the 1-hour timeframe, the Relative Strength Index (RSI) hovers at 37.11, firmly in neutral territory but exhibiting a downward lean, suggesting bears are in control of the immediate price action. This is further corroborated by the Moving Average Convergence Divergence (MACD), which shows negative momentum with the MACD line below its signal line. Bollinger Bands are also signaling caution, with the price trading below the middle band, indicating bearish pressure. While the Stochastic Oscillator presents a brief flicker of hope with a K > D crossover (43.73 vs 25.17), it's crucial to note the strong trend indicated by the Average Directional Index (ADX) at 35.29, signifying a robust downward trend. The overall signal on this timeframe leans heavily towards selling, with 7 out of 8 indicators pointing downwards.
Zooming out to the 4-hour chart reveals an even more entrenched downtrend. The trend strength is rated at a formidable 100%, with the RSI at 35.87 and MACD displaying negative momentum below the signal line. Bollinger Bands remain below the middle band, reinforcing the bearish sentiment. The Stochastic Oscillator here shows a clear bearish signal (%K
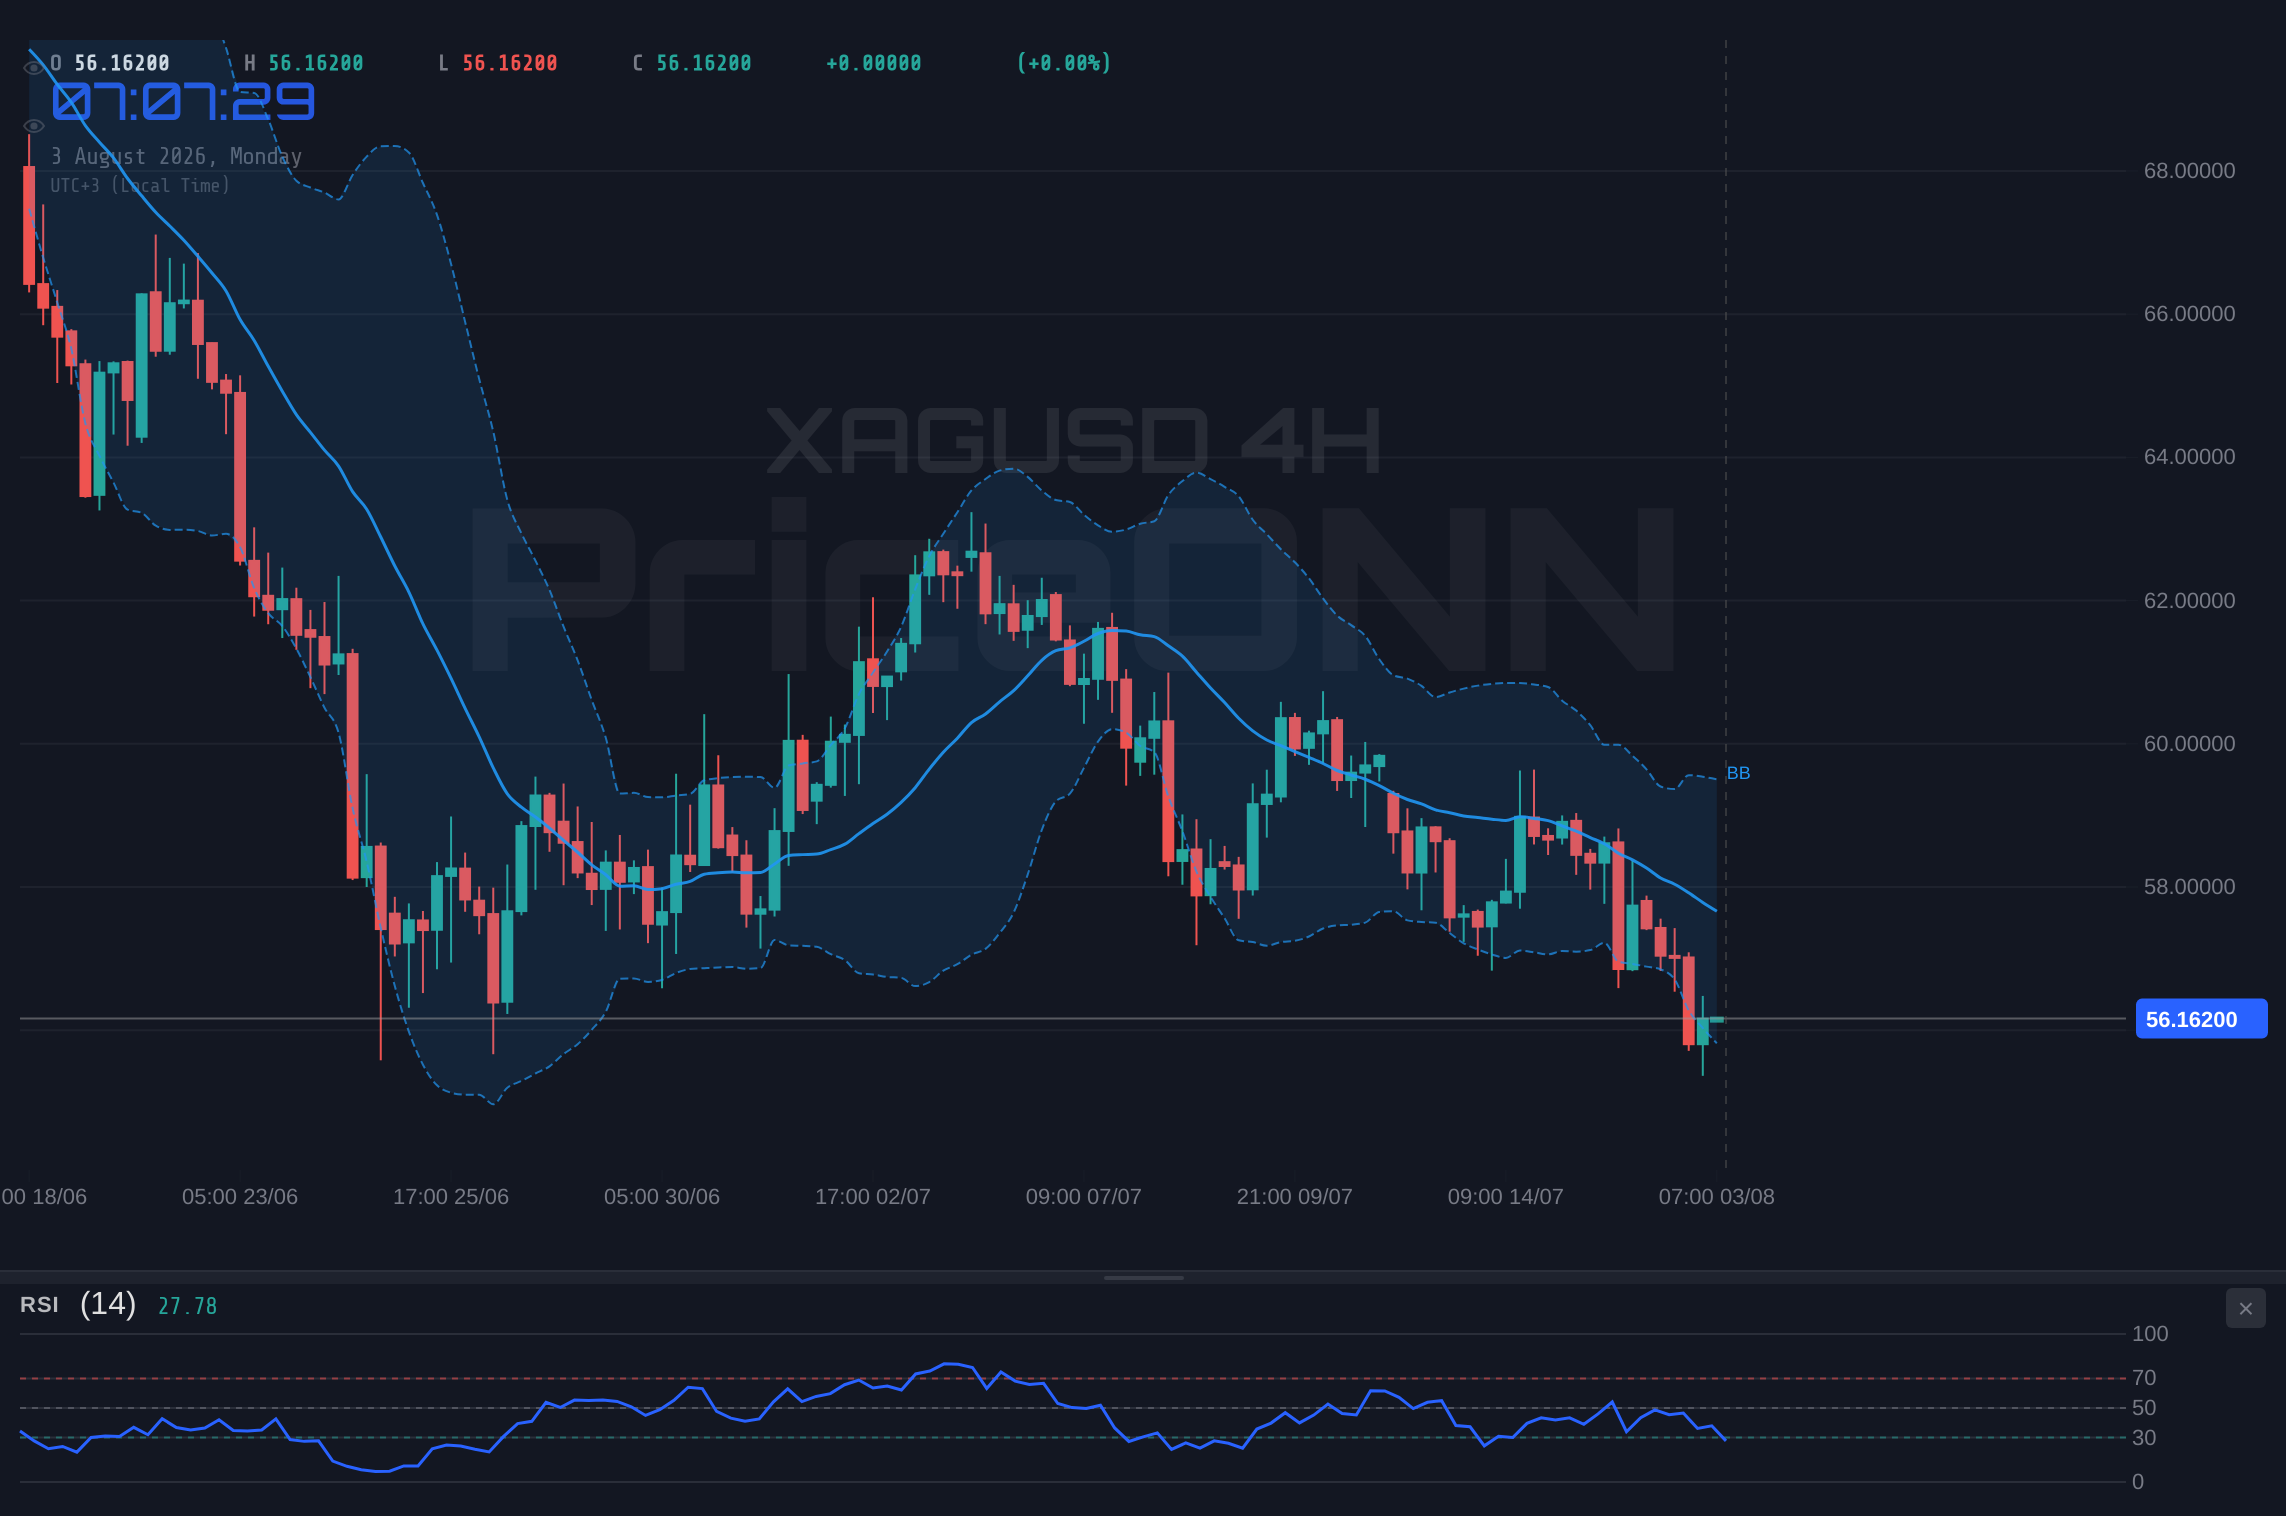
The daily chart provides the broadest perspective, and it too is firmly in bearish territory with a trend strength of 100%. The RSI at 34.24 is approaching oversold conditions, which could signal a potential reversal is on the horizon, but it is not yet there. The MACD, interestingly, shows positive momentum here, with the MACD line above its signal line, a stark contrast to the shorter timeframes. This divergence could be a leading indicator, but it's currently being overshadowed by the bearish signals from other indicators. Bollinger Bands are once again below the middle band, and the Stochastic Oscillator continues its bearish trajectory (%K=18.69, %D=32.03). The ADX at 39.16 confirms a strong, established downtrend. The overall daily signal is a strong sell, with one buy signal against seven sell signals.
Correlation Analysis: The Dollar's Shadow and Equity Market Weakness
To fully grasp the pressure on silver, we must consider its correlation with broader market forces. The US Dollar Index (DXY) is currently trading at 100.7, showing a notable increase of 0.21% on the day. This strengthening dollar acts as a significant headwind for commodities like silver, which are often priced in dollars. As the DXY rises, the cost of dollar-denominated assets increases for holders of other currencies, typically dampening demand. The pattern is clear: with DXY at 100.7 and showing upward momentum on the 1H chart, XAGUSD faces considerable selling pressure.
Furthermore, the performance of major equity indices paints a risk-off picture, which also impacts precious metals. The S&P 500 (SP500) is down 0.74% at 6572.87, and the Nasdaq 100 (Nasdaq) has seen a more substantial drop of 1.16% to 29164.86. This decline in risk appetite often leads investors to seek refuge in traditional safe-haven assets. While gold (XAUUSD) is also experiencing a downturn today (-1.46%), silver's correlation can be more complex. However, a general flight to safety, or even a liquidation of risk assets, can lead to broad-based commodity selling, including silver. The fact that both major indices are in the red, with SP500 at 6572.87, supports the bearish case for silver.
Oil prices, particularly Brent crude at 83.79 and WTI at 79.59, are also showing declines today. While oil's impact on inflation expectations and thus gold's safe-haven appeal is well-documented, its direct correlation with silver can be more nuanced. Today's dip in oil prices might suggest a slight easing of immediate inflation fears or a reaction to broader market weakness rather than a direct driver of silver's decline. However, any sustained move in oil could eventually feed into inflation narratives, indirectly influencing silver's appeal.
Navigating the Price Action: Key Levels and Potential Scenarios
The Bull's Roadmap: A Path to Recovery?
For silver bulls to regain control, a decisive break above immediate resistance levels is crucial. The first significant hurdle on the 1H chart is the resistance at $4019.21. A sustained move above this level, ideally with increasing volume and confirming bullish signals on shorter timeframes, could signal a short-term reversal. The 4H resistance at $4026.74 would be the next key level to conquer. If buyers can push XAGUSD decisively above this mark, it would suggest a potential shift in momentum, perhaps retesting the daily resistance levels. The daily resistance zone, starting at $4088.69, becomes the ultimate target for a bullish scenario aiming to reverse the current downtrend. Such a move would likely require a significant shift in market sentiment, possibly driven by a weakening dollar or a strong recovery in risk assets.
However, the current technical setup presents significant challenges for such a bullish outlook. The confluence of bearish signals across multiple timeframes, the strong downward trend indicated by the ADX, and the prevailing risk-off sentiment make a sustained rally unlikely without a clear catalyst. If XAGUSD were to break above $4019.21, the invalidation of this bullish thesis would occur on a close back below the 1H support at $3991.8. The immediate targets would be the 1H resistance at $4019.21, followed by the 4H resistance at $4026.74. A more ambitious target, assuming strong follow-through buying and a shift in broader market dynamics, could see prices aiming for the daily resistance at $4088.69, though this appears less probable in the immediate term given the current data.
Where Bears Take Control: The Downside Risk
The path of least resistance for XAGUSD currently appears to be downwards. The immediate support level to watch on the 1H chart is $3991.8. A break below this level, especially if accompanied by increased selling volume and bearish confirmation from indicators, could accelerate the decline. The 4H support at $3973.82 and the 1D support at $4024.67 (though this is now resistance on shorter timeframes) are critical areas. However, the more significant support levels lie lower. The 4H chart highlights $3955.54 and $3920.9 as key areas where buying interest might emerge. On the daily chart, the next substantial support zone is found at $3988.95, followed by $3960.65.
A decisive break below the 1H support at $3991.8 would trigger a bearish scenario, invalidating any immediate hopes for a recovery. The primary target for this move would be the 4H support at $3973.82. If this level fails, the next logical target would be the psychological level of $3950, followed by the more defined 4H support at $3955.54. Further downside could see XAGUSD testing the $3920.9 level. The invalidation of this bearish outlook would occur if price decisively closes back above the 1H resistance at $4019.21, suggesting the initial dip was a false breakout or a liquidity grab.
The Waiting Game: Consolidation and Range-Bound Action
While the dominant trend signals are bearish, the possibility of a consolidation phase cannot be entirely dismissed, especially considering the ADX readings on the 4H chart (29.63) which suggest a weakening trend. A neutral scenario would involve XAGUSD trading within a defined range, likely between the immediate 1H support at $3991.8 and the 1H resistance at $4019.21. In this range-bound environment, price action might become choppy, with quick reversals and failed breakout attempts. This could occur if market participants await clearer direction from upcoming economic data or a significant shift in the DXY or equity markets. During such a period, volatility might decrease, and the ADX could trend lower, indicating a lack of strong directional conviction.
For consolidation to persist, price would need to respect these immediate boundaries. A failure to decisively break above $4019.21 and a subsequent failure to break below $3991.8 would keep XAGUSD in a holding pattern. The targets within this range would be limited, likely seeing price oscillate between these two levels. The invalidation for this neutral scenario would be a clear break outside of this defined range, either upwards past $4019.21 or downwards past $3991.8, leading into either the bullish or bearish scenarios described previously. This phase might offer opportunities for scalpers but would likely frustrate swing traders seeking a clear directional move.
The Most Probable Path Forward: Scenarios and Probabilities
Bearish Scenario: Testing Lower Depths
65% ProbabilityNeutral Scenario: Range-Bound Hesitation
25% ProbabilityBullish Scenario: A Glimmer of Hope
10% ProbabilityGiven the current technical indicators and market correlations, the bearish scenario holds the highest probability at 65%. The strong downtrend signals across daily and 4-hour charts, coupled with the bearish momentum on shorter timeframes and the strengthening dollar, create a challenging environment for silver bulls. The ADX readings on the daily (39.16) and 1H (35.29) charts strongly support a continuation of the downward trend. The RSI on the daily chart is approaching oversold territory, which could eventually provide a floor, but the immediate pressure suggests further downside is more likely than a sharp reversal. The neutral scenario, with a 25% probability, accounts for the possibility of consolidation as traders await clearer signals or key economic data releases. The bullish scenario, at only 10% probability, reflects the significant technical hurdles and prevailing market sentiment that must be overcome for silver to stage a meaningful recovery.
What I'm Watching This Week: Key Triggers for XAGUSD
The immediate focus will be on the 1-hour support level at $3991.8. A decisive breach below this could quickly lead to the bearish targets. Conversely, a strong hold here might initiate a short-term bounce, testing the 1H resistance at $4019.21. Traders should also monitor the DXY's trajectory; any sign of weakness in the dollar could provide a reprieve for silver. Similarly, the performance of the S&P 500 will be a key barometer for risk appetite. Significant volatility in equity markets could spill over into commodities. Finally, upcoming economic data releases, particularly those influencing inflation expectations or Fed policy, will be critical in shaping the narrative for silver in the coming days. Any indication of persistent inflation or a shift in central bank hawkishness could further pressure XAGUSD.
Frequently Asked Questions: XAGUSD Analysis
What happens if XAGUSD breaks below the $3991.8 support level?
If XAGUSD closes below the 1H support at $3991.8, it triggers a bearish scenario with a 65% probability. The immediate downside target would be the 4H support at $3973.82, potentially extending towards $3955.54.
Should I consider buying XAGUSD at current levels around $56.16 given the RSI is at 37.11?
Buying at $56.16 is risky given the prevailing bearish trend and negative momentum across multiple timeframes. While RSI is approaching oversold territory on the daily chart, the immediate technicals suggest further downside. Wait for a clear bullish signal, such as a break above $4019.21, or a confirmed bounce from a lower support level before considering buys.
Is the MACD showing negative momentum a strong sell signal for XAGUSD at $56.16?
The negative MACD momentum on the 1H and 4H charts, combined with other bearish indicators, strongly supports the prevailing downtrend. While not a standalone signal, it contributes significantly to the overall bearish sentiment and increases the probability of further price declines.
How will the DXY's strength at 100.7 affect XAGUSD's price action this week?
A DXY at 100.7, showing upward momentum, typically exerts downward pressure on dollar-denominated commodities like XAGUSD. This correlation suggests that continued strength in the dollar could exacerbate silver's current decline, making it harder for bulls to gain traction.
Technical Outlook Summary
| Indicator | Value | Signal | Interpretation |
|---|---|---|---|
| RSI (14) | 37.11 | Neutral | Leaning bearish on 1H/4H, approaching oversold on 1D |
| MACD Histogram | -15.20 | Bearish | Negative momentum on 1H & 4H |
| Stochastic | 43.73 / 25.17 | Bullish Signal (1H) | %K > %D on 1H, but bearish on 4H/1D |
| ADX | 35.29 | Strong Trend | Indicates a strong downward trend on 1H |
| Bollinger Bands | Middle Band Break | Bearish | Price below middle band on all timeframes |
Key Levels
Track markets in real-time
AI-powered analysis, technical indicators and real-time price data.
Join Our Telegram Channel
Breaking market news, AI analysis and trading signals instantly.
Join Channel