

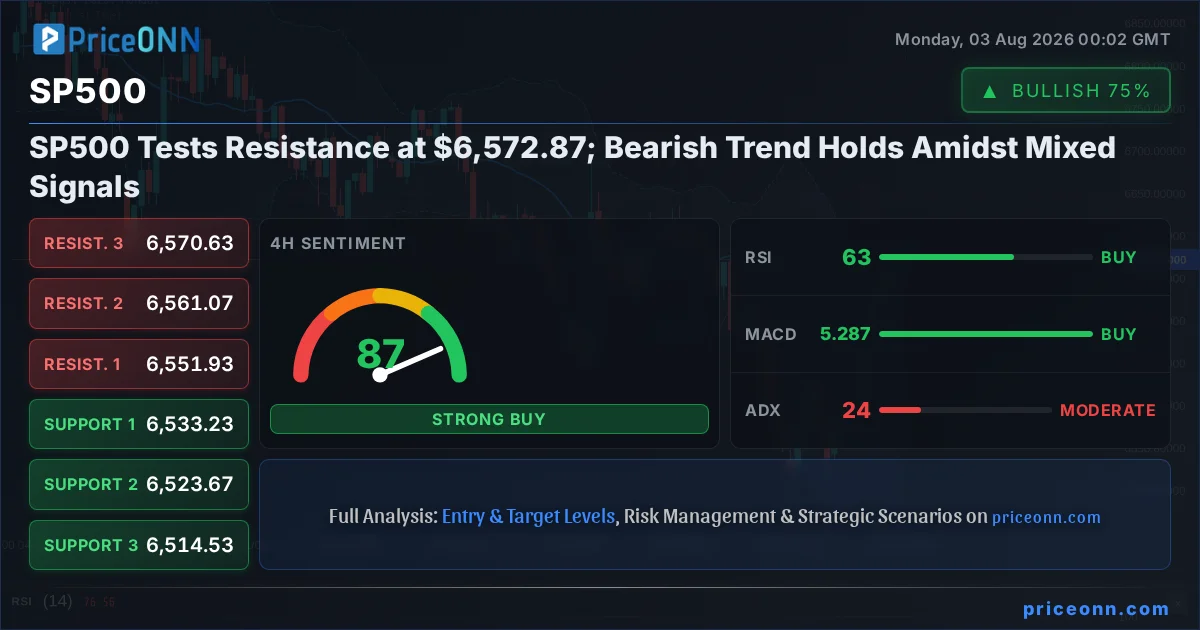
The S&P 500 (SP500) is currently navigating a critical juncture, trading at $6,572.87, as the market grapples with conflicting technical signals and a persistent bearish undertone. While the index shows resilience, attempting to push past key resistance levels, the underlying trend strength across multiple timeframes suggests caution is warranted. This analysis delves into the intricate dance of indicators, price action, and broader market correlations to decipher the most probable path forward for the SP500 in the coming days and weeks.
- RSI at 62.83 on the 4H chart signals continued bullish momentum, but the daily RSI at 45.35 indicates underlying weakness.
- Critical support for the SP500 sits at $6,533.23, tested multiple times this week, while resistance looms at $6,568.73 on the 1H chart.
- MACD histogram shows positive momentum on the 4H chart, but the daily MACD remains negative, suggesting conflicting directional biases.
- The DXY's strength at 100.70 exerts pressure on risk assets like the SP500, highlighting a key correlation to monitor.
The battleground for the SP500 is currently defined by the $6,568.73 resistance on the 1-hour timeframe, a level that has acted as a ceiling for intraday advances. A decisive breach above this point is crucial for bulls to regain control, potentially targeting the next resistance at $6,577.27. However, the daily chart paints a more somber picture. With an RSI reading of 45.35 and a negative MACD momentum, the longer-term trend appears to be favoring sellers. This divergence between short-term optimism and long-term caution creates a complex trading environment, demanding a nuanced approach.
On the 1-hour chart, the trend is firmly bullish with a strength of 100%, supported by an RSI of 70.95, which, while indicating strong upward momentum, also flirts with overbought territory. This suggests that any immediate push higher could be met with profit-taking. The MACD, however, is showing negative momentum on this timeframe, a stark contrast to the RSI. This conflicting signal highlights the choppiness of the intraday market. The ADX at 49.72 reinforces the idea of a strong trend, but its directionality in confluence with conflicting oscillators leaves room for interpretation. The immediate support at $6,547.63 is key; a break below this could signal a short-term reversal.
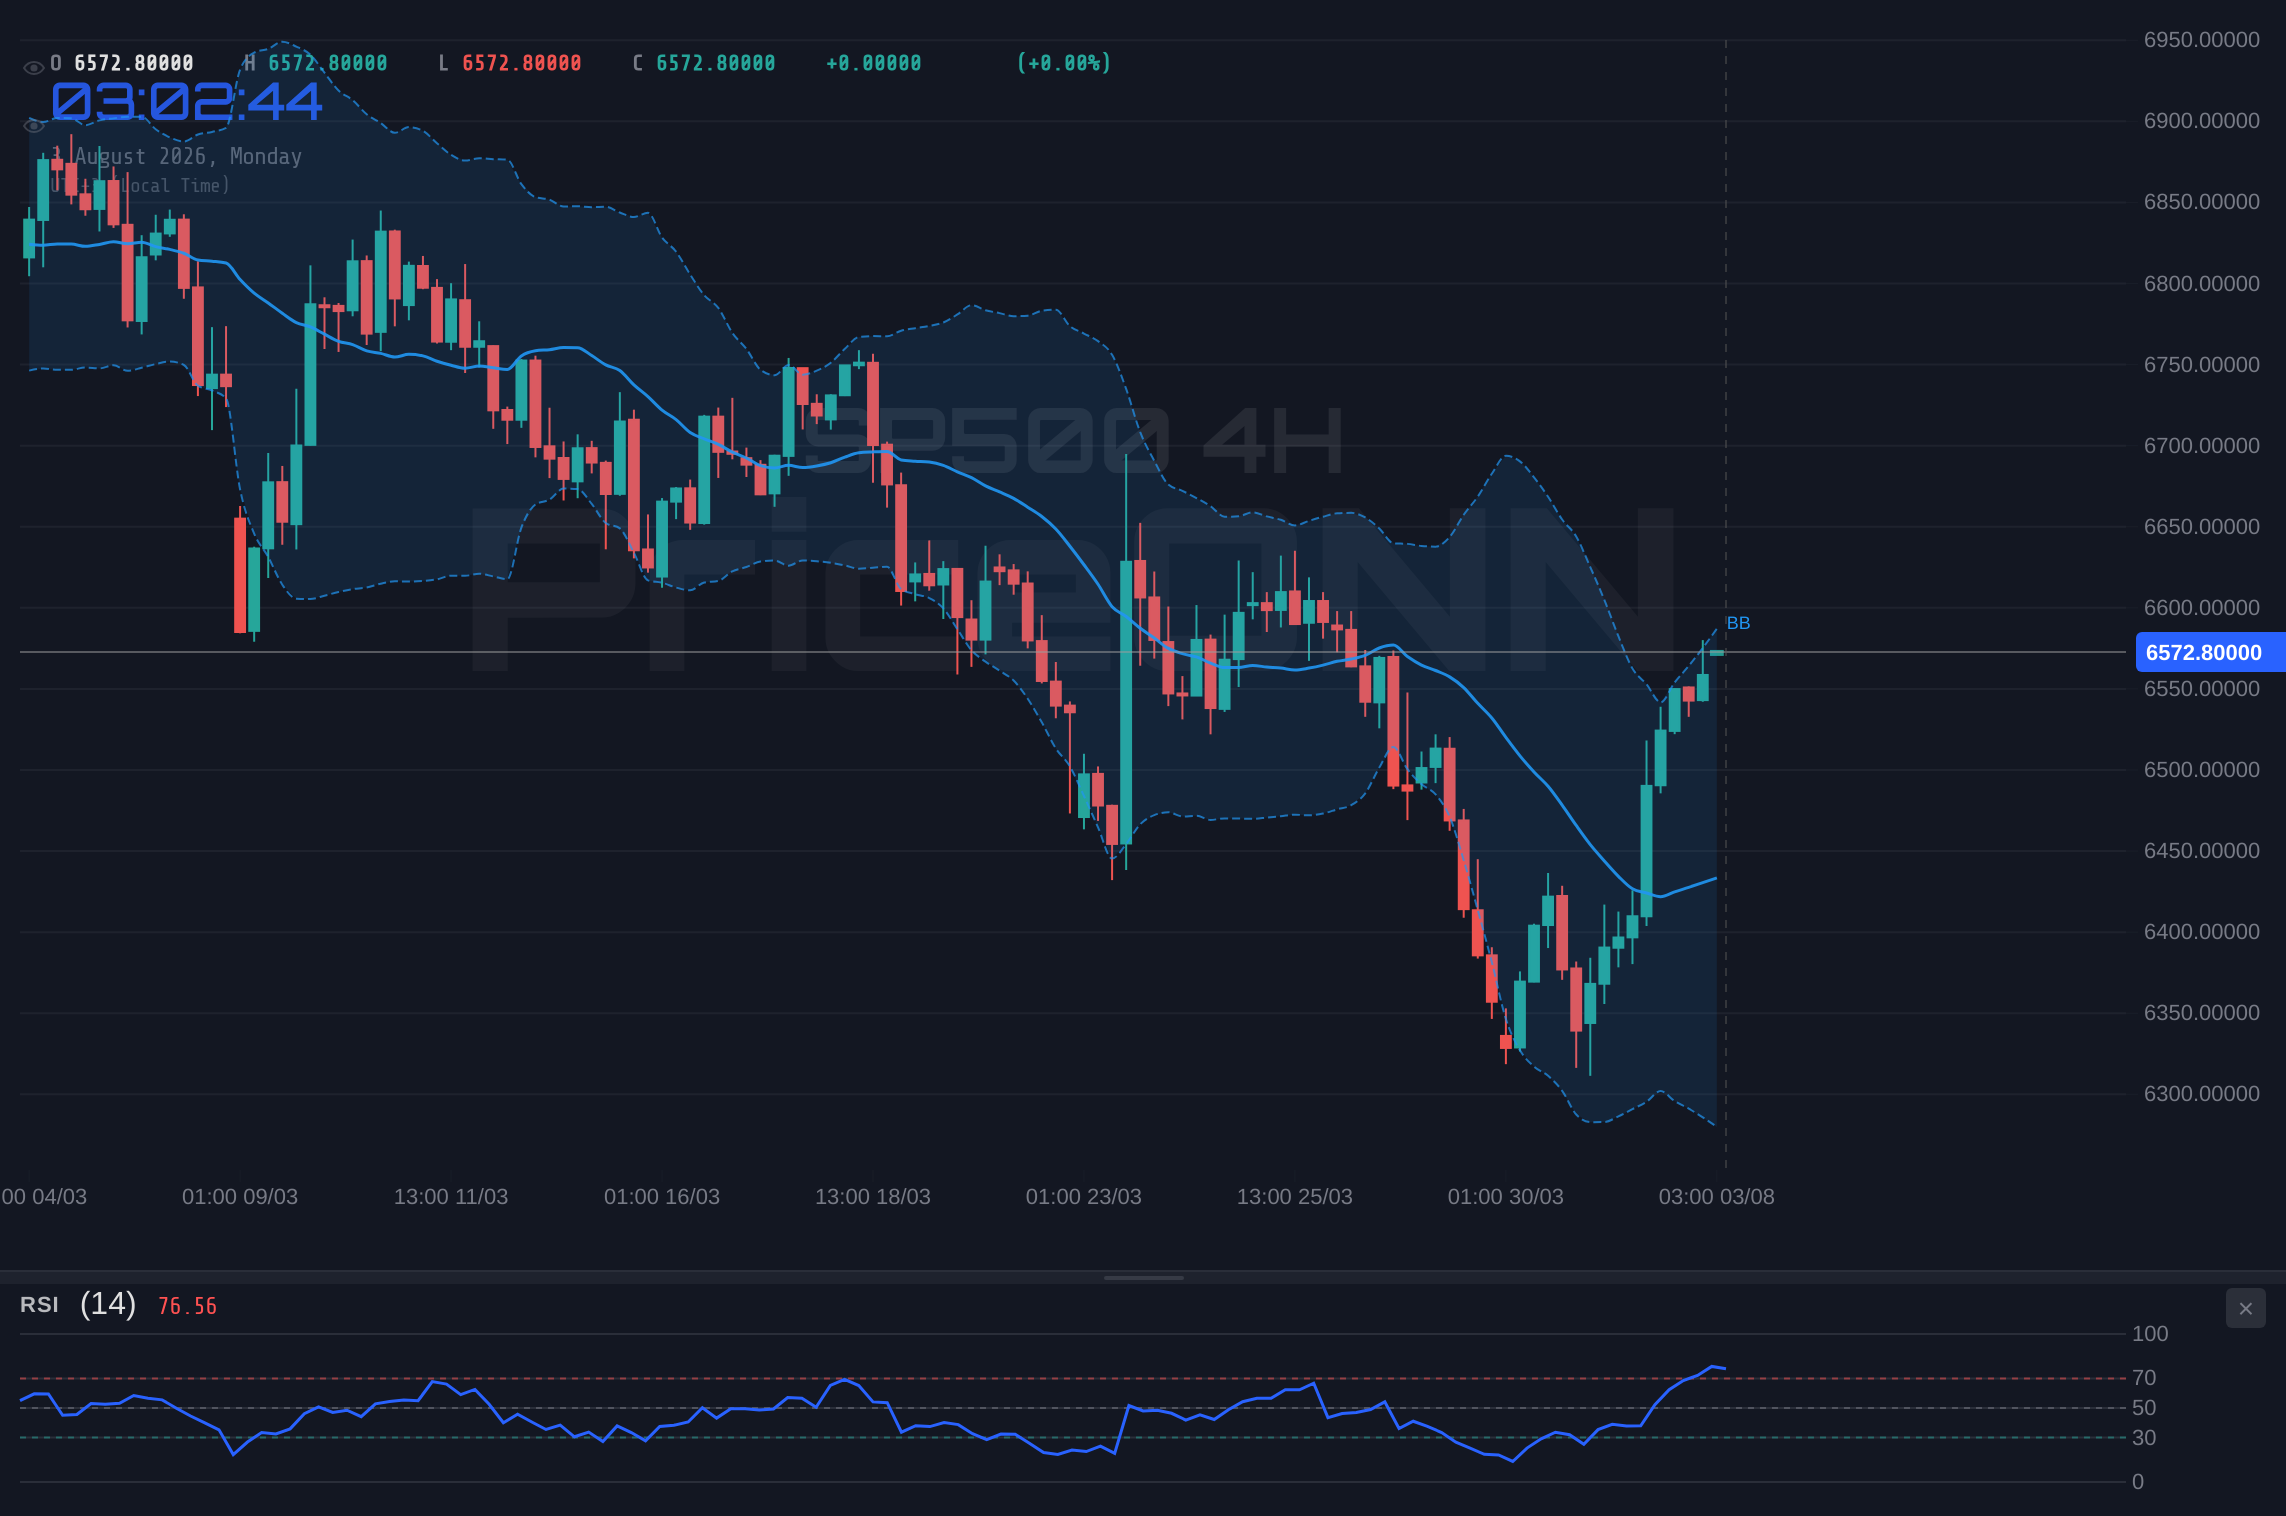
Zooming out to the 4-hour timeframe, the picture becomes more balanced. The trend is neutral with a strength of 50%, reflecting the indecision in the market. The RSI at 62.83 is in a healthy bullish zone, suggesting room for further upside, while the MACD is positive, aligning with the bullish sentiment. However, the Stochastic indicator is showing K=97.85 and D=86.96, deep in overbought territory and showing a bearish crossover signal. This suggests that the upward momentum might be exhausted in the medium term. The ADX at 24.23 indicates a moderate trend strength, not yet a runaway bull market, but certainly not a flat consolidation either. Support at $6,533.23 and resistance at $6,551.93 define the immediate trading range on this chart.
The daily chart, however, presents the most significant challenge to a bullish outlook. The trend is decisively bearish with 100% strength. The RSI stands at 45.35, firmly in neutral territory but trending downwards, suggesting sellers are gaining ground. The MACD is negative and below its signal line, confirming bearish momentum. The Bollinger Bands are also showing the price trading below the middle band, indicating a bearish bias. The Stochastic indicator, with K=42.97 and D=29.88, shows a bullish crossover, but this is occurring from oversold levels and in the context of a strong bearish trend, making its reliability questionable. The ADX at 47.51 confirms a strong existing trend, which, given the other indicators, is likely bearish.
The correlation with the US Dollar Index (DXY) is a crucial element in understanding the SP500's movements. With the DXY currently at 100.70 and showing a bullish trend on the 1-hour chart, it exerts downward pressure on risk assets like the SP500. A stronger dollar typically makes US exports more expensive and can signal a shift towards safer assets, impacting equity markets negatively. The DXY's upward trajectory on the 1H chart, despite a bearish outlook on the 4H, adds another layer of complexity, suggesting that short-term dollar strength might be a temporary headwind for the SP500.
Broader market sentiment, as indicated by the Nasdaq 100 and Dow Jones 30, also provides context. The Nasdaq 100 is experiencing a bearish trend on multiple timeframes, with its current price at 29,164.86 reflecting a significant daily drop. This tech-heavy index often leads the broader market, and its weakness suggests that speculative appetite might be waning. Conversely, the Dow Jones 30 shows a predominantly bullish trend, trading at 52,748.53. This divergence between the Nasdaq and the Dow could signify a rotation within the market, with value-oriented sectors potentially outperforming growth sectors, or it could simply be noise before a clearer directional move.
Geopolitical factors, though not explicitly detailed in the provided data, always play a background role. Recent news regarding trade tensions, such as Trump's trade threat impacting Spain's energy security, and the ongoing complexities in oil markets due to Middle East turmoil, can contribute to broader market uncertainty. While the SP500's direct correlation might be muted, a general increase in global risk aversion often leads investors to pare back exposure to equities. The recent fall in gold prices, despite oil's volatility, is also an interesting signal, suggesting that safe-haven demand might not be as strong as anticipated, or that profit-taking is overriding flight-to-safety instincts.
Looking at the energy markets, Brent crude is trading at $83.79 with a mixed outlook, while WTI is at $79.59, also showing conflicting signals across timeframes. Oil prices are a key indicator for inflation expectations. Persistent strength in oil prices could fuel inflation concerns, potentially leading to a more hawkish stance from central banks like the Federal Reserve. This, in turn, could dampen the outlook for equities by increasing borrowing costs and reducing corporate profit margins. The current mixed signals in oil suggest that inflation pressures are not yet a dominant narrative driving market-wide sell-offs.
Considering the technical dashboard, the signals are indeed mixed, reflecting the market's indecision. The 1-hour chart leans towards a buy signal (Al: 5, Sat: 3, Nötr: 0), driven by the RSI and Stochastic crossover. The 4-hour chart also leans buy (Al: 6, Sat: 2, Nötr: 0), with a bullish RSI and MACD. However, the daily chart leans sell (Al: 2, Sat: 5, Nötr: 0), with a bearish RSI, MACD, and ADX. This daily bearish trend strength (95%) is a significant factor that cannot be ignored, suggesting that any short-term rallies might be opportunities for sellers to enter the market at better prices.
The interplay between these indicators and timeframes presents a scenario where short-term traders might find opportunities in intraday swings, while longer-term investors should remain cautious. The ADX values are particularly noteworthy: strong on the daily (47.51) and 1-hour (49.72) charts, but moderate on the 4-hour (24.23). This suggests that while a strong trend exists, its conviction wavers across different analytical perspectives. The key will be to observe how the SP500 reacts at the immediate support and resistance levels, and whether the daily bearish trend continues to assert its dominance.
The crucial support level to watch is $6,533.23 on the 4-hour chart. A failure to hold this level would likely trigger further selling pressure, potentially targeting the next support at $6,523.67. On the upside, breaking decisively above the 1-hour resistance at $6,568.73, and more importantly, clearing the psychological $6,600 level, would be necessary to invalidate the immediate bearish outlook. The confluence of indicators suggests that we are in a period of consolidation before the next significant move, but the underlying daily trend hints that the path of least resistance might still be to the downside.
The upcoming economic calendar will be critical in shaping the SP500's direction. Any significant data releases related to inflation, employment, or central bank policy shifts could act as catalysts. For instance, if upcoming employment data shows further stabilization, as suggested for Canada's labor market, it might embolden the Fed to maintain a hawkish stance, potentially pressuring the SP500. Conversely, signs of economic overheating could also lead to similar outcomes. Investors will be scrutinizing every piece of data for clues on the future path of monetary policy.
Given the current technical picture, the most likely scenario involves a period of consolidation followed by a test of lower levels. The bearish trend on the daily chart, coupled with conflicting signals on shorter timeframes and the pressure from a strengthening dollar, creates a challenging environment for bulls. While intraday rallies are possible, the probability of a sustained upward move appears lower without a significant shift in the underlying technicals or macro-economic drivers. Traders should remain vigilant, manage risk meticulously, and wait for clearer directional signals.
The Bull's Roadmap: Navigating Towards Higher Ground
For the bulls to seize control, a clear and decisive break above immediate resistance is paramount. The primary trigger for a bullish scenario would be a sustained close above the 1-hour resistance at $6,568.73, followed by a decisive push above the $6,600 psychological level. This would signal that short-term selling pressure has been absorbed and that buyers are stepping in with conviction. Confirmation would come from an RSI holding above 70 on the 1-hour chart and a positive MACD crossover on the daily chart, invalidating the current bearish momentum. The invalidation point for this bullish thesis would be a decisive close below the 4-hour support at $6,533.23. If this bullish scenario plays out, the first target would be the 4-hour resistance at $6,551.93, followed by a more ambitious target of the 1-day resistance at $6,605.07. The timeframe for this scenario is primarily intraday to mid-week, contingent on immediate price action and any positive macro catalysts.
Where Bears Take Control: The Downside Path
The bearish scenario remains the more probable path, given the daily trend strength. The primary trigger for this scenario is a break below the crucial 4-hour support level at $6,533.23. This would indicate that the recent attempts to hold the line have failed, and sellers are actively pushing the price lower. Confirmation would come from the daily RSI falling below 40 and the MACD histogram extending its negative momentum. The invalidation for this bearish thesis would be a strong close above the 1-hour resistance at $6,577.27, suggesting a significant shift in market sentiment. If the bearish scenario unfolds, the first target would be the 4-hour support at $6,523.67, with a secondary target at the daily support level of $6,377.47. This scenario could play out over the next 1-2 weeks, depending on economic data and geopolitical developments.
The Waiting Game: Consolidation and Range-Bound Action
A neutral scenario suggests that the SP500 will remain range-bound between the immediate support and resistance levels, indicating market indecision and a lack of strong directional conviction. The trigger for this scenario would be the price action consolidating between the 1-hour support at $6,547.63 and resistance at $6,568.73 for an extended period, perhaps 2-3 trading days. The invalidation for this neutral phase would be a decisive break outside of this defined range in either direction. During this consolidation, traders might look for short-term opportunities within the range, buying near support and selling near resistance. The targets in this scenario would be limited to the boundaries of the established range, with no significant upside or downside continuation expected until a breakout occurs. This phase could last until a significant economic event or a shift in market sentiment forces a resolution.
Bearish Scenario: The Daily Trend Persists
65% ProbabilityBullish Scenario: Breaking the Ceiling
20% ProbabilityNeutral Scenario: The Waiting Game
15% ProbabilityThis week, the primary focus will be on how the SP500 reacts to the key intraday resistance at $6,568.73 and the more significant psychological level around $6,600. A failure to break these levels, especially with the daily bearish trend in play, could lead to a retest of the $6,533.23 support. Traders should also keep a close eye on the DXY's movement at 100.70; any sustained move higher could add pressure. Finally, any significant economic data releases that could influence Fed policy expectations will be a key catalyst to monitor.
| Indicator | Value | Signal | Interpretation |
|---|---|---|---|
| RSI (14) 1H | 70.95 | Overbought Pressure | Potential for pullback |
| RSI (14) 4H | 62.83 | Bullish Momentum | Room for upside |
| RSI (14) 1D | 45.35 | Bearish Trend | Underlying weakness |
| MACD 1H | Positive | Bullish Momentum | Short-term strength |
| MACD 4H | Positive | Bullish Momentum | Aligns with RSI |
| MACD 1D | Negative | Bearish Momentum | Long-term caution |
| ADX 1H | 49.72 | Strong Trend | High conviction |
| ADX 4H | 24.23 | Moderate Trend | Trend strength building |
| ADX 1D | 47.51 | Strong Trend | Confirms bearish bias |
| Stochastic 1H | K=65.73, D=73.5 | Bearish Crossover | Potential pullback imminent |
| Stochastic 4H | K=97.85, D=86.96 | Extreme Overbought | Pullback likely soon |
| Stochastic 1D | K=42.97, D=29.88 | Bullish Crossover | Weak signal in downtrend |
Frequently Asked Questions: SP500 Analysis
What happens if SP500 breaks below the 4H support at $6,533.23?
A break below $6,533.23 on the 4-hour chart would invalidate the immediate bullish attempts and likely trigger further selling pressure. This would confirm the bearish trend seen on the daily chart, with the next target being the $6,523.67 support level.
Is the RSI at 70.95 on the 1H chart a sell signal for SP500 right now?
An RSI of 70.95 on the 1-hour chart indicates overbought conditions and suggests potential for a short-term pullback or consolidation. However, in a strong intraday uptrend, RSI can remain elevated for some time. Confirmation from other indicators like MACD or price action failing to break higher would be needed for a definitive sell signal.
How will the DXY's strength at 100.70 affect the SP500 this week?
The DXY at 100.70, showing bullish momentum on the 1-hour chart, typically exerts downward pressure on risk assets like the SP500. This inverse correlation suggests that a continued rise in the dollar could hinder any upside attempts in the stock market, potentially reinforcing the bearish outlook.
Should I buy SP500 at current levels of $6,572.87 given the mixed signals?
Buying at current levels of $6,572.87 is risky due to the conflicting signals and the dominant bearish trend on the daily chart. A more prudent approach would be to wait for a clear break above the $6,577.27 resistance with confirmation, or a confirmed test and hold of the $6,533.23 support before considering entry points.
Track markets in real-time
AI-powered analysis, technical indicators and real-time price data.
Join Our Telegram Channel
Breaking market news, AI analysis and trading signals instantly.
Join Channel