

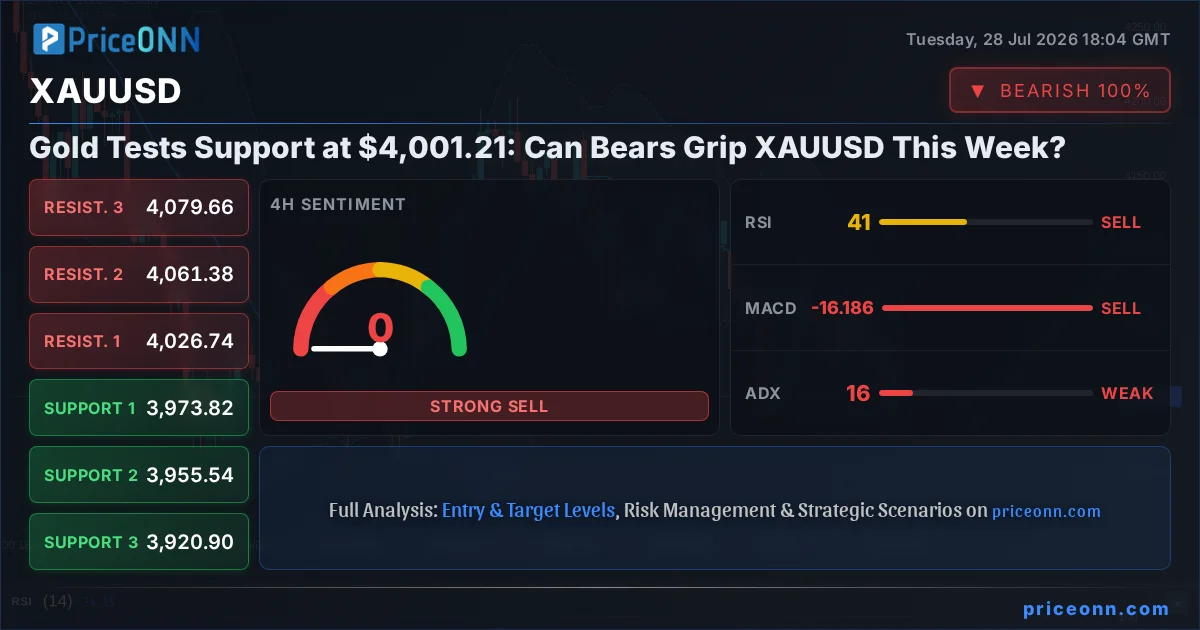
Gold is currently facing significant headwinds, trading at $4,001.21 and showing a clear bearish tilt across multiple timeframes. The precious metal has shed -1.46% today, reflecting a broader risk-off sentiment possibly amplified by a strengthening Dollar Index (DXY) which is hovering around 100.70. This confluence of factors suggests that the recent upward momentum in gold may be faltering, with key support levels now under scrutiny. The question on many traders' minds is whether the bearish sentiment will intensify, pushing XAUUSD lower, or if this is merely a consolidation phase before the next move. This analysis delves into the intricate technical and fundamental factors shaping gold's trajectory.
- RSI at 37.81 on the 1H chart signals a bearish lean, suggesting further downside potential.
- Critical support for XAUUSD is identified at $3,991.80, a level that needs to hold to prevent a deeper sell-off.
- The ADX reading of 20.26 on the 1H chart indicates a moderate downtrend is in play, adding to bearish conviction.
- The strengthening DXY at 100.70 is correlated with gold's decline, highlighting the impact of US dollar strength on precious metals.
The narrative surrounding gold has shifted dramatically. After a period of relative stability, the precious metal is now exhibiting signs of weakness, underscored by its current price of $4,001.21. This decline isn't occurring in a vacuum; it's happening amidst a complex interplay of global economic indicators and geopolitical undercurrents. The Dollar Index (DXY), a key barometer of USD strength against a basket of major currencies, has seen a notable uptick, currently trading around 100.70. Historically, a stronger dollar tends to exert downward pressure on gold, as it becomes more expensive for holders of other currencies. This inverse correlation is a critical piece of the puzzle for anyone trying to decipher gold's next move. The fact that gold is retreating while the dollar firms up is a classic sign that risk aversion might be creeping back into market sentiment, a scenario that often favors safe-haven assets, but can also lead to broader asset liquidations.
Examining the 1-hour timeframe for XAUUSD reveals a market in a precarious position. The trend is currently described as neutral, with a trend strength of 50%, but the technical indicators paint a decidedly cautious picture. The RSI(14) sits at 37.81, firmly in neutral territory but with a downward trajectory, suggesting that sellers are gaining a slight upper hand. More concerning for bulls is the MACD, which is exhibiting negative momentum with the MACD line below its signal line. This typically indicates that bearish pressure is building. The Bollinger Bands also reinforce this view, with the price trading below the middle band, hinting at a bearish inclination. While the Stochastic oscillator shows a slight recovery signal (%K > %D), this is occurring from low levels and might be a fleeting bounce rather than a sustained reversal. The ADX at 20.26 confirms a moderately strong downtrend, suggesting that the bearish conviction is present, even if the trend isn't yet overwhelming. The aggregate signal across this timeframe leans towards 'SELL', a stark contrast to any recent bullish sentiment.
Navigating the Bearish Tide: Key Levels and Indicators
The 4-Hour Chart's Grim Outlook
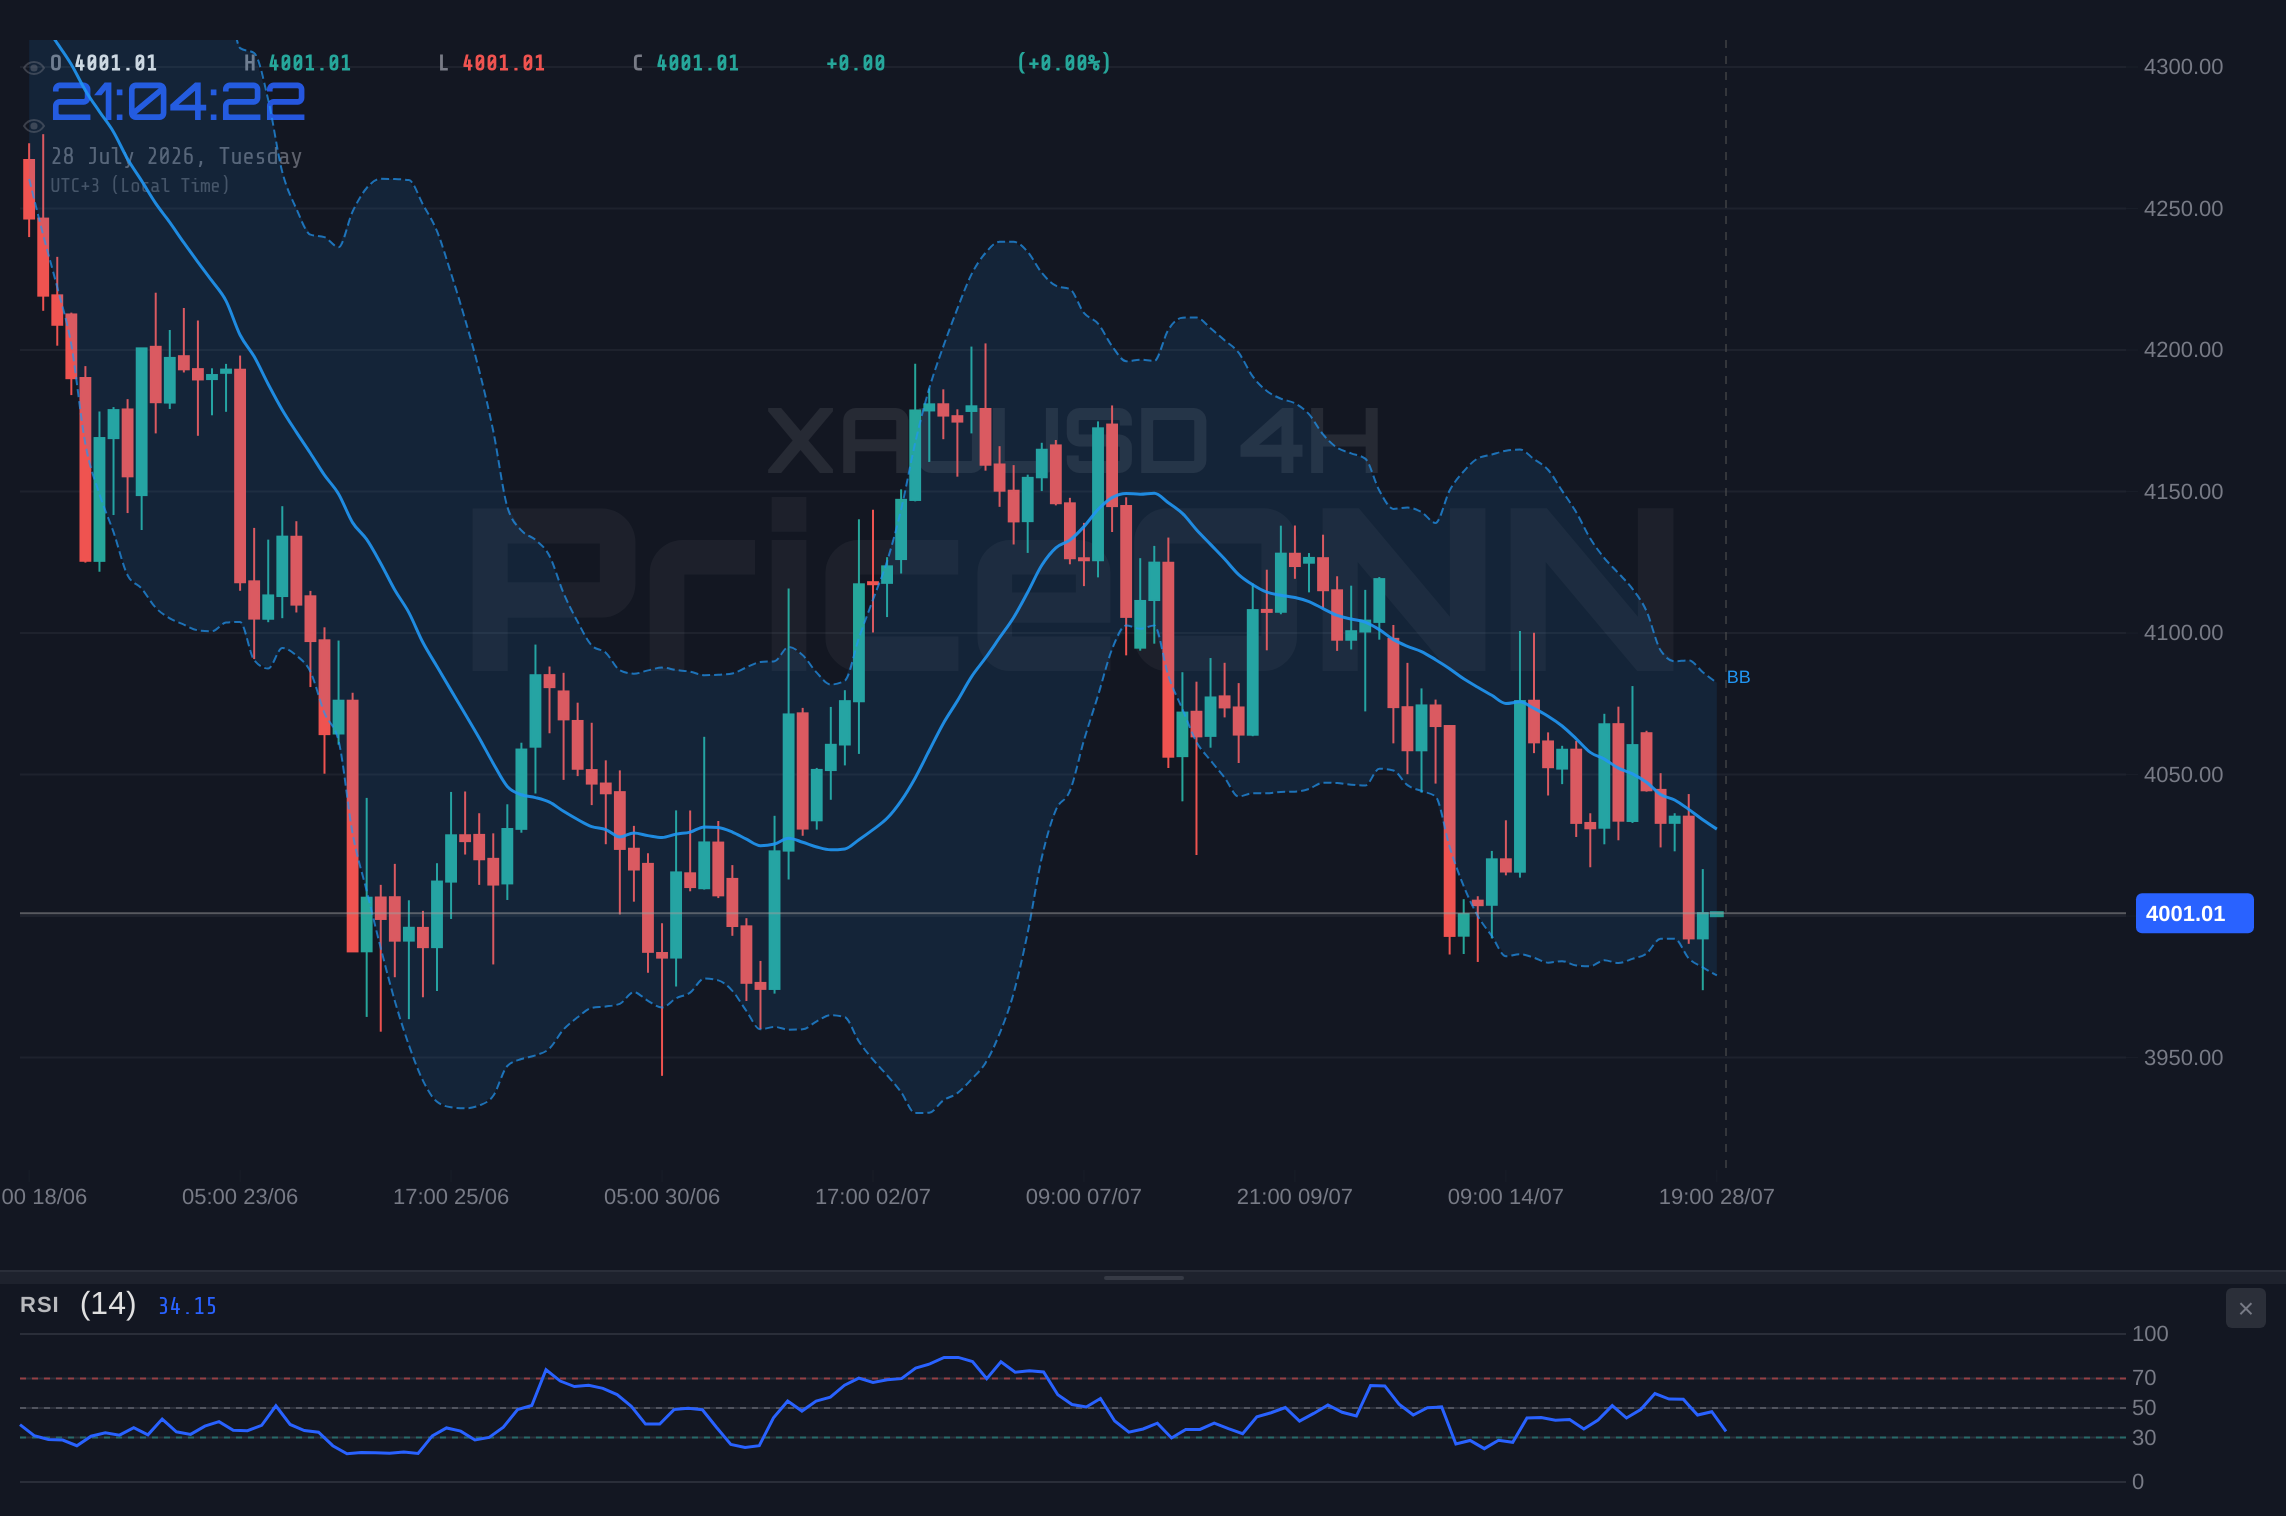
Stepping back to the 4-hour timeframe, the picture for gold becomes even more bearish. The trend is classified as 'Düşüş' (Down) with a significant strength of 83%. This suggests that the prevailing market sentiment is decidedly negative. The immediate support level to watch is S1 at $3,973.82, followed by S2 at $3,955.54. A break below these levels would signal a significant acceleration of the downward move. On the resistance side, R1 at $4026.74 and R2 at $4061.38 are the key areas where selling pressure might intensify if any short-covering rallies occur. The RSI(14) here is at 40.59, still in neutral territory but reinforcing the bearish lean. MACD continues to show negative momentum, and the Bollinger Bands are hugging the lower side of the price action, indicating strong selling pressure. The Stochastic oscillator confirms the bearish outlook with %K 15.79 indicates a weaker trend on this timeframe, suggesting that the market might be consolidating within the larger downtrend, but the overall signal is a strong 'SELL'.
The daily chart, often considered the most significant for long-term trend analysis, paints a concerning picture for gold bulls. The trend is firmly established as 'Düşüş' (Down), with an impressive strength of 95%. This signifies a dominant downward force in the market. The primary support level to monitor is $4,024.67, which is currently being tested. A decisive break below this level would be a strong bearish signal, potentially opening the door for a move towards $3,988.95. Resistance levels are capped around $4,088.69 (R1) and $4,116.99 (R2). While the RSI(14) at 38.86 is in neutral territory, the fact that it's trending downwards from higher levels suggests that the selling pressure is not yet exhausted. Interestingly, the MACD on the daily chart shows positive momentum with the MACD line above its signal line, which might appear contradictory to the overall bearish trend. However, this can sometimes indicate a divergence, where price is falling but momentum is trying to shift, or it could be a lagging indicator in a strong downtrend. The Bollinger Bands remain below the middle band, supporting the bearish narrative. The Stochastic oscillator is giving a bearish signal (%K 39.16 signifies a strong, established downtrend. The aggregate signal for the daily timeframe is 'SAT' (Sell), aligning with the shorter timeframes and confirming the bearish bias.
The Intermarket Dance: DXY, Equities, and Gold
Understanding gold's price action requires a keen eye on its correlations with other major markets. The Dollar Index (DXY) is perhaps the most significant counterpart. As observed, the DXY is currently trading around 100.70, showing strength. This uptick in the dollar is a major headwind for gold, as evidenced by gold's current retreat from higher levels. A stronger dollar makes gold, priced in dollars, more expensive for international buyers, thus dampening demand. This inverse relationship is clearly playing out, with the DXY's upward move correlating with XAUUSD's decline. Furthermore, the performance of major equity indices like the S&P 500 (currently +0.74% at 6,572.87) and the Nasdaq 100 (currently -1.16% at 29,164.86) provides context on market risk appetite. The Nasdaq's significant drop suggests a risk-off sentiment might be taking hold in the tech sector, which could spill over into other asset classes. In such an environment, investors might rotate out of riskier assets and into perceived safe havens. However, gold's current weakness despite the Nasdaq's fall is puzzling and suggests that either the dollar strength is the dominant factor, or there are specific bearish catalysts affecting gold itself, such as potential decreases in inflation expectations or shifts in central bank policy that reduce gold's appeal as an inflation hedge.
The geopolitical landscape also plays a crucial role, often acting as a catalyst for safe-haven demand. While recent news suggested eased Middle East tensions, potentially lowering oil prices (Brent crude is down -0.83% at $83.79), this hasn't translated into renewed strength for gold. Typically, a de-escalation of geopolitical risks would reduce demand for gold as a safe haven. However, the market's reaction can be complex. If the de-escalation is perceived as temporary, or if other global risks remain elevated, gold might still find support. Conversely, if the primary driver of gold's recent weakness is indeed dollar strength and shifting central bank expectations, then geopolitical factors might take a backseat. The recent news highlighting potential Fed hawkishness, as indicated by ECB's Kazimir suggesting more rate hikes, could be a significant factor influencing both dollar strength and investor sentiment towards gold. A scenario where central banks remain aggressive on inflation could reduce the appeal of non-yielding assets like gold, especially if real yields start to climb.
The Trade Plan: Watching for Confirmation
A Neutral Stance Amidst Uncertainty
The current technical setup for XAUUSD presents a challenging environment for traders. The mixed signals across different timeframes and indicators, coupled with the dominant bearish sentiment on the daily and 4-hour charts, creates a situation that is best described as a 'WATCH_ZONE'. The ADX readings across the board (20.26 on 1H, 15.79 on 4H, 39.16 on 1D) highlight this choppiness. While the daily ADX suggests a strong trend, the lower timeframes indicate a lack of commitment or consolidation. This means that a clear directional trade is currently risky. The market is in a state of flux, and forcing a position without clear confirmation could lead to suboptimal entries or outright losses. Patience is paramount here. The key is to identify the conditions that would validate a directional move, rather than anticipating it.
Conditions for a Bullish Reversal
For a bullish scenario to gain traction, several conditions would need to be met. Firstly, XAUUSD would need to decisively break and hold above the immediate resistance level of $4,019.21 on the 1-hour chart. Following this, a sustained move above the $4,026.74 resistance on the 4-hour chart would be crucial. Confirmation would ideally come from a shift in sentiment on the daily chart, with the RSI moving back above 50 and the MACD showing a bullish crossover. The DXY would also likely need to show signs of weakness, perhaps falling back below 100.50, to alleviate the pressure on gold. A break above $4,046.62 would then target higher levels, potentially retesting the $4,088.69 area. However, given the current dominant bearish signals, this scenario appears less probable in the short term.
The Bearish Case: What to Watch For
The path of least resistance for XAUUSD currently appears to be downwards. The primary bearish trigger would be a failure to hold the $3,991.80 support level on the 1-hour chart. A close below this level would likely lead to a rapid test of the $3,976.78 support. If the selling pressure intensifies, breaking below the $3,973.82 level on the 4-hour chart would confirm a deeper downtrend, potentially targeting the $3,964.39 level. Confirmation would be reinforced by continued dollar strength and any negative geopolitical news or central bank commentary that reduces inflation expectations or signals further tightening. The invalidation of this bearish view would occur if gold decisively breaks above the $4,019.21 resistance and sustains the move, indicating that the support levels have held firm and buyers are returning. Until such a confirmation, the risk remains skewed to the downside.
The Road Ahead: Uncertainty and Opportunity
The current market environment for gold is characterized by significant uncertainty, primarily driven by the tug-of-war between dollar strength and the underlying trend. While the daily chart still shows a strong downtrend, the lower timeframes present a more neutral to slightly bearish picture, with mixed signals from indicators like the MACD and Stochastic. This suggests that the market is at a critical juncture. Traders should remain vigilant, focusing on the key support level at $3,991.80 and the resistance at $4,019.21. A decisive break above resistance, confirmed by broader market sentiment shifts and dollar weakness, could signal a bullish reversal. Conversely, a breakdown below support, especially if accompanied by increasing DXY and negative geopolitical news, would likely confirm the continuation of the bearish trend. The ADX readings indicate that while a trend exists, its strength varies significantly across timeframes, underscoring the need for patience and clear confirmation before committing to a trade.
Looking at the broader macroeconomic picture, the persistent inflation concerns and the corresponding hawkish stance from central banks globally, as hinted by comments from ECB's Kazimir, continue to be a significant factor. If inflation proves to be stickier than anticipated, central banks might be forced to maintain higher interest rates for longer. This environment generally favors a stronger dollar and can put pressure on non-yielding assets like gold. However, gold also acts as a hedge against unexpected economic downturns or geopolitical shocks. Therefore, any flare-up in global tensions could quickly shift sentiment back in favor of gold. The interplay between inflation, central bank policy, and geopolitical risk will be crucial in determining gold's direction in the coming weeks. For now, the technicals suggest caution, with the immediate focus on whether $3,991.80 can hold.
Given the conflicting signals between daily and intraday timeframes, scalpers and short-term traders might look for opportunities around the $3,991.80 support and $4,019.21 resistance. Swing traders, however, should wait for a clearer daily trend confirmation, ideally a close above $4,026.74 or below $3,973.82, to align with the dominant daily trend.
Frequently Asked Questions: XAUUSD Analysis
What happens if XAUUSD breaks below the $3,991.80 support level?
A break below $3,991.80 would likely trigger further selling pressure, potentially leading to tests of $3,976.78 and $3,964.39. This would confirm the bearish sentiment seen on the 4-hour and daily charts.
Should I buy XAUUSD at current levels of $4,001.21 given the mixed signals?
Buying at current levels is not recommended due to the prevailing bearish technicals and potential for further downside. A confirmed bullish setup, such as a close above $4,019.21 with dollar weakness, would be needed to consider a long position.
Is the RSI at 37.81 a sell signal for XAUUSD right now?
An RSI reading of 37.81 on the 1-hour chart indicates bearish momentum but is not yet in oversold territory. It suggests sellers are active and could lead to further price declines if key support levels fail.
How will the DXY strength affect XAUUSD this week?
Continued strength in the DXY, currently around 100.70, is expected to put downward pressure on XAUUSD. A rising dollar typically makes gold more expensive for foreign buyers, potentially limiting demand.
Track markets in real-time
AI-powered analysis, technical indicators and real-time price data.
Join Our Telegram Channel
Breaking market news, AI analysis and trading signals instantly.
Join Channel