

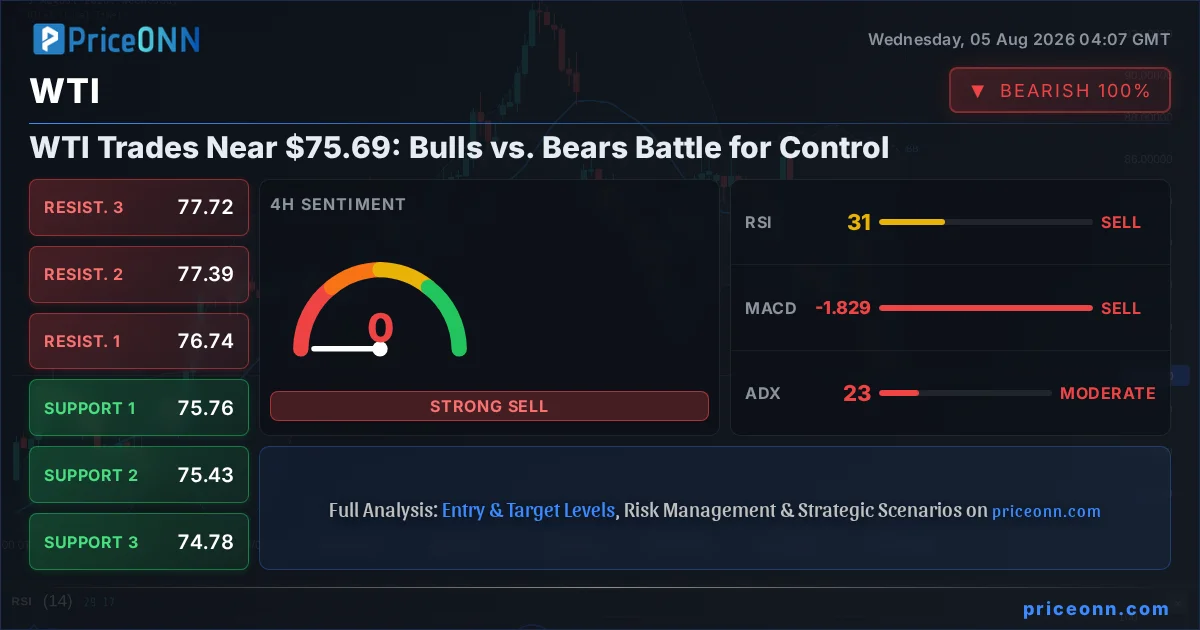
The battle lines are drawn for WTI Crude Oil, currently teetering near the critical $75.69 mark. This isn't just another trading day; it's a pivotal moment where the bulls and bears are locked in a fierce struggle, each side eyeing specific levels to assert dominance. The market sentiment is a tangled web of conflicting signals, with technical indicators flashing mixed messages and the broader macroeconomic backdrop adding layers of complexity. Understanding this tension requires a deep dive into the price action, the underlying fundamentals, and the psychological warfare playing out on the charts. Is this a temporary pause before a renewed leg higher, or are we on the cusp of a significant downturn? This analysis aims to dissect the current technical landscape, weigh the arguments for both sides, and provide a clear roadmap for navigating these choppy waters.
- WTI Crude Oil is trading near $75.69, a crucial juncture for market direction.
- The ADX at 23.45 indicates a moderate trend, suggesting potential for a breakout but lacking strong conviction yet.
- RSI at 32.74 on the 1H chart points to bearish momentum, while the 1D chart shows oversold conditions at 42.5, hinting at potential buying interest.
- Key support is holding at $73.87, while resistance looms around $80.52; a break of either will define the next major move.
- Market sentiment is mixed, influenced by DXY movements and ongoing geopolitical considerations, demanding careful risk management.
The Bullish Case: Testing the Resolve of the Bears
On the bullish side, there are several factors suggesting that WTI could find its footing and potentially climb higher. Firstly, the current price action, while showing some recent weakness, is still holding above the significant support level of $73.87. On the daily chart, the RSI is hovering around 42.5, which, while not in oversold territory, is certainly moving away from extreme bearish readings and could signal the beginning of a shift in momentum. The Stochastic indicator on the 1D timeframe, with K at 4.37 and D at 25.98, is showing a strong upward cross, suggesting that the market is preparing for a potential bounce. This aligns with the overall trend on the 1D timeframe, which, despite recent dips, is still categorized as neutral with a potential for upward movement (Strength: 50%).
Furthermore, looking at the 4-hour chart, the MACD is showing positive momentum with the MACD line above the signal line, which is a classic buy signal. While the ADX at 23.45 on this timeframe suggests a weak trend, this can sometimes precede a significant move as the market consolidates before a breakout. The fact that the price is holding above the 4-hour support levels like $75.43 and $74.78 provides a base for potential upside. The bulls are likely looking to defend these levels aggressively, hoping to build enough buying pressure to challenge the immediate resistance.
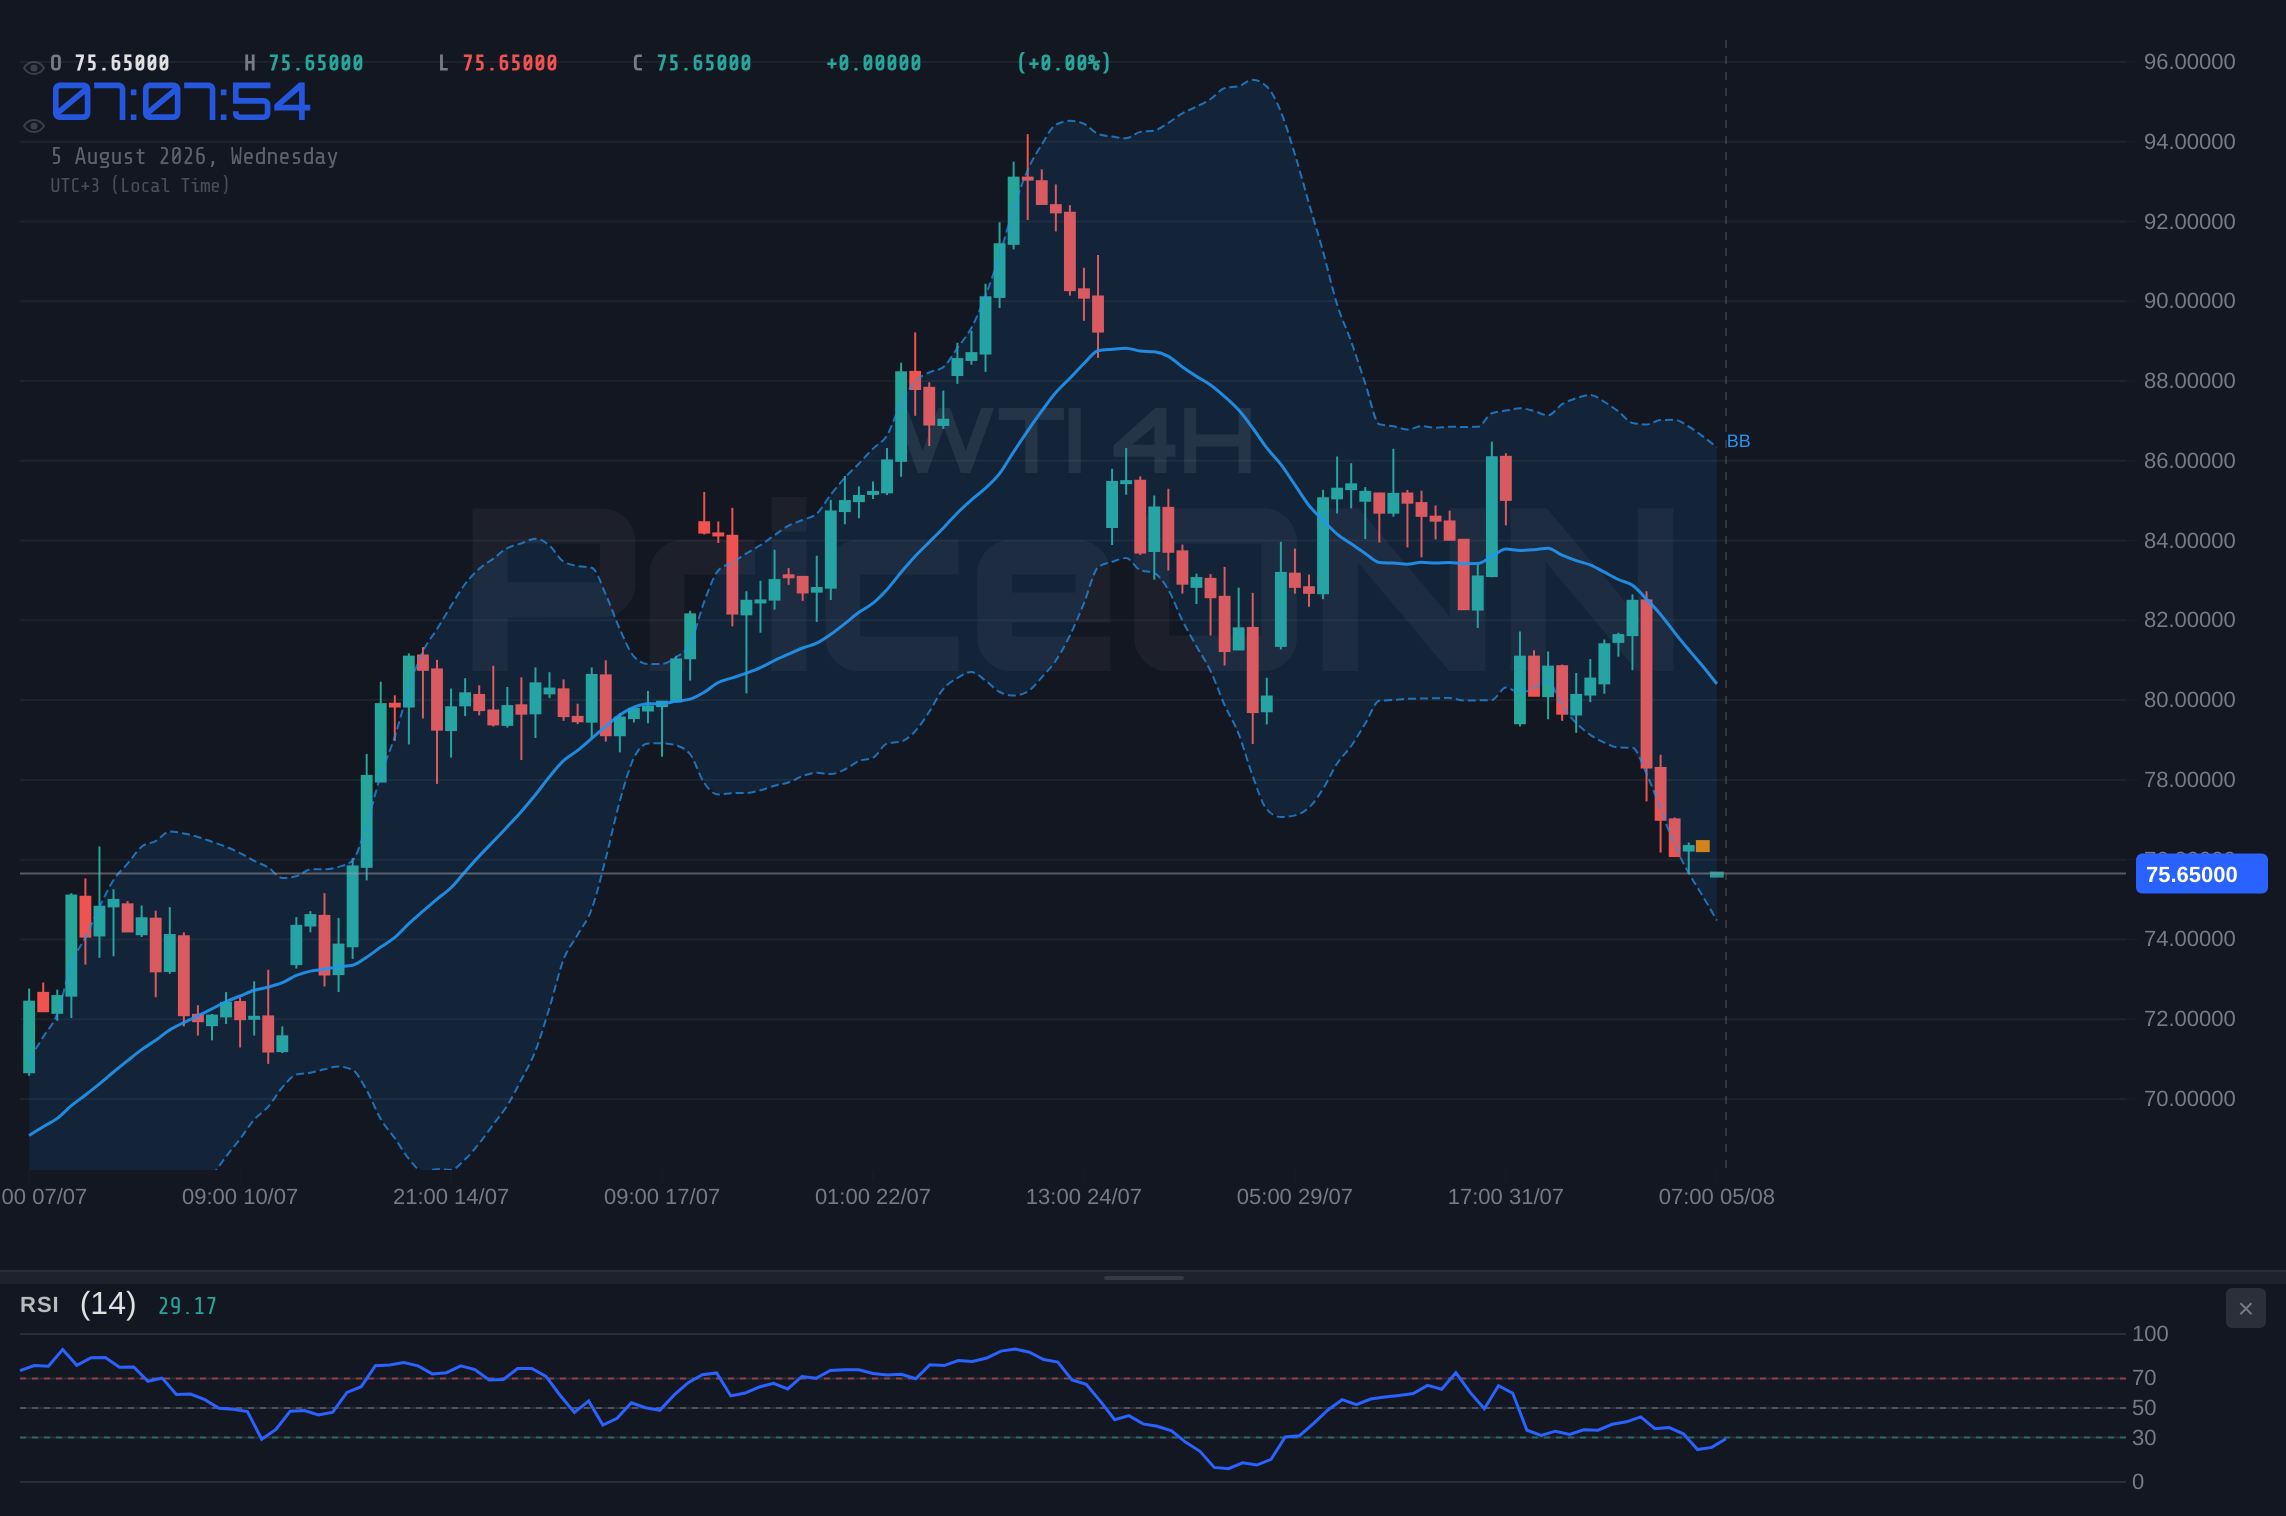
The correlation with broader market sentiment also plays a role. While the DXY (Dollar Index) is currently showing a slightly bearish trend on the 1H and 4H charts (around 99.82), its overall neutral stance on the daily chart means it's not a strong headwind for commodities right now. If the dollar weakens further, it typically provides a tailwind for oil prices. Moreover, the S&P 500 is showing a strong upward trend on the 1H and 4H charts, indicating a generally positive risk appetite in the market. This risk-on sentiment can often translate into increased demand for commodities like oil, as investors feel more confident allocating capital to riskier assets.
The bullish argument hinges on the idea that the current price action represents a healthy consolidation rather than a distribution phase. Traders looking to buy the dip will be watching for confirmation, perhaps a decisive break above the immediate 1-hour resistance at $76.67, followed by a sustained move towards $77.62. The sheer fact that the price is still trading above the $73.87 support, a level that has historically acted as a significant floor, is a testament to the resilience of buyers. They are betting that the underlying demand for energy, coupled with any potential supply-side disruptions or geopolitical jitters, will eventually push prices higher, targeting the more significant resistance levels.
The Bearish Case: Clouds Gathering on the Horizon
However, the picture is far from entirely rosy for the bulls. The bearish case is built on several concerning technical signals and the potential for headwinds to intensify. On the 1-hour chart, the RSI is sitting at a rather bearish 32.74, clearly indicating downward momentum and suggesting that sellers are in control in the short term. The MACD on this timeframe is also firmly in negative territory, with the MACD histogram below the signal line, reinforcing the bearish sentiment. This short-term weakness is a significant red flag for those hoping for an immediate rally.
The ADX on the 1-hour chart is at 40.08, which signifies a strong downward trend. This is a more potent signal than the weak trend indicated on the 4-hour chart. It suggests that the current selling pressure is not just a fleeting moment but part of a more established bearish move. The price is also trading below the middle Bollinger Band on the 1-hour chart, and the Stochastic K line (30.19) is above the D line (18.95), which technically signals a potential upward move, but in the context of the prevailing bearish momentum, this could be a brief correction before further declines.
On the daily timeframe, while the RSI is at 42.5, indicating potential for a bounce, the overall trend strength as measured by ADX is 23.72, which is a moderate trend strength for a downtrend. If we look at the 1D MACD, it's showing negative momentum, reinforcing the idea that the longer-term direction might be downwards. The price is also below the middle Bollinger Band on the daily chart, which typically suggests a bearish bias.
The correlation with the DXY could also turn bearish. If the dollar index, which is showing a neutral to slightly bearish trend on shorter timeframes but a strong downward trend on the 4H (ADX 34), starts to rebound significantly, it would exert downward pressure on WTI. Furthermore, any signs of a significant risk-off sentiment in the broader markets, such as a sharp decline in the S&P 500 or Nasdaq, would likely lead to a flight to safety, reducing demand for riskier commodities like oil. The recent news about WTI Crude Oil trimming losses and the risk of more losses increasing, as reported, also lends credence to the bearish outlook.
The bears are likely positioning themselves for a move towards the next significant support level at $71.65 and potentially even lower towards $67.22 if the selling pressure intensifies. They would be looking for confirmation of the short-term bearish signals, such as a decisive break below the $75.02 support on the 1-hour chart, followed by a failure to hold the $73.87 daily support. Any signs of increased geopolitical tension easing, or positive news regarding global oil supply, could also fuel their conviction.
Weighing the Evidence: Technicals and Macro Factors
When we weigh the technical evidence, a complex picture emerges. The short-term (1H) charts are heavily skewed towards bearish signals, with RSI and MACD clearly indicating downward momentum and a strong downtrend as per the ADX. This suggests that any immediate upward movement might be met with selling pressure, leading to profit-taking or the initiation of new short positions. The bears have a strong case based on the immediate technical setup.
However, the longer-term (1D) charts present a more nuanced view. While the ADX still suggests a moderate downtrend, the RSI is moving away from oversold territory, and the Stochastic is showing a bullish cross. This indicates that while the downtrend has been strong, there might be underlying buying interest emerging at these lower levels. The neutral trend strength on the daily timeframe (ADX 23.72) suggests that the market is in a transitional phase, and the next significant move could establish a clearer direction.
The 4-hour timeframe offers a blend of signals. The ADX is weak (23.45), implying a lack of strong directional conviction, which can be a precursor to a breakout. The MACD shows positive momentum, contradicting the 1-hour bearish signals, while the Stochastic is in an oversold zone with a bullish cross. This confluence of signals on the 4-hour chart suggests that the market is at a crossroads, with potential for either a bullish reversal or a continuation of the downtrend based on how key levels are handled.
From a macroeconomic perspective, the current environment is characterized by mixed signals. The DXY's neutral stance on the daily chart provides little directional guidance, making it a wildcard. However, the general risk-on sentiment indicated by the S&P 500 and Nasdaq on shorter timeframes could be a supportive factor for WTI, provided it doesn't abruptly reverse. Any dovish hints from central banks, or data suggesting inflation is cooling faster than expected, could further bolster risk appetite and commodity demand. Conversely, any hawkish rhetoric or stronger-than-expected inflation prints could quickly shift sentiment and weigh on oil prices.
The recent news mentioning WTI Crude Oil trimming losses and the risk of more losses increasing is a direct nod to the bearish sentiment currently at play. However, historical patterns often show that such statements can precede sharp reversals, especially if key support levels hold. The resilience shown around the $73.87 support is a critical factor for the bulls. If this level fails, the bearish case gains significant traction, potentially opening the door for a rapid slide towards lower targets.
Trade Scenarios and Probabilities
Given the conflicting signals and the pivotal price levels, it's essential to outline potential scenarios and their associated probabilities. The market is currently exhibiting characteristics of indecision, with strong short-term bearish momentum clashing with longer-term potential for a bounce and mixed macroeconomic cues.
Bearish Scenario: Downside Breakout
65% ProbabilityNeutral Scenario: Consolidation and Choppy Action
25% ProbabilityBullish Scenario: Rebound from Support
10% ProbabilityThe current technical indicators, particularly the short-term bearish signals on the 1-hour chart and the strong downtrend ADX, lend more weight to the bearish scenario in the immediate term. However, the potential for a bounce from the daily oversold conditions and the presence of significant support at $73.87 cannot be ignored. The neutral scenario accounts for the indecisive nature of the market, where price may oscillate between key levels before a more definitive direction emerges.
Traders should pay close attention to how WTI reacts to the $75.69 price point and the immediate support at $75.02. A failure to hold these levels would strengthen the bearish case, potentially triggering a cascade towards the $73.87 support. Conversely, a decisive move above $76.67 could signal a short-term bullish reversal, but confirmation would be needed from longer-term indicators and a break of the more significant resistance at $80.52.
Navigating the Technical Landscape: Indicators and Levels
A closer look at the technical indicators reveals the conflicting forces at play. On the 1-hour timeframe, the RSI at 32.74 is deeply in bearish territory, suggesting strong selling pressure. The MACD histogram is negative, reinforcing this short-term weakness. The ADX at 40.08 confirms a strong downtrend on this timeframe, indicating that immediate upside attempts are likely to face resistance. However, the Stochastic on the 1H chart shows a K% line above the D% line, which technically suggests a potential upward movement, a signal that is currently being overpowered by the bearish momentum.
Shifting to the 4-hour chart, the picture becomes more mixed. The RSI at 30.98 is also in oversold territory, but the MACD is showing positive momentum, with the MACD line above the signal line. This divergence between the 1-hour and 4-hour MACD readings is noteworthy. The ADX at 23.45 indicates a weak trend, suggesting that the market lacks strong conviction in either direction on this timeframe. The Stochastic here is in the oversold zone with a bullish cross, further adding to the potential for a short-term bounce.
The daily timeframe offers a longer-term perspective. The RSI at 42.5 indicates that while the price has fallen, it's not yet in deeply oversold territory, leaving room for further downside if momentum continues. However, the Stochastic on the daily chart is showing a bullish signal with K (4.37) crossing above D (25.98), suggesting that buyers might be accumulating positions at these levels. The ADX at 23.72 points to a moderate downtrend, implying that the current downward move has some staying power but is not yet a runaway trend. The MACD on the daily chart is negative, but the histogram is narrowing, which can sometimes precede a bullish crossover.
The key levels remain paramount in determining the short-to-medium term direction. The immediate resistance is seen around $76.67 on the 1-hour chart, followed by $77.62. A clear break and hold above these levels would be necessary for the bulls to gain confidence. On the downside, immediate support lies at $75.02, with the more critical daily support at $73.87. A breach of $73.87 would significantly increase the probability of the bearish scenario playing out, potentially targeting $71.65 and $67.22.
The interplay between these indicators and levels will be crucial. For instance, if WTI fails to break above $76.67 resistance and instead retreats towards $75.02, the bearish signals on the 1-hour chart would be validated. Conversely, a strong bounce from $73.87, coupled with a break above $76.67 and sustained buying volume, could invalidate the short-term bearish outlook and pave the way for a move towards higher targets.
Macroeconomic Influences and Geopolitical Undercurrents
While the technical picture provides a detailed map of potential price movements, the underlying macroeconomic and geopolitical factors often act as the catalysts that drive these moves. The current global economic landscape is a complex mosaic, with inflation data, central bank policies, and geopolitical tensions all vying for market attention.
The Dollar Index (DXY) is a key correlation to watch. Currently showing a neutral stance on the daily timeframe (ADX 25.78), its movements can significantly impact WTI. A strengthening dollar typically puts downward pressure on oil prices, as dollar-denominated commodities become more expensive for holders of other currencies. The recent news indicating WTI Crude Oil trimming losses could be exacerbated if the DXY finds renewed strength. Conversely, a weakening dollar could provide a much-needed tailwind for WTI, especially if it coincides with positive risk sentiment.
Risk appetite, as reflected in the S&P 500 and Nasdaq, also plays a crucial role. The current upward trend in these indices on shorter timeframes suggests a degree of market optimism. However, this can be fragile. Any significant negative news, whether economic or geopolitical, could trigger a sharp sell-off, leading to a flight to safety and potentially hitting oil prices as investors shed riskier assets. The Federal Reserve's stance on interest rates remains a significant driver of risk sentiment. While recent data might suggest a pause in rate hikes, any indication of persistent inflation or a hawkish pivot could dampen market enthusiasm.
Geopolitical risks, particularly in energy-producing regions, remain a constant undercurrent. While there are no specific major escalations reported in the last 48 hours relevant to WTI, the situation in the Middle East is always a factor that can lead to sudden supply disruptions and price spikes. Traders will be closely monitoring any developments that could impact global oil supply or transportation routes. The ongoing geopolitical dynamics, even if not making headlines daily, contribute to a baseline level of uncertainty that can amplify price swings.
Central bank policies, especially from the Federal Reserve, are paramount. Fed President John Williams' recent comments, suggesting a focus beyond the oil shock and on core inflation trends, indicate a continued vigilance against persistent inflation. This implies that interest rates might remain elevated for longer, which could act as a drag on economic growth and, consequently, oil demand. The market's interpretation of these signals, and the pricing of future rate hikes (or cuts), will be critical in shaping the broader economic outlook and its impact on WTI.
The recent analyst favorite mention of Freeport-McMoran Copper & Gold, while not directly related to oil, points to a sector-wide focus on commodity prices and investor sentiment. Surging precious metals prices, as seen with Fresnillo, also indicate a broader inflationary environment or a search for inflation hedges, which can sometimes spill over into energy markets. However, the fundamental demand for oil is also tied to global economic activity, which remains somewhat uncertain.
What happens if WTI breaks below the $73.87 support?
A decisive break below the $73.87 support level would invalidate the immediate bullish outlook and likely trigger a sell-off. Based on the daily chart's moderate downtrend strength (ADX 23.72), this could lead to a rapid decline towards the next significant targets at $71.65 and potentially $67.22. The short-term bearish indicators on the 1H chart would be strongly validated.
Is the RSI at 32.74 a sell signal for WTI right now?
The RSI at 32.74 on the 1-hour chart clearly indicates bearish momentum, signaling that sellers are currently in control in the short term. While it's not deeply oversold, it suggests that any upward attempts might face selling pressure, making it a cautionary signal for immediate long positions and potentially a confirmation for short positions if other bearish indicators align.
How will the Fed's stance on core inflation affect WTI this week?
If the Fed continues to emphasize concerns about core inflation, it could signal a prolonged period of higher interest rates. This might dampen economic growth expectations, which in turn would reduce oil demand forecasts. Consequently, WTI prices could face downward pressure as traders anticipate slower global economic activity.
Should I buy WTI at current levels of $75.69 given the mixed signals?
Buying at current levels of $75.69 carries significant risk due to the conflicting technical signals and bearish short-term momentum. A more prudent approach would be to wait for confirmation: either a strong hold of the $73.87 support with bullish divergence, or a decisive break above $76.67 resistance. Risk management is key; consider a tight stop-loss below $75.02 if entering long here.
Track markets in real-time
AI-powered analysis, technical indicators and real-time price data.
Join Our Telegram Channel
Breaking market news, AI analysis and trading signals instantly.
Join Channel