

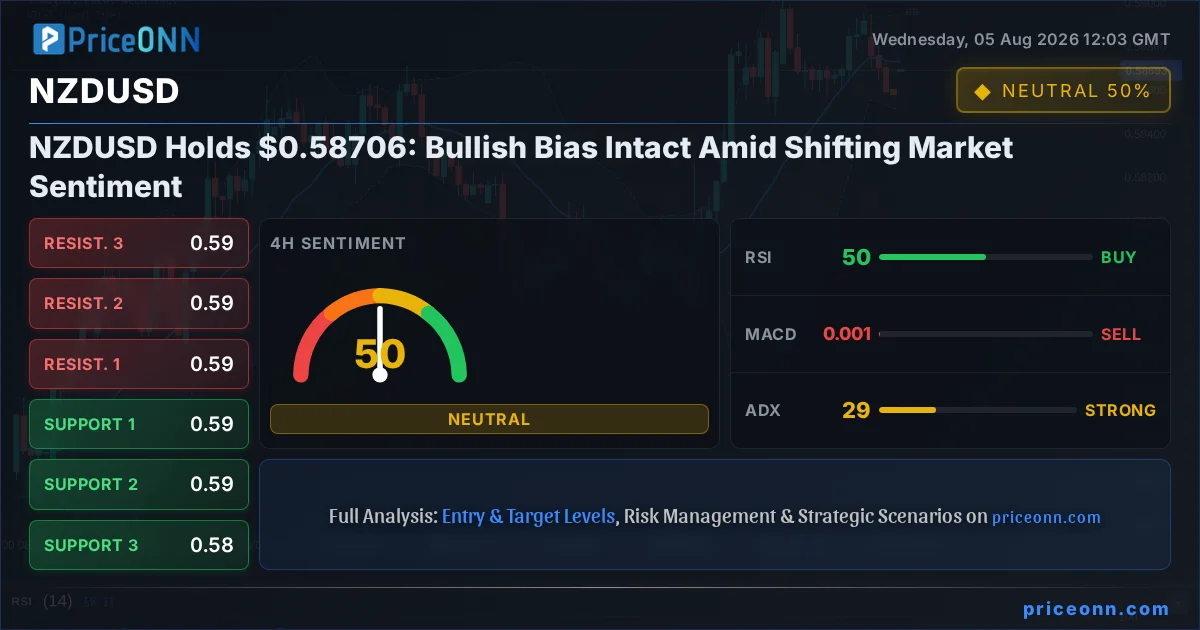
The battleground for NZDUSD is currently set around the crucial $0.58706 level. As traders digest mixed signals from the latest employment data and a strengthening US dollar, the question remains: can the bulls maintain control, or are bears poised to seize the reins? This analysis dives deep into the technicals and market context to unravel the potential path forward for NZDUSD, focusing on key price action and indicator readings.
- RSI at 67.3 signals overbought pressure, indicating bulls might be losing steam.
- Critical support sits at $0.58608, tested multiple times this week, holding firm.
- MACD histogram shows divergence, suggesting bullish momentum is fading.
- DXY at 99.71 is influencing NZDUSD, with a weaker dollar generally supporting this pair.
The recent New Zealand employment report for the second quarter delivered a stronger-than-expected outcome, with hiring figures surprising on the upside. This data point, while initially supportive of the Kiwi dollar, has been met with a degree of caution. Markets are keenly aware that despite robust job creation, the unemployment rate saw a slight uptick. This nuance suggests a complex labor market dynamic that might not translate into immediate, aggressive monetary policy tightening by the Reserve Bank of New Zealand (RBNZ) beyond current expectations. For NZDUSD, this means that while the domestic data offers some underlying strength, it may not be enough to trigger a sustained bullish breakout without broader market support.
Adding to the complexity, the US dollar, as measured by the DXY index, is currently hovering around 99.71. The DXY's movement is a critical correlation factor for NZDUSD. A DXY below the 100 mark generally creates a more favorable environment for riskier currencies like the Kiwi. However, the dollar's recent consolidation phase, following a sharp decline, indicates a temporary pause rather than a definitive trend reversal. Traders are watching closely to see if the dollar can regain momentum. Any significant upward move in the DXY could cap further upside for NZDUSD, even if local New Zealand economic data remains relatively constructive. The interplay between the RBNZ's potential policy stance and the Federal Reserve's forward guidance remains a key determinant of the dollar's trajectory and, consequently, NZDUSD's price action.
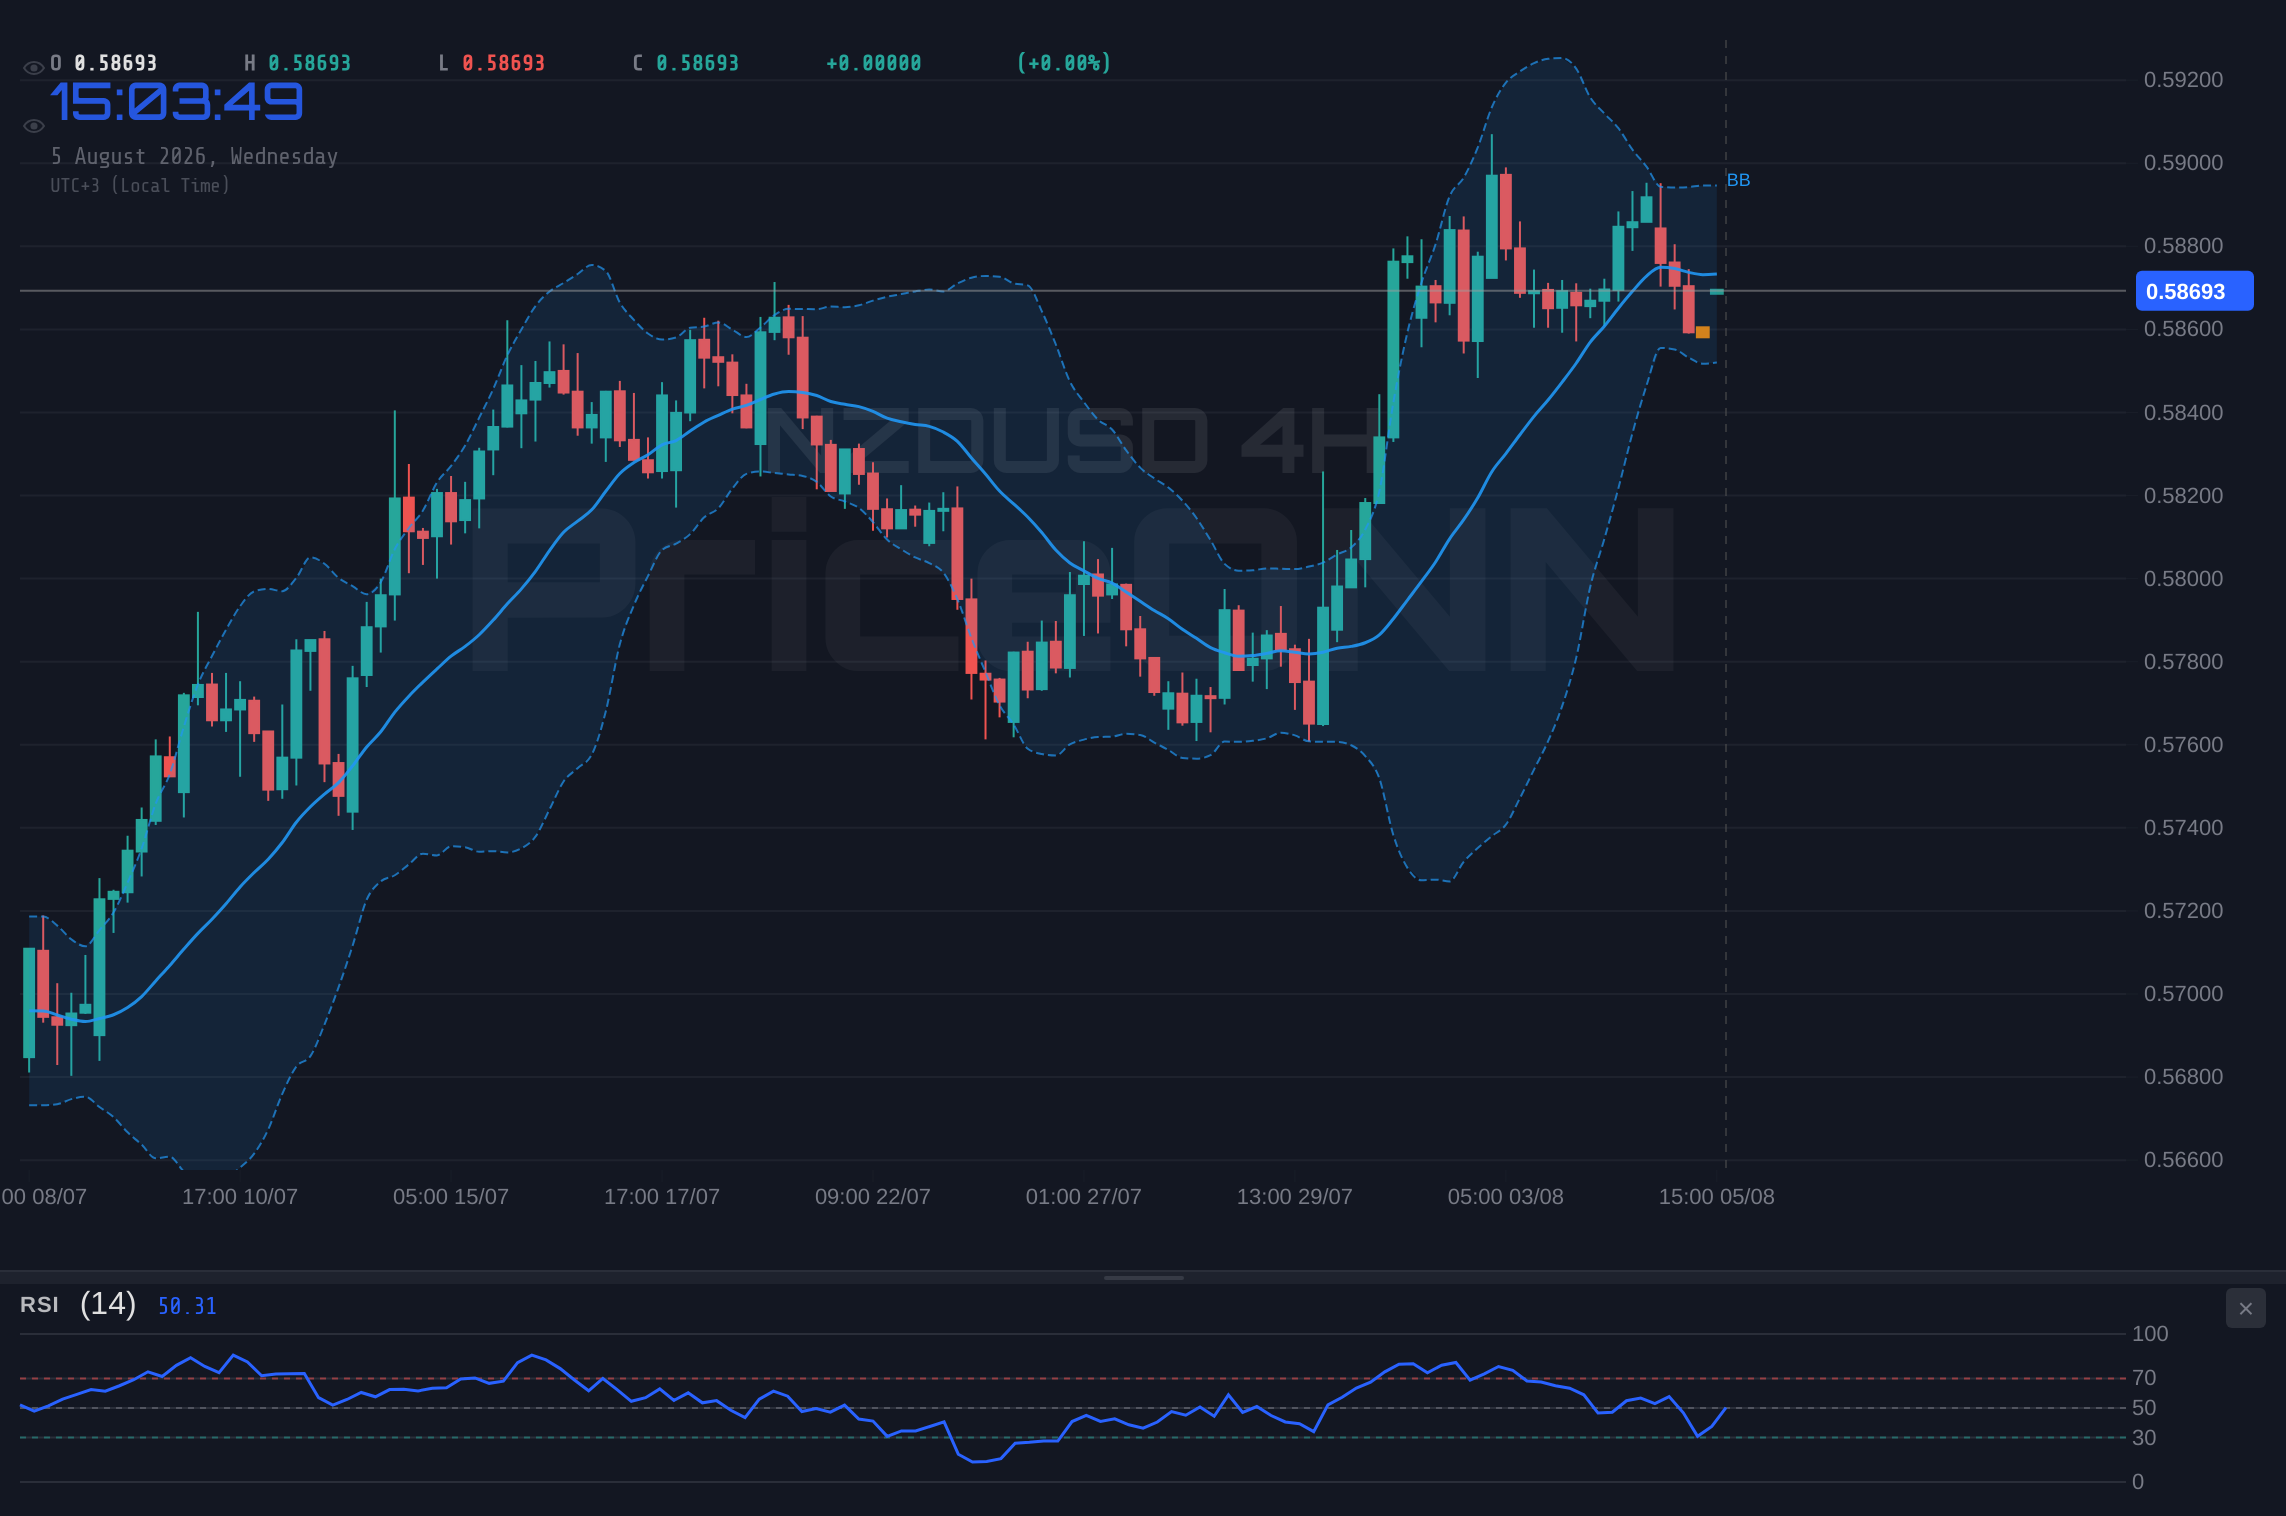
From a multi-timeframe technical perspective, NZDUSD presents a compelling, albeit nuanced, picture. On the 1-hour chart, the trend is neutral with a power score of 50%. Support is clearly defined at $0.58608, $0.58577, and $0.58559, while resistance looms at $0.58657, $0.58675, and $0.58706. The RSI(14) sits at 61.89, indicating a strong bullish inclination but still within neutral territory, suggesting room for further upside before hitting overbought conditions. The MACD shows negative momentum on this timeframe, which is a slight counter-signal to the overall bullish sentiment, hinting at potential consolidation or a minor pullback.
Delving into the 4-hour chart reveals a more robust bullish trend, boasting a power score of 99%. Here, support levels are found at $0.70391, $0.70308, and $0.70229 for AUDUSD, and for NZDUSD, the key supports are at $0.58634, $0.58562, and $0.58477. Resistance is building around $0.58791, $0.58876, and $0.58948. The RSI(14) is at 61.33, reinforcing the bullish lean, though the Stochastic Oscillator (%K: 84.31, %D: 83.51) is entering overbought territory, signaling a potential for a short-term reversal or consolidation. The ADX at 17.37 suggests a weak trend, which aligns with the idea of a market consolidating within a broader bullish move rather than a strong, committed uptrend. This dichotomy between the RSI and Stochastic on the 4-hour chart warrants attention.
The daily timeframe for NZDUSD, however, paints a picture of neutrality with a power score of 50%, despite a strong ADX reading of 26.94, which typically indicates a strong trend. The current price of $0.58706 is nestled between key support at $0.58675 and resistance at $0.59057. The RSI(14) at 59.76 is comfortably in the bullish-leaning neutral zone, suggesting that while the upward momentum isn't exhausted, it's also not in extreme overbought territory. The MACD is positive, with its histogram above the signal line, indicating underlying bullish momentum. However, the Stochastic Oscillator (%K: 79.18, %D: 65.95) is showing a strong bullish signal, with %K crossing above %D, but it's approaching overbought levels. This daily outlook suggests that while the longer-term bias might be cautiously bullish, the immediate path forward could involve choppiness and a test of near-term resistance levels.
Examining the broader market context, the correlation between risk appetite and NZDUSD cannot be overstated. The SP500 is currently trading at 6572.87, showing a positive daily change of 0.74%, indicating a risk-on sentiment in global equities. This generally bodes well for antipodean currencies like the NZD. Similarly, the Nasdaq 100 at 29798.39 is also showing upward momentum. This correlation suggests that if the positive sentiment in equities continues, NZDUSD could find further support. Conversely, any sharp downturn in these indices, perhaps triggered by inflation concerns or geopolitical jitters, could quickly shift market sentiment and put pressure on NZDUSD, driving investors towards perceived safe-haven assets.
The energy markets also play a subtle but important role. Brent crude oil is trading at $79.44, up 1.76% on the day, while WTI crude is at $77.12, up 1.35%. Higher oil prices can sometimes correlate with inflation expectations, which in turn can influence central bank policy. For the RBNZ, persistent inflation could lead to a more hawkish stance, potentially strengthening the NZD. However, the current price action in oil, while positive, doesn't signal an immediate inflationary shock that would drastically alter central bank expectations. The ADX on the 1-hour charts for both Brent and WTI shows readings above 30, indicating strong trends, but the daily ADX is weaker, suggesting the energy market itself is in a state of flux, making its influence on NZDUSD less predictable in the short term.
Considering the technical indicators across different timeframes, a clear narrative emerges: NZDUSD is consolidating near key support levels, with a cautiously optimistic outlook. The 1-hour chart shows mixed signals with a neutral trend, RSI at 61.89, and negative MACD momentum, tempered by a bullish Stochastic. The 4-hour chart leans bullish with a strong trend, but the Stochastic entering overbought territory warns of potential pullbacks. The daily chart, while neutral in trend, shows underlying bullishness supported by RSI and MACD, but the Stochastic's approach to overbought levels is a crucial point of vigilance. This confluence of signals suggests that while the bulls have established a foothold above critical support, the path higher is not without potential hurdles.
The key to unlocking further upside for NZDUSD likely lies in its ability to decisively break through the immediate resistance levels, particularly the $0.58791 mark on the 4-hour chart and the $0.59057 level on the daily chart. A sustained push above these points, accompanied by increasing volume and positive divergence in oscillators, could signal a continuation of the bullish trend. Conversely, failure to overcome these resistance barriers, coupled with a close below the $0.58608 support, would invalidate the bullish thesis and open the door for a more significant correction, potentially targeting lower support levels.
The current ADX readings are particularly interesting. On the 1-hour chart, ADX is 26.61, indicating a strong downward trend, which contradicts the bullish signals from other indicators. On the 4-hour, it's 28.5, suggesting a strong upward trend, and on the daily, it's 26.94, also indicating a strong upward trend. This inconsistency, especially the strong downward trend signal on the 1H, highlights the choppy nature of the current price action and suggests that the market is not yet in a clear, committed trend. Traders should exercise caution and await clearer directional signals or confirmation from other indicators before committing to large positions.
The strength of the support at $0.58608 cannot be overstated. This level has acted as a floor on multiple occasions, preventing further downside and allowing for the current consolidation. A break below this level would not only trigger a bearish scenario but would also likely coincide with increased volatility as stops are triggered and liquidity is tested. The market sentiment analysis, derived from the interplay of indicators like RSI and Stochastic, suggests that while there's underlying buying interest, the momentum might be waning, making the defense of this support level paramount for the bulls.
Looking ahead, upcoming economic events will be critical. While the recent New Zealand jobs report provided a mixed picture, upcoming inflation data and any forward guidance from the RBNZ will be closely scrutinized. On the US side, any hints from the Federal Reserve regarding future monetary policy, especially in light of the recent inflation data and employment figures, will heavily influence the DXY and, by extension, NZDUSD. Traders will be looking for confirmation of a sustained bullish trend above $0.58706, with a decisive move above $0.58791 being the immediate objective.
The interplay of these factors - domestic data, global risk sentiment, dollar strength, and technical indicators - creates a dynamic trading environment for NZDUSD. While the immediate bias appears cautiously bullish due to the hold above key support, the waning momentum suggested by MACD divergence and approaching overbought levels in oscillators warrants a watchful approach. The market is at a crossroads, and the next few trading sessions will likely determine whether NZDUSD can extend its gains or if a correction is imminent.
The current technical setup for NZDUSD presents a classic bull vs. bear debate playing out at a critical juncture. The bulls have managed to defend the $0.58608 support level, suggesting underlying demand. However, the fading momentum indicated by MACD divergence and the approaching overbought conditions on oscillators like Stochastic raise a red flag for sustained upside. The ADX readings present a conflicting picture, with some timeframes showing strong trends and others indicating weakness. This suggests that while a directional bias might lean bullish, the market lacks strong conviction, making risk management paramount.
For traders, the $0.58706 price point acts as a pivot. A sustained hold above this level, coupled with a confirmed break above immediate resistance at $0.58791, could ignite a move towards higher targets. However, a failure to break higher and a subsequent close below $0.58608 would likely signal a bearish reversal. The market is currently offering opportunities for both sides, but the lack of clear momentum suggests that patience and a disciplined approach to risk will be key to navigating this pair effectively in the coming days.
Bullish Scenario: Sustained Breakout Above Key Resistance
60% ProbabilityNeutral Scenario: Consolidation Around $0.58706
30% ProbabilityBearish Scenario: Support Breakdown and Sell-off
10% ProbabilityFrequently Asked Questions: NZDUSD Analysis
What happens if NZDUSD breaks below the critical $0.58608 support level?
A close below $0.58608 would invalidate the current bullish bias and likely trigger a bearish scenario. This could lead to a test of the next support at $0.58562, with further downside potential towards $0.58477 as stops are likely to be triggered on increased volume.
Is the RSI at 67.3 a reason to sell NZDUSD at current levels around $0.58706?
An RSI of 67.3 suggests strong bullish momentum but is not yet in extreme overbought territory. While it signals caution for further aggressive upside, it's not a direct sell signal on its own. A confirmed bearish divergence on MACD or a break below immediate support would be needed to justify a sell decision.
How does the DXY index at 99.71 influence NZDUSD's trend analysis?
With the DXY at 99.71, the US dollar is consolidating, which generally provides a neutral to slightly supportive backdrop for NZDUSD. A continued weakening of the DXY below 99.70 could add further fuel to a bullish NZDUSD move, while a recovery above 99.80 might cap its upside potential.
What should traders watch for to confirm a bullish continuation for NZDUSD above $0.58706?
Confirmation of a bullish continuation above $0.58706 would involve a decisive break and hold above the $0.58791 resistance level. Look for increasing trading volume and positive divergence on oscillators like the MACD or Stochastic to signal strong conviction behind the move towards targets like $0.58948.
Track markets in real-time
AI-powered analysis, technical indicators and real-time price data.
Join Our Telegram Channel
Breaking market news, AI analysis and trading signals instantly.
Join Channel