

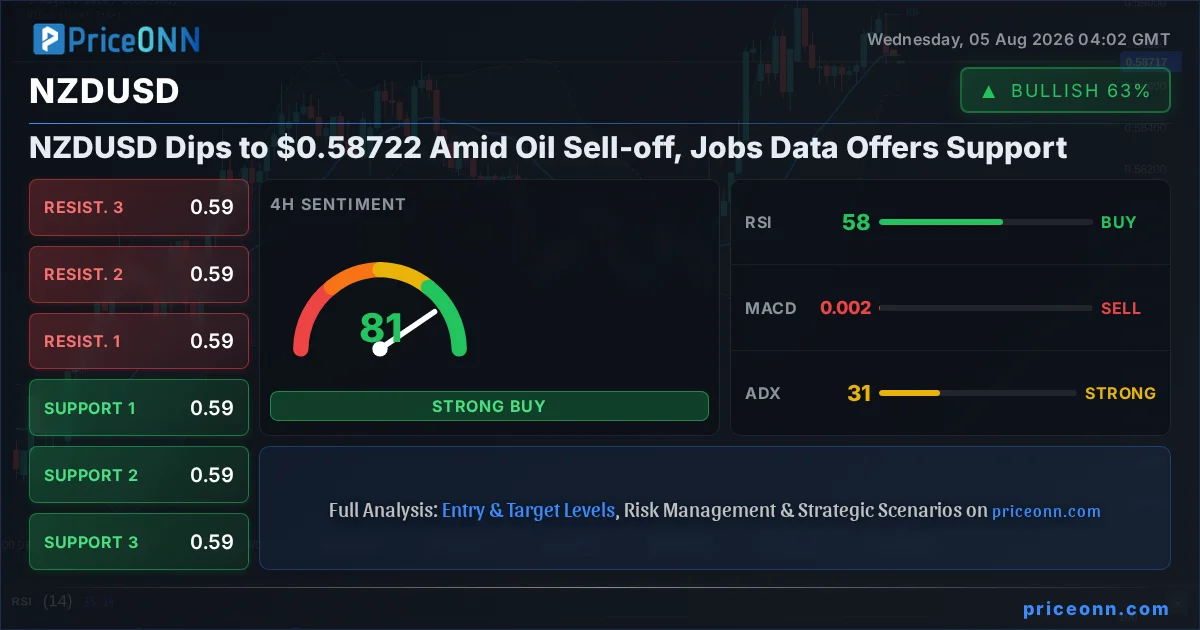
The New Zealand Dollar is navigating a complex cross-current today, with NZDUSD hovering around the $0.58722 mark. While a stronger-than-expected jobs report for Q2 provided a crucial floor, the pair is simultaneously contending with a noticeable dip in crude oil prices, specifically Brent crude trading near $77.72. This juxtaposition of robust domestic labor market data against softening commodity markets creates a fascinating tug-of-war for the kiwi. We're seeing a classic risk-off undertone creeping into commodity markets, which typically puts pressure on currencies like the NZD, but the surprising strength in New Zealand's employment figures is offering a counter-narrative. The question now is whether the domestic economic resilience can overcome the headwinds from global commodity weakness and a cautious global risk sentiment.
- NZDUSD is trading at $0.58722, influenced by mixed global signals.
- New Zealand's Q2 employment report showed stronger-than-expected job growth, providing support.
- Brent crude oil prices have dipped to $77.72, signaling potential inflation concerns and risk aversion.
- The DXY is trading around 99.83, exerting mild pressure on currency pairs like NZDUSD.
The latest employment data from New Zealand painted a surprisingly optimistic picture. The second quarter saw job growth exceed expectations, a signal that the domestic economy, despite global uncertainties, is demonstrating a degree of resilience. This is crucial for the Reserve Bank of New Zealand (RBNZ), as it potentially bolsters the case for a more hawkish stance on interest rates, or at the very least, delays any potential easing. However, this positive domestic news is being partially overshadowed by a renewed dip in crude oil prices. Brent crude has fallen back towards the $77.72 level, a move that often correlates with a decrease in global risk appetite. When oil prices slide, it can signal concerns about global demand, which in turn can weigh on commodity-linked currencies such as the NZD. This creates a divergence: strong local data versus weakening global commodity sentiment.
The interplay between these two forces is critical for understanding the current price action in NZDUSD. On one hand, the robust jobs market suggests underlying economic strength in New Zealand. This could translate into higher consumer spending and business investment, providing a solid foundation for the currency. The RBNZ, facing sticky inflation, would likely welcome such data as it gives them more room to maneuver regarding monetary policy. On the other hand, the decline in oil prices, a bellwether for global economic health and inflation expectations, introduces a layer of caution. A sustained drop in oil could eventually dampen global growth prospects, impacting export-oriented economies like New Zealand. Traders are now tasked with weighing the immediate impact of domestic labor market strength against the broader implications of falling commodity prices.
Navigating the Commodity Conundrum
The recent move in Brent crude oil from highs near $79.10 down to the current $77.72 highlights the volatility that commodity markets are experiencing. This isn't just about energy prices; it's a significant indicator of global economic sentiment. A falling oil price can be interpreted in several ways: perhaps demand is weakening, signaling a potential global slowdown, or maybe supply concerns are easing. In the context of inflation, lower oil prices could be seen as a positive for central banks aiming to bring down price pressures. However, for commodity-exporting nations, a sustained decline can be detrimental to their terms of trade. For New Zealand, while not a major oil exporter, the impact on global sentiment and the potential knock-on effects on trading partners cannot be ignored. The current dip suggests that global growth concerns might be resurfacing, adding a bearish layer to the commodity complex.
This commodity weakness casts a shadow over risk-sensitive assets, including the New Zealand Dollar. When global risk appetite wanes, investors often flock to perceived safe-haven assets. This typically benefits currencies like the US Dollar, Japanese Yen, and Swiss Franc, while putting pressure on currencies like the AUD and NZD. The Dollar Index (DXY), currently trading around 99.83, reflects this sentiment; a slight dip today doesn't negate the underlying strength that can emerge during risk-off periods. If the decline in oil prices accelerates or is seen as a precursor to broader economic weakness, we could see a flight to safety that pushes NZDUSD lower, regardless of the strong domestic jobs data. The market's reaction to the upcoming economic calendar will be crucial in determining whether this risk-off sentiment takes hold.
The Jobs Data: A Silver Lining?
The New Zealand employment report, however, offers a compelling counter-argument to the bearish commodity narrative. The data revealed a robust increase in job creation for the second quarter, significantly outpacing forecasts. This indicates a labor market that is more resilient than many anticipated, suggesting underlying economic momentum. Such strength is precisely what the RBNZ would be looking for as it grapples with inflation. While the central bank has been cautious, hinting at a potential pause in tightening cycles, strong employment figures can reinforce the argument for maintaining a higher interest rate for longer, or at least deterring any premature rate cuts. This provides a fundamental tailwind for the NZD, as higher interest rates generally make a currency more attractive to investors seeking yield.
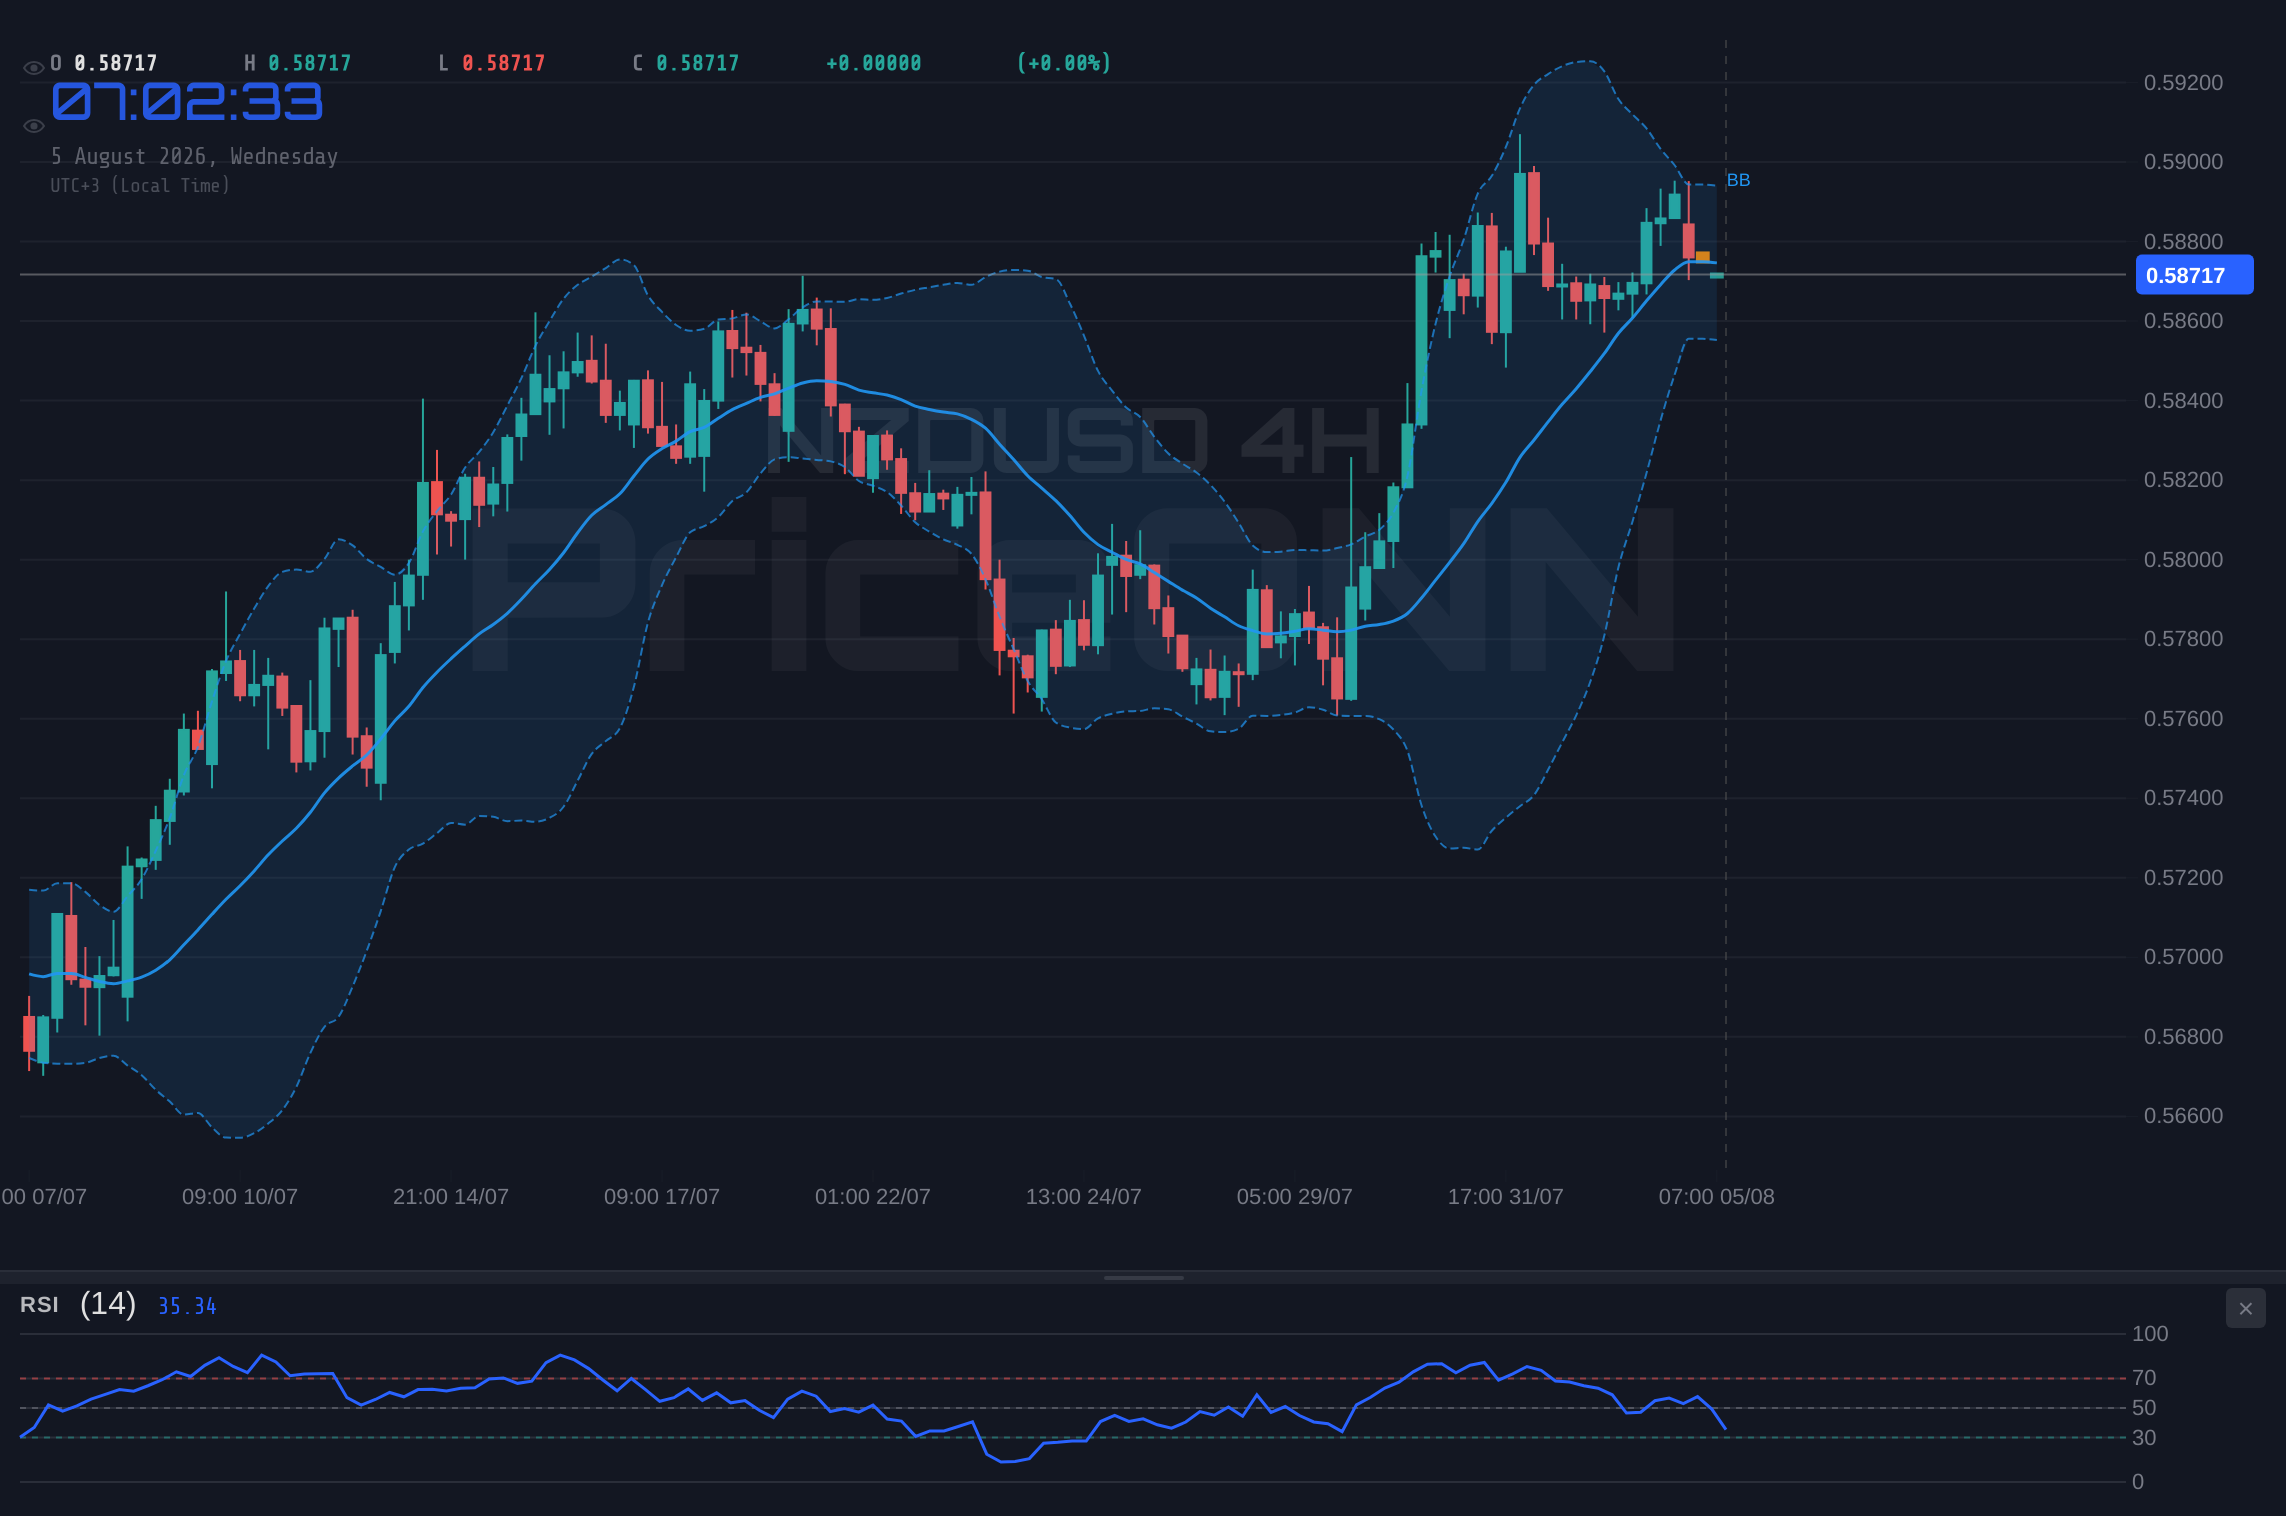
The ADX on the 4-hour timeframe is showing 13.59, indicating a weak trend, which aligns with the current choppiness. However, the 1-hour ADX at 34.1 suggests a stronger trend is trying to form. The daily ADX at 27.12 points to a solid trend. The divergence in ADX readings across timeframes highlights the market's indecision. On the 1-hour chart, the RSI is at 77.3, firmly in overbought territory, suggesting that the recent upward momentum might be due for a pause or a pullback. This overbought condition on a shorter timeframe could signal a near-term consolidation or a minor correction, even if the longer-term trend remains positive. Traders will be watching to see if this overbought condition leads to profit-taking or if the underlying strength can push prices higher.
Technical Picture: Mixed Signals and Key Levels
Looking at the technical indicators for NZDUSD, the picture is nuanced. The 1-hour chart shows the RSI at 77.3, signaling overbought conditions. This suggests that the recent upward move might be running out of steam in the short term, and a pullback is possible. The MACD is showing positive momentum, and the Stochastic Oscillator is in overbought territory with %K above %D, reinforcing the idea of strong upward pressure but also potential for a reversal. The ADX on the 1-hour chart at 34.1 indicates a strong uptrend, but the 4-hour ADX of 12.92 suggests a weaker trend on that timeframe, implying a lack of strong conviction. On the daily chart, the RSI is at 52.91, sitting in neutral territory but with an upward bias, while the ADX at 24.45 indicates a moderately strong uptrend. This mix of signals across different timeframes suggests that while the overall direction might be upwards, the path forward could be volatile, with potential for consolidation or pullbacks.
Crucially, the support and resistance levels provide clear reference points. On the 1-hour chart, immediate support is found at 4104.48 for XAUUSD, and for NZDUSD, key support levels are identified at 0.58669, 0.58596, and 0.58545. These are the levels traders will be watching closely. A break below 0.58669 could signal a short-term reversal, while holding above it would maintain the bullish bias. Resistance, on the other hand, is stacked at 0.58793, 0.58844, and 0.58917. A decisive move above 0.58793 would be the first step towards a more significant rally, potentially targeting higher levels. The daily resistance at 0.59057 is a key psychological barrier that, if breached, could unlock further upside potential.
Trade Stance and Scenarios
Given the conflicting signals - strong domestic jobs data versus weakening oil prices and mixed technical indicators - a cautious approach is warranted. The overall trend on the daily chart is neutral but leaning higher, with the ADX at 24.45 suggesting a moderate uptrend. However, the overbought RSI on the 1-hour chart (77.3) and the weak trend on the 4-hour ADX (12.92) point to potential near-term headwinds. The strong support at 0.58669 is a critical level to watch. A hold above this could see a move towards resistance at 0.58793 and potentially higher.
Bearish Scenario: Oil Woes Drag NZDUSD Lower
40% ProbabilityNeutral Scenario: Consolidation Around Current Levels
30% ProbabilityBullish Scenario: Jobs Data Outweighs Oil Weakness
30% ProbabilityThe primary trade plan leans towards a cautiously bullish outlook, contingent on holding key support levels. If NZDUSD can maintain its footing above the 0.58669 support, then a move towards the immediate resistance at 0.58793 is plausible. A break above this level, particularly with increasing volume, would validate the bullish scenario, potentially targeting the daily resistance at 0.59057. This scenario hinges on the strength of the domestic jobs data continuing to outweigh the negative sentiment from falling oil prices and a potentially risk-averse global market. The ADX on the daily chart at 24.45 provides some backing for a sustained move, though the weaker ADX on the 4-hour chart means the trend isn't yet firmly established.
Conversely, a failure to hold the 0.58669 support would invalidate the immediate bullish thesis and open the door for a move towards the next support levels at 0.58596 and 0.58545. This bearish scenario becomes more likely if oil prices continue to slide aggressively or if broader market sentiment turns decidedly risk-off. The overbought RSI on the 1-hour chart (77.3) adds a cautionary note, suggesting that a short-term pullback is a distinct possibility, even within a broader uptrend. Therefore, risk management is paramount. Traders should be looking for confirmation of either a breakout above resistance or a confirmed hold of support before committing to a directional trade. The current environment calls for patience and a focus on defined risk levels.
Looking Ahead: What's Next for NZDUSD?
The coming days will be critical for NZDUSD. The market will be digesting the implications of the strong New Zealand jobs report while keeping a close eye on global commodity markets and broader risk sentiment. Any further weakness in oil prices could exert downward pressure, while a stabilization or recovery might allow the positive effects of the employment data to shine through. Geopolitical developments and central bank rhetoric, particularly from the US Federal Reserve, will also play a significant role in shaping the US Dollar's trajectory, which in turn impacts NZDUSD. The correlation with the DXY, currently around 99.83, remains a key factor; a strengthening dollar would likely cap any upside for NZDUSD, while a weakening dollar could provide additional fuel for a bullish move.
From a technical perspective, the 0.58669 support level is the linchpin for the near-term outlook. A decisive hold here, followed by a push above 0.58793, would set the stage for a test of higher resistance levels, potentially aiming for the 0.59057 mark on the daily chart. However, a breach of 0.58669 could lead to a test of the 0.58596 and 0.58545 levels, especially if global risk aversion intensifies. The divergence in ADX readings across timeframes suggests that the trend is not yet firmly established, implying that volatility could remain elevated. Investors should remain vigilant, monitor the key levels closely, and be prepared to adjust their positions based on incoming data and market reactions. The market is offering opportunities, but they require careful risk management and a clear understanding of the prevailing conditions.
Frequently Asked Questions: NZDUSD Analysis
What happens if NZDUSD breaks below the $0.58669 support level?
If NZDUSD closes below the critical $0.58669 support level on the 1-hour chart, it would invalidate the immediate bullish scenario. This could trigger a move towards the next support at $0.58596, with a further downside target at $0.58545, especially if global risk aversion intensifies and oil prices continue to fall.
Should I consider buying NZDUSD at current levels of $0.58722 given the strong jobs data?
A cautious approach is advised. While the New Zealand jobs data is supportive, the RSI at 77.3 on the 1-hour chart indicates overbought conditions, suggesting potential for a short-term pullback. Look for confirmation, such as a hold above $0.58669 support or a clear break above $0.58793 resistance, before entering a long position.
Is the RSI at 77.3 on the 1-hour chart a sell signal for NZDUSD right now?
An RSI reading of 77.3 signals overbought conditions on the 1-hour timeframe, suggesting that upward momentum may be exhausted in the short term. While it doesn't automatically signal a sell, it indicates a higher probability of a consolidation or pullback. Traders might look for bearish divergence or a bearish candle pattern for a confirmed short-term selling opportunity.
How will falling Brent crude oil prices affect NZDUSD this week?
Falling Brent crude prices, currently near $77.72, can signal weakening global demand and increase risk aversion. This typically puts pressure on commodity-linked currencies like the NZD. If oil prices continue to decline, it could counteract the positive impact of New Zealand's jobs data and potentially push NZDUSD lower towards support levels.
Track markets in real-time
AI-powered analysis, technical indicators and real-time price data.
Join Our Telegram Channel
Breaking market news, AI analysis and trading signals instantly.
Join Channel