

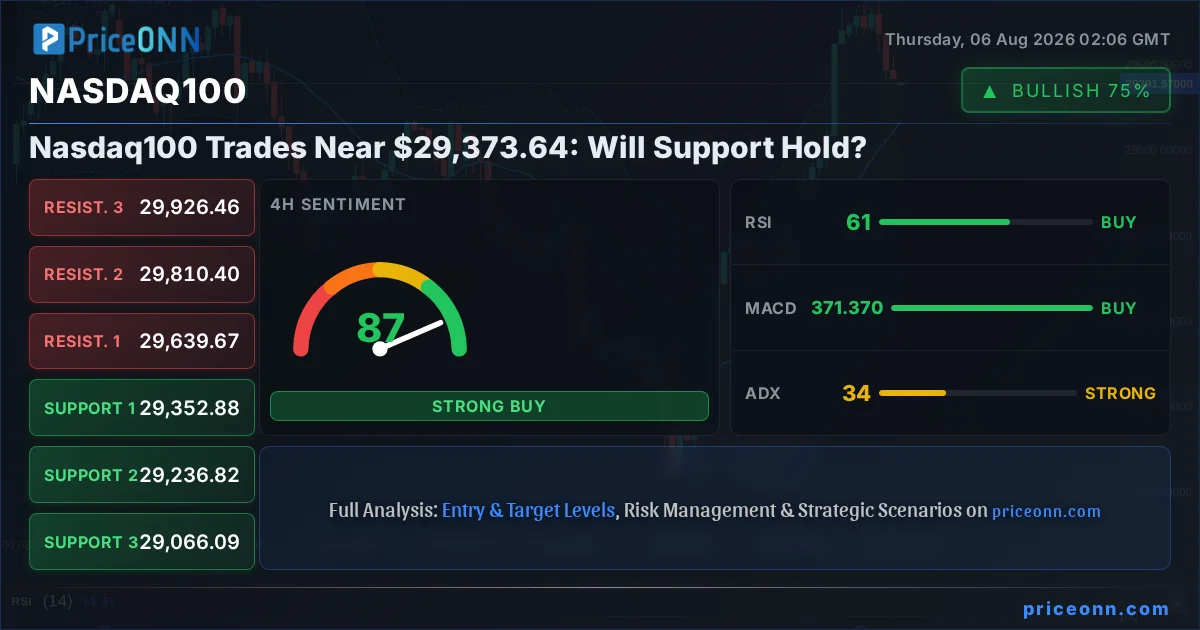
The Nasdaq100 index is currently navigating a critical juncture, trading near the $29,373.64 mark. After a period of significant volatility, the tech-heavy index finds itself at a crossroads, with key technical indicators flashing mixed signals. The $28,997 support level looms large, representing a potential line in the sand that could determine the short-to-medium term direction. Understanding the interplay between global risk sentiment, central bank policy expectations, and specific market dynamics is paramount for traders looking to position themselves in this complex environment.
- Nasdaq100 RSI at 37.41 on the 1H chart signals bearish pressure, while the 4H RSI at 60.25 suggests a more neutral stance.
- The critical support level for the Nasdaq100 is currently at $28,997.34, tested multiple times in recent trading sessions.
- MACD histogram on the 1H chart is negative, indicating fading bearish momentum, but the 4H MACD shows positive momentum.
- Correlation analysis shows the DXY at 99.68, which typically exerts downward pressure on risk assets like the Nasdaq100.
Navigating the Crossroads: Nasdaq100's Tightrope Walk
The Nasdaq100, a barometer for the technology sector and broader market sentiment, is currently engaged in a delicate balancing act. Trading around $29,373.64, the index reflects a market grappling with conflicting economic data and policy signals. On the 1-hour chart, the Relative Strength Index (RSI) at 37.41 suggests a leaning towards oversold conditions, hinting at potential short-term buying interest. However, this is contrasted by the 4-hour RSI at 60.25, which sits comfortably in neutral territory, indicating no immediate overbought or oversold pressure on that timeframe. This divergence highlights the indecision gripping market participants. The MACD histogram on the 1H chart is negative, which usually signals bearish momentum, yet the 4-hour MACD paints a different picture with positive momentum. This technical ambiguity underscores the need for a multi-faceted approach, considering both the immediate price action and the broader trend.
The influence of the US Dollar Index (DXY), currently hovering around 99.68, cannot be overstated. A strengthening dollar often correlates with a pullback in risk assets like the Nasdaq100, as it increases the cost of holding dollar-denominated assets for foreign investors and can signal tighter global liquidity. Conversely, a weakening dollar can provide a tailwind for equities. The current neutral stance of the DXY at this level adds another layer of complexity, suggesting that currency markets are also in a state of flux, awaiting clearer economic direction. This interplay between the dollar, risk sentiment, and equity indices like the Nasdaq100 creates a challenging landscape, where clear directional conviction is hard to come by.
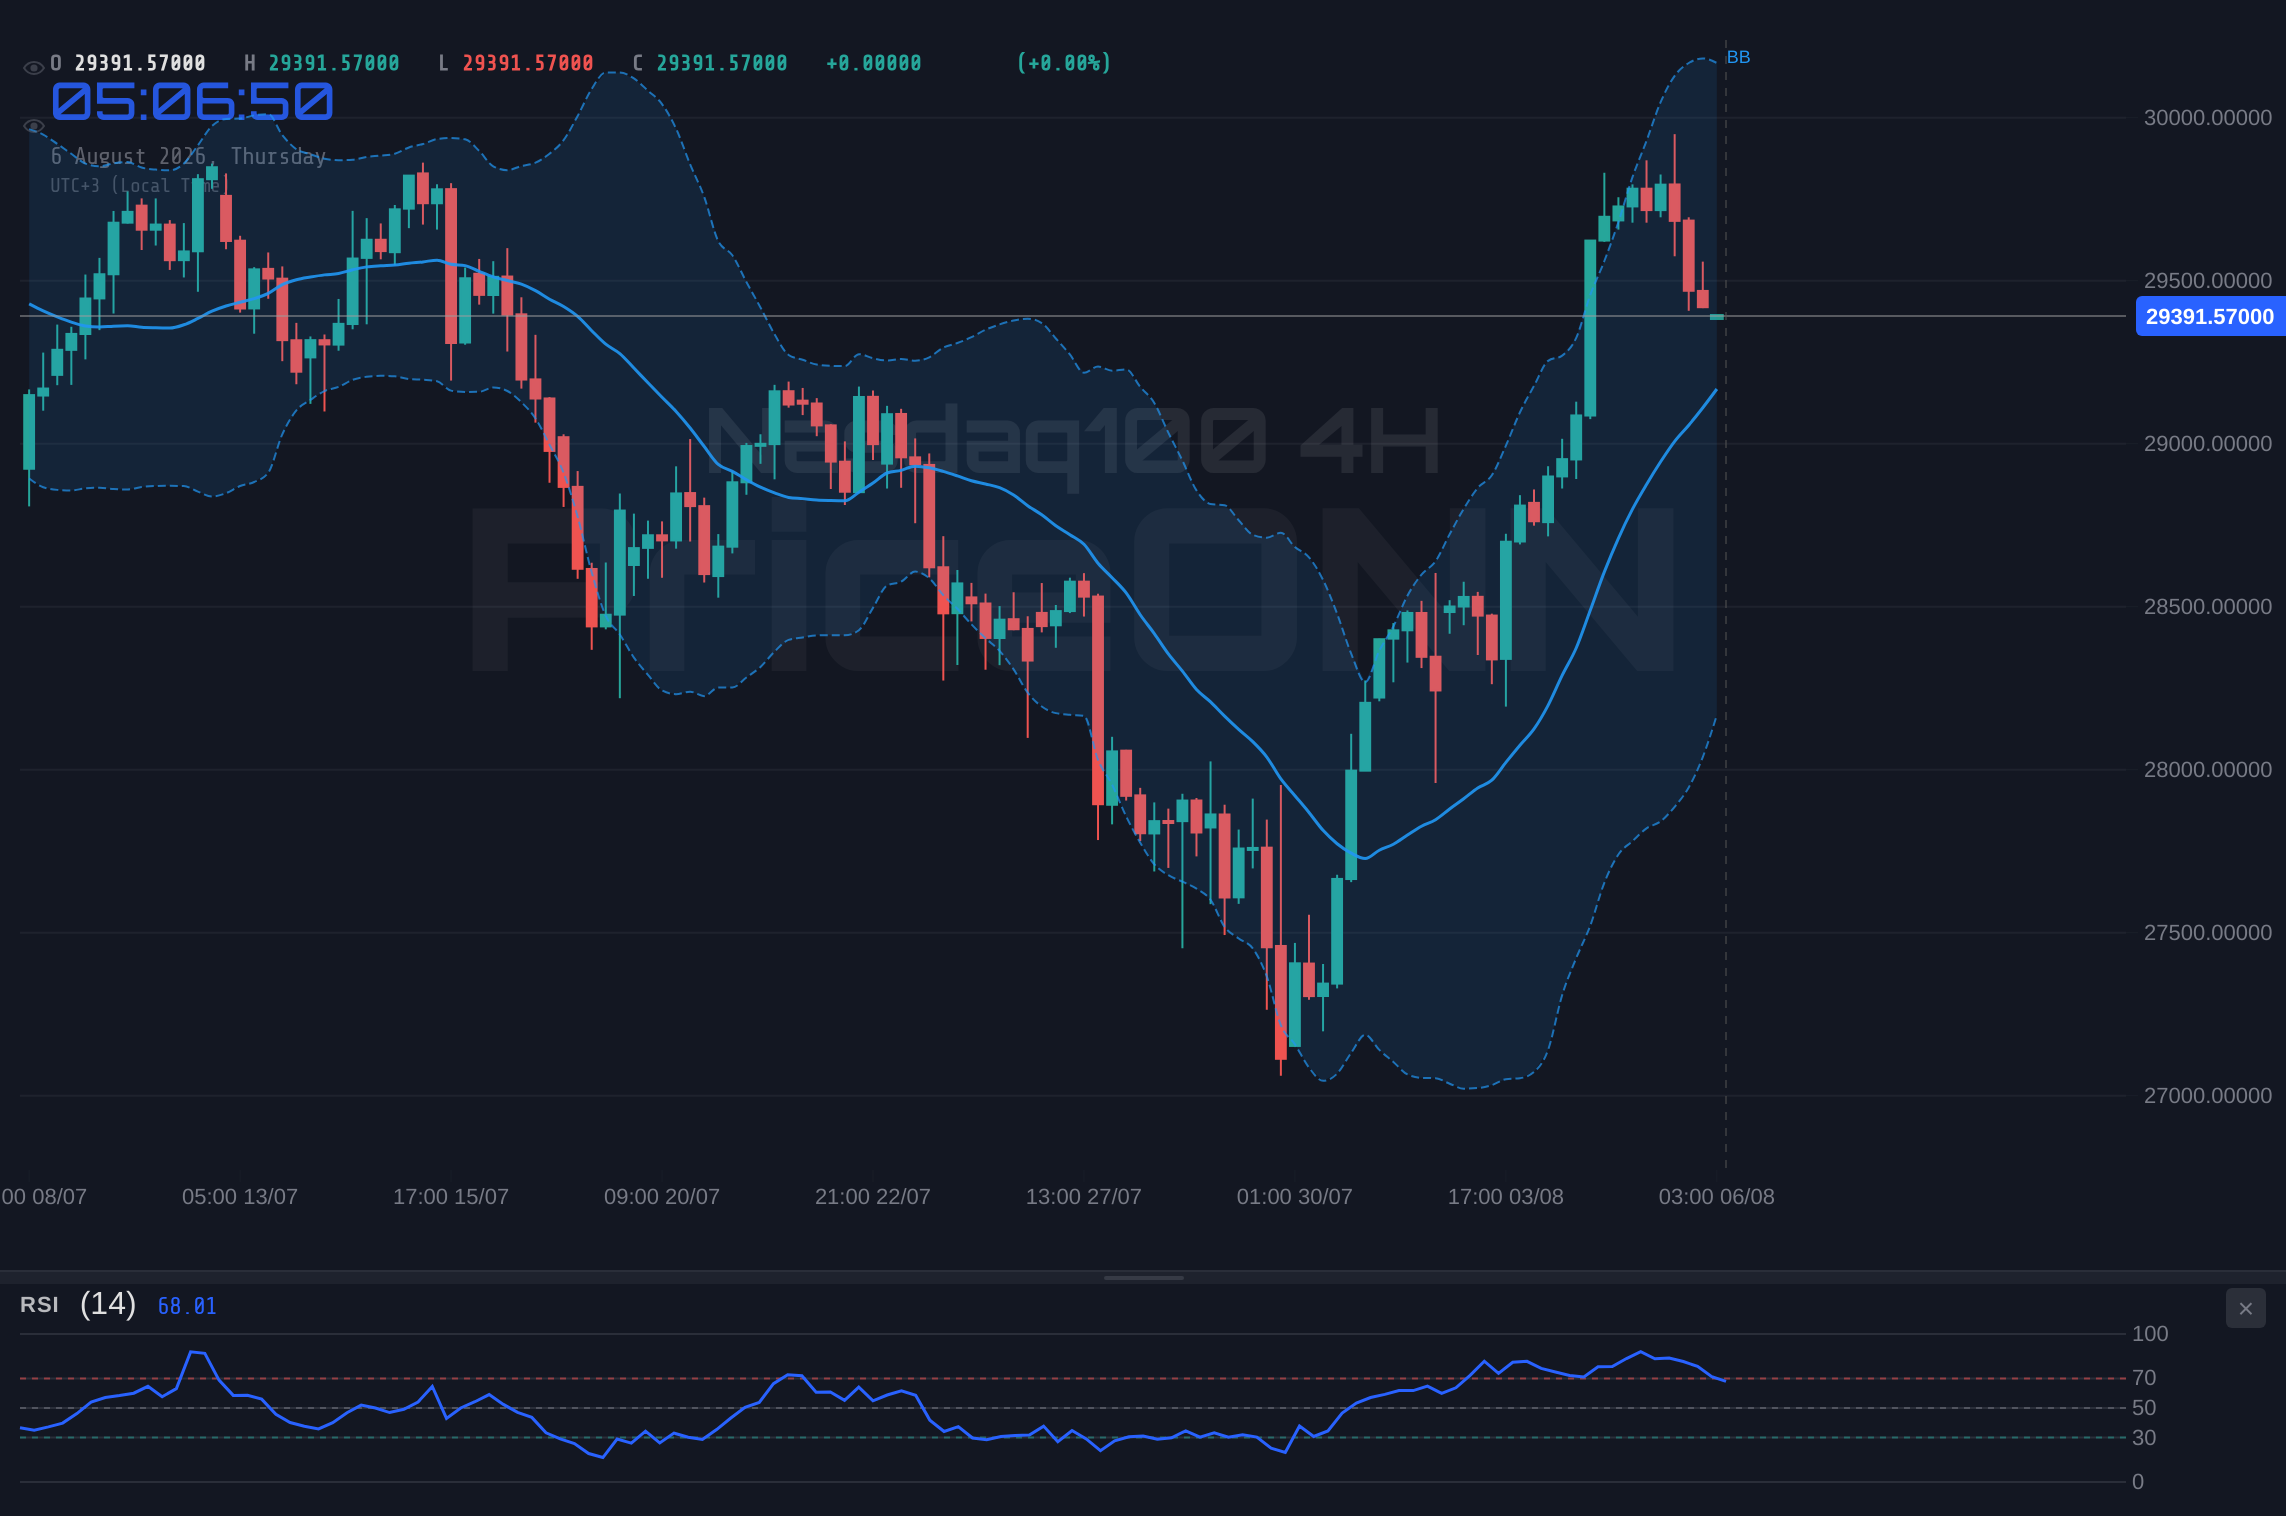
Furthermore, the recent price action for the Nasdaq100 shows a consistent struggle to decisively break through key resistance levels, while finding temporary respite around the $28,997.34 support. This trading range suggests a market consolidating its recent moves, potentially building energy for a significant directional shift. The ADX indicator provides further insight: on the 1H chart, it stands at 31.29, indicating a strong trend, albeit one that could be either up or down. The 4H ADX at 33.93 reinforces this notion of a strong, established trend, while the daily ADX at 25.14 suggests a robust trend is in play. The key question remains: which direction will this strong trend ultimately favor?
The Shifting Sands of Market Sentiment
Market sentiment is currently a delicate equilibrium. The broader risk appetite, often gauged by indices like the S&P 500 and its tech-focused counterpart, the Nasdaq100, is showing signs of fragility. The S&P 500, trading around 6572.87 with a positive daily change, presents a somewhat contradictory picture to the Nasdaq100's current consolidation. However, its 1-hour RSI at 70.95 is approaching overbought territory, hinting at potential profit-taking that could spill over into other equity markets. The broader market's ability to digest these mixed signals will be crucial. A sustained decline in major indices could trigger a flight to safety, impacting risk assets negatively.
Geopolitical tensions and central bank policy remain significant overhangs. While specific geopolitical events are not detailed in the provided data, the general market understanding is that any escalation in global conflicts or unexpected policy shifts can rapidly alter risk sentiment. The Federal Reserve's stance on interest rates continues to be a dominant narrative. Traders are constantly analyzing economic data, such as employment figures and inflation reports, to gauge the likelihood of future rate hikes or cuts. Weak ADP employment data, reported recently, reinforced market convictions that the Fed might be nearing the end of its tightening cycle, which can be a double-edged sword for equities. While lower rates can be bullish, they can also signal underlying economic weakness.
The correlation between the Nasdaq100 and other major markets is a vital component of any comprehensive analysis. The current DXY reading of 99.68 suggests the dollar is not in a strong trend, which could provide some breathing room for risk assets. However, if the dollar were to strengthen significantly, it would likely put pressure on the Nasdaq100. Similarly, energy prices, represented by Brent Crude at $79.19, can influence inflation expectations and, consequently, central bank policy. A sharp rise in oil prices could reignite inflation concerns, potentially leading to a more hawkish Fed stance, which would be bearish for tech stocks. Conversely, stable or falling energy prices could ease inflation worries.
The Bull Case: Reclaiming the High Ground
For the bulls to regain control of the Nasdaq100 narrative, a decisive move above immediate resistance levels is necessary. The technical setup on the 4-hour chart offers some encouragement, with the RSI at 60.25 and positive MACD momentum. A sustained break above the immediate resistance at $29,465.67 would be the first sign of renewed strength. Confirmation would come from increased trading volume and a subsequent push towards the next resistance level at $29,512.78. If this upward momentum continues, the index could target the $29,537.77 level, and potentially re-challenge higher price points. The daily Stochastic showing %K above %D at 85.98/49.79 also supports a bullish bias, although it is approaching overbought territory, suggesting caution.
The trigger for such a bullish scenario would likely be a combination of positive economic news, perhaps indicating cooling inflation or a resilient labor market that doesn't necessitate further aggressive Fed tightening, coupled with a weakening dollar. If the Nasdaq100 can successfully hold above the $28,997.34 support level, it would invalidate any immediate bearish pressures. The ADX on the 4H chart at 33.93 indicates a strong trend is already in place; a bullish breakout would simply align with this existing trend strength. The key would be to see buyers step in with conviction, pushing the index through the $29,537.77 ceiling and establishing a new higher low above the current trading range.
Bullish Scenario: Rally Towards $30,000
30% ProbabilityThe Bear Case: Retreat to Lower Ground
Conversely, the bearish scenario hinges on the Nasdaq100 failing to hold its ground at the current price levels and succumbing to selling pressure. The 1-hour RSI at 37.41 and negative MACD histogram are early indicators that bears might be gaining traction. A decisive break below the $28,997.34 support level would be the primary trigger for this scenario. If this support fails, the next logical target would be the $28,997.34 support itself, followed by the $28,298.80 level. The daily chart's RSI at 45.35 suggests a downward bias is possible, and the ADX at 47.51 on the daily chart indicates a strong trend could be forming if the breakdown occurs.
The invalidation of this bearish thesis would be a strong bounce from the $28,997.34 support, or ideally, a close back above the $29,537.77 resistance. Factors that could fuel this bearish move include disappointing economic data, hawkish commentary from the Federal Reserve, or a significant geopolitical event that dampens risk appetite globally. The correlation with a strengthening DXY (currently at 99.68) would also support a move lower in the Nasdaq100. If the index falls below $28,997.34, the path of least resistance could lead to a retest of the $28,298.80 support, and potentially further down towards $27,882.01 if the selling pressure intensches.
Bearish Scenario: Testing $28,298 Support
65% ProbabilityThe Neutral Ground: Range-Bound Uncertainty
In the absence of a clear catalyst, the Nasdaq100 could remain range-bound, oscillating between the immediate support and resistance levels. This scenario is plausible given the conflicting signals from various timeframes and indicators. The 1-hour chart shows a neutral RSI (53.56) and MACD momentum that is balancing, while the 4-hour chart exhibits positive momentum. This tug-of-war could lead to sideways price action, with the index potentially trading between $28,997.34 and $29,537.77 for an extended period. Such consolidation phases are common as markets digest new information or await key economic events, such as upcoming employment or inflation data releases.
During a neutral phase, volatility might decrease, and trading opportunities could become more tactical, focusing on intraday swings or range-bound strategies. The ADX values across different timeframes (1H: 24.57, 4H: 33.93, 1D: 25.14) suggest that while a trend might be present, its conviction can vary, allowing for periods of consolidation within that trend. The key would be to watch for signs of accumulation or distribution within this range. If the index consistently tests the upper bounds of the range without breaking through, it could indicate underlying weakness, while repeated tests of the lower support without a decisive break might suggest accumulation. The DXY's current neutral stance also supports this possibility of indecision.
Consolidation Phase: Waiting for Clarity
35% ProbabilityWhat's Next: Watching the Triggers
The immediate future for the Nasdaq100 will likely be dictated by upcoming economic data and any shifts in central bank rhetoric. Traders should be closely monitoring US employment figures, inflation reports, and any official statements from Federal Reserve officials. These events have the potential to provide the catalyst needed to break the current stalemate. The correlation with the DXY and broader equity markets like the S&P 500 will also be critical to watch. A clear directional move in either of these could provide a strong indication of the Nasdaq100's likely path.
From a technical perspective, the $28,997.34 support level remains the most crucial point to watch. A failure to hold this level could initiate a significant sell-off, targeting lower support zones. Conversely, a decisive break above the $29,537.77 resistance, coupled with strong volume, could signal the start of a renewed upward trend. The conflicting signals from different timeframes and indicators suggest that a period of consolidation or a sharp move driven by unexpected news is more probable than a steady, grinding trend in either direction in the very short term. Patience and disciplined risk management will be key.
Frequently Asked Questions: Nasdaq100 Analysis
What happens if the Nasdaq100 breaks below the $28,997.34 support level?
A close below $28,997.34 on the Nasdaq100 would invalidate the current neutral stance and likely trigger a move towards the $28,298.80 support. This could be fueled by negative economic data or hawkish Fed commentary, increasing selling pressure.
Should I buy the Nasdaq100 at current levels near $29,373.64 given the mixed RSI signals?
Buying at current levels requires caution due to conflicting RSI signals (1H: 37.41 vs 4H: 60.25). A safer approach might be to wait for a confirmed break above $29,537.77 resistance or a clear bounce from $28,997.34 support, with a 65% probability favoring a move lower from current indecision.
Is the negative MACD histogram on the 1H chart a sell signal for the Nasdaq100?
The negative MACD histogram on the 1H chart does suggest bearish momentum is present in the short term. However, this is counteracted by positive momentum on the 4H chart, indicating that the overall trend might not yet be definitively bearish.
How might upcoming US employment data affect the Nasdaq100's direction this week?
Stronger-than-expected employment data could reinforce Fed tightening bets, potentially pressuring the Nasdaq100. Conversely, weaker data, like the recent ADP report, could fuel hopes of a Fed pause, offering a potential bullish catalyst for the index.
| Indicator | Value | Signal | Interpretation |
|---|---|---|---|
| RSI (14) | 37.41 | Bearish | Short-term oversold pressure, but 4H RSI is neutral. |
| MACD Histogram | - | Bearish | Negative momentum on 1H, but positive on 4H. |
| Stochastic | K=8.05, D=9.58 | Bearish | Extreme oversold on 1H, suggesting potential bounce. |
| ADX | 31.29 | Bullish | Strong trend indicated, but direction is uncertain. |
| Bollinger | Middle Band | Watch | Price is below the middle band on 1H, above on 4H/1D. |
Track markets in real-time
AI-powered analysis, technical indicators and real-time price data.
Join Our Telegram Channel
Breaking market news, AI analysis and trading signals instantly.
Join Channel