

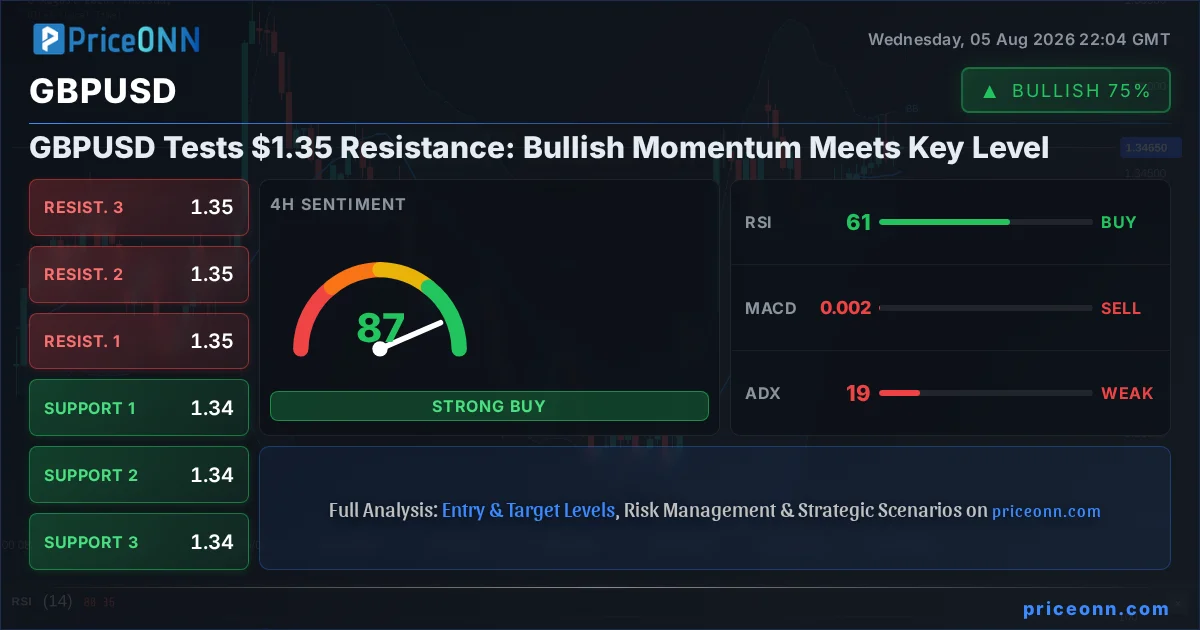
The British Pound Sterling is currently finding itself at a crucial juncture against the US Dollar, with the GBPUSD pair trading precisely at the $1.35 mark. This level, long watched by traders and analysts alike, represents a significant psychological and technical barrier. The recent uptick in bullish momentum suggests a potential challenge to this resistance, but the path forward is far from clear. With the Dollar Index (DXY) showing signs of weakness and risk appetite cautiously returning to markets, the stage is set for a pivotal move. However, conflicting signals from various timeframes and indicators necessitate a deep dive into the intricate dynamics shaping this key forex pair.
- RSI at 61.24 on the 4H chart signals strengthening bullish pressure, but remains in neutral territory, indicating room for further upside.
- Critical resistance sits at $1.34952, a level that has capped rallies previously and now stands as the immediate hurdle.
- MACD on the 1H chart shows negative momentum, contrasting with the broader bullish trend, suggesting potential for short-term pullbacks.
- The correlation with DXY, currently at 99.71 and showing a bearish trend, suggests that a weaker dollar could offer support to GBPUSD.
Navigating the Dollar's Weakness: A Tailwind for Sterling?
The US Dollar Index (DXY) is currently trading at 99.71, and its downward trajectory across multiple timeframes is a significant factor influencing GBPUSD. On the 1-hour chart, the DXY exhibits a strong bearish trend (ADX 36.1) and is trading below its middle Bollinger Band, signaling potential for further declines. This weakness in the dollar acts as a natural tailwind for currency pairs like GBPUSD, potentially allowing Sterling to push higher. Historically, a weaker dollar often correlates with increased risk appetite, which can also benefit the British Pound. The market sentiment appears to be cautiously shifting towards risk-on, as indicated by the S&P 500's upward move of 0.74% to 6572.87. This shift away from safe-haven assets could further embolden buyers in GBPUSD.
However, the narrative isn't entirely straightforward. While the 1-day chart for the DXY shows a neutral trend (ADX 26.01), its RSI at 34.16 and Stochastic at 18.88 suggest oversold conditions. This could imply that the dollar's decline might be nearing a temporary pause or even a reversal, which would then put pressure back on GBPUSD. The interplay between the dollar's direction and global risk sentiment creates a complex backdrop, demanding careful observation of price action and leading indicators.
GBPUSD: Technical Picture on the Hourly Chart
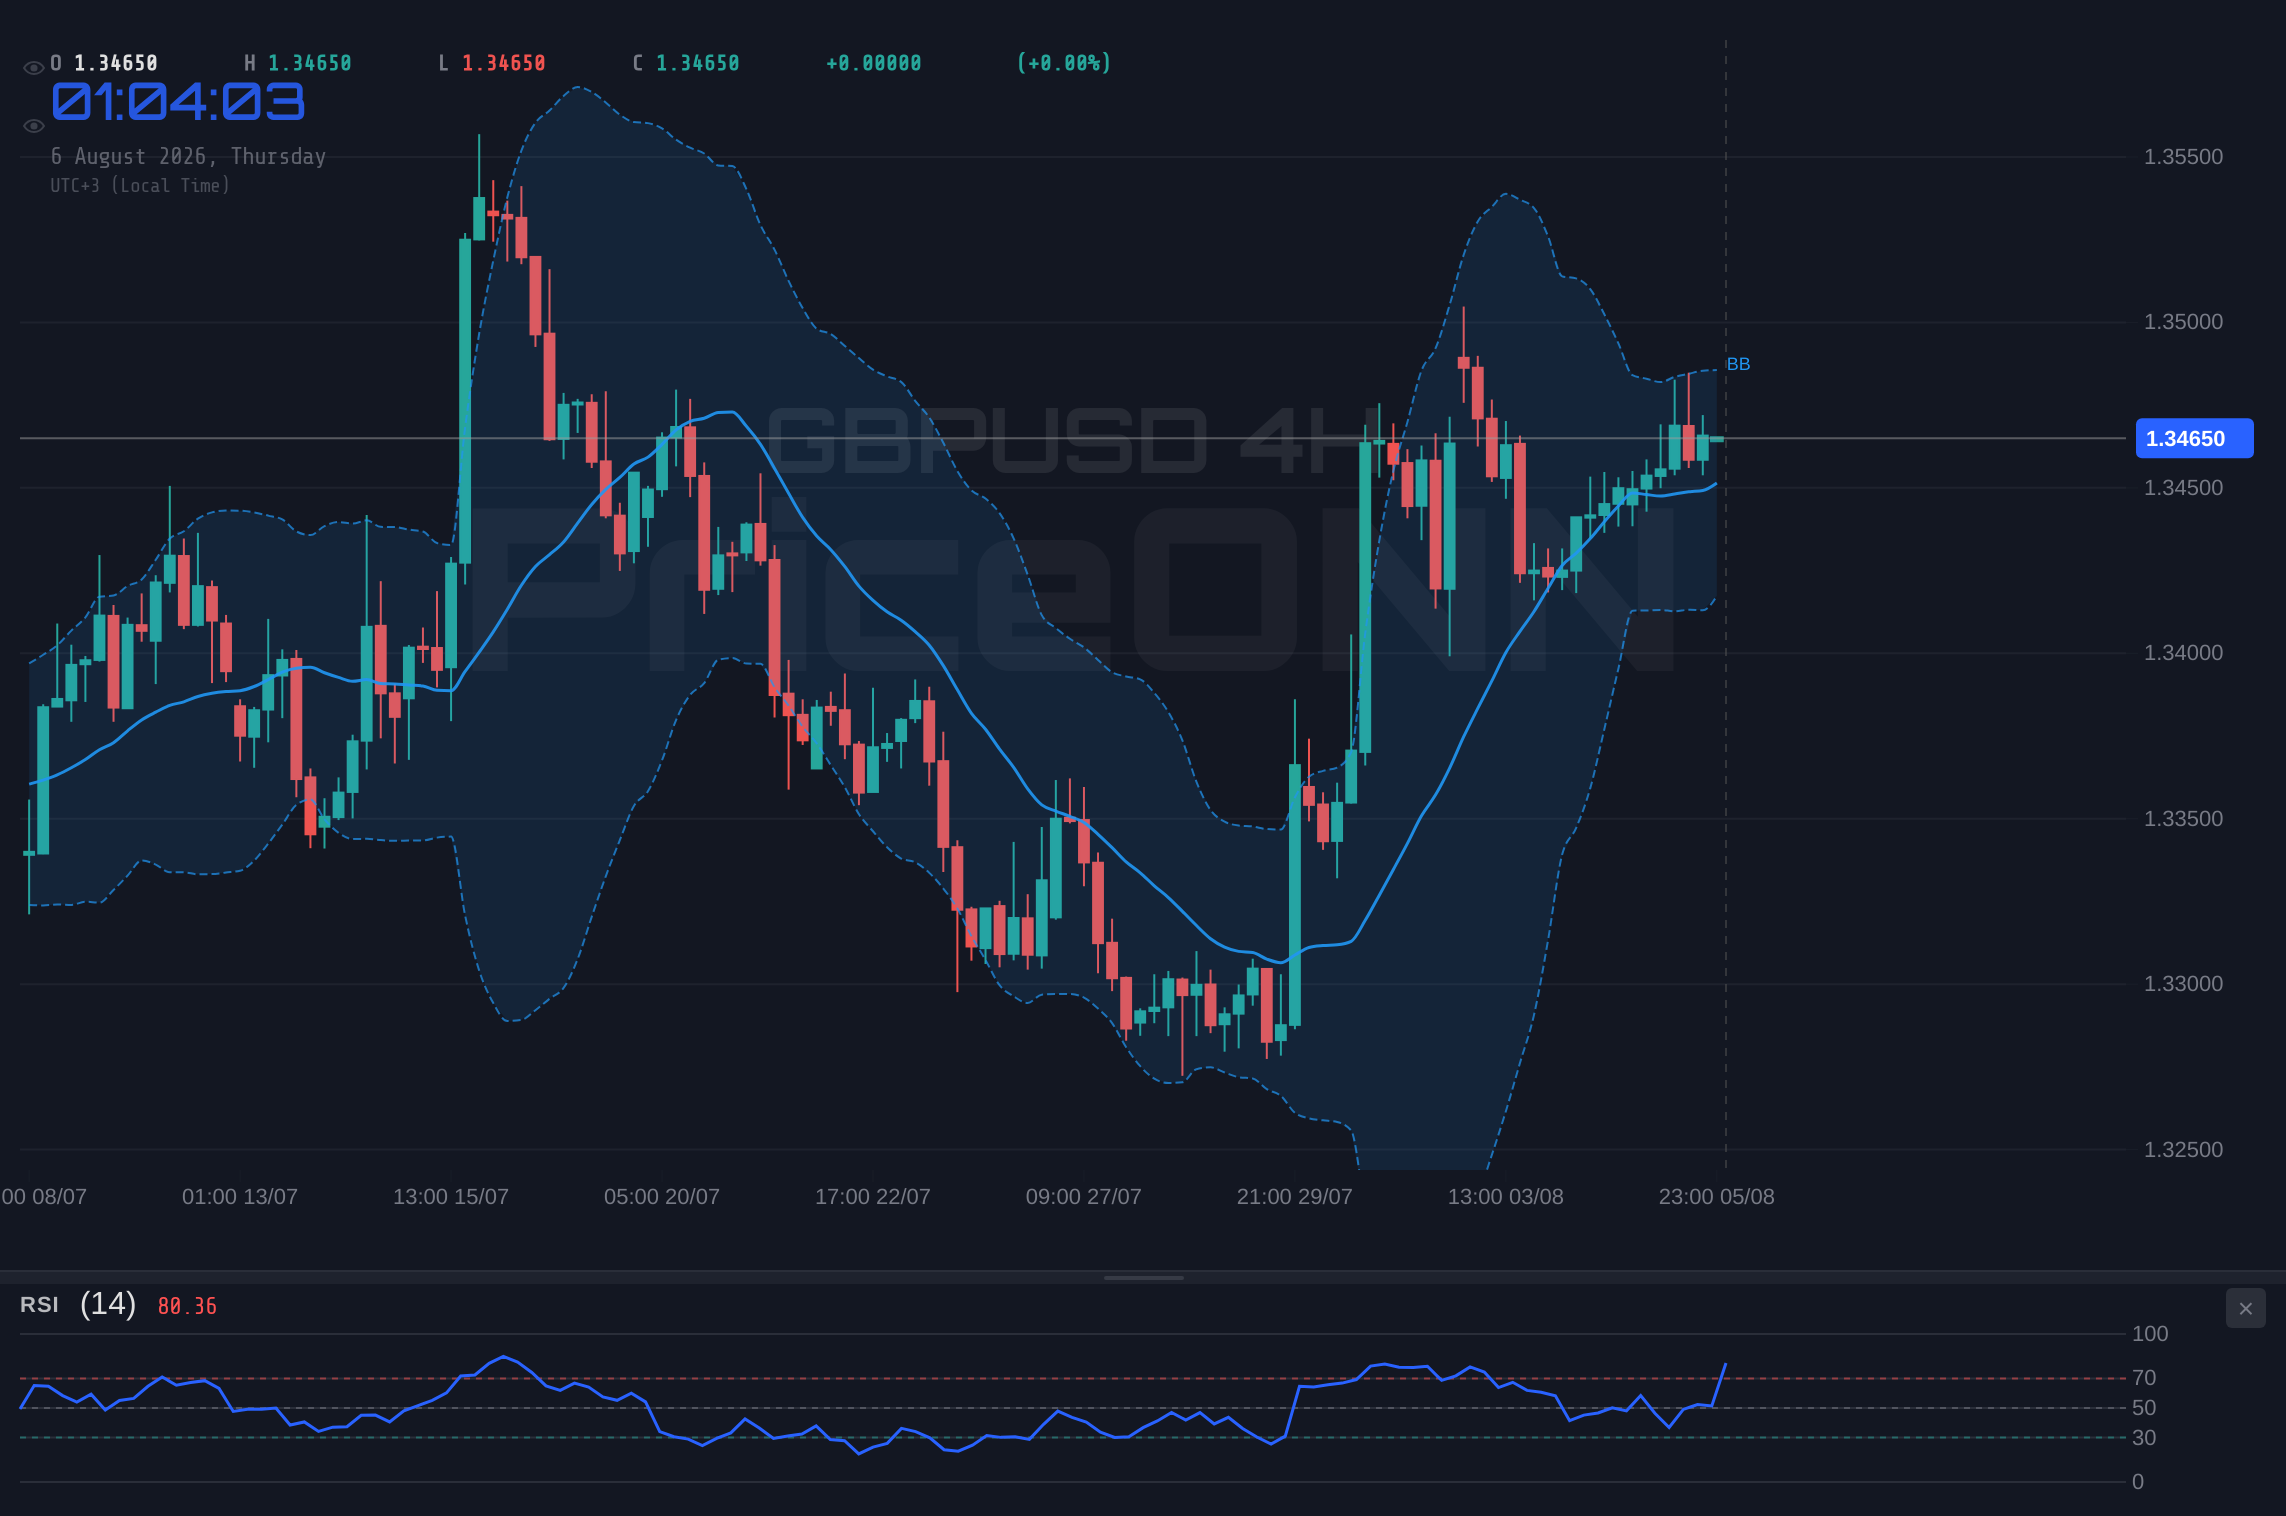
Zooming into the 1-hour timeframe for GBPUSD reveals a pair consolidating around the pivotal $1.35 level. The trend is currently neutral with moderate strength (Power: 50%), reflecting the indecision at this key price point. Immediate support is identified at 1.15494, followed by 1.15464 and 1.15444. These levels, if tested and broken, could signal a short-term pullback. On the resistance side, the immediate hurdle stands at 1.15544, followed by 1.15564 and 1.15594. These are the levels bulls need to conquer to maintain upward momentum.
The technical indicators on this timeframe present a mixed bag. While the ADX at 30.87 suggests a strong trend is present, the MACD is showing negative momentum, indicating that the buying pressure might be waning. The Stochastic Oscillator, with %K at 58.08 and %D at 68.96, is giving a bearish signal (%K
The 4-Hour Perspective: Building Bullish Momentum
Shifting to the 4-hour chart, the picture for GBPUSD becomes more constructive. Here, the trend is clearly defined as bullish with strong conviction (Power: 100%). The current price of 1.15542 is well above the middle Bollinger Band, and the upper band is being tested, suggesting upward momentum is building. Support levels are more distant on this timeframe, located at 1.15376, 1.15302, and 1.15209. A break below these would indicate a more significant shift in sentiment, but currently, they appear to be solid floors.
The RSI stands at 68.71, firmly in neutral territory but showing a strong upward bias, indicating that buyers have room to push prices higher without immediately entering overbought conditions. The Stochastic Oscillator, however, is flashing an overbought warning, with %K at 82.35 and %D at 81.25. This divergence between the RSI's room to move and the Stochastic's overbought signal is something to watch closely. It suggests that while the trend is bullish, the pace might become unsustainable in the very short term, potentially leading to a period of consolidation or a minor pullback before the next leg higher. The ADX at 21.67 indicates a moderately strong trend, reinforcing the bullish outlook on this timeframe.
Daily Chart Insights: The Big Picture and Long-Term Trend
On the daily chart, GBPUSD presents a neutral trend (Power: 50%), indicating a period of equilibrium or consolidation after recent moves. The price action around 1.15542 is currently testing the upper boundaries of its recent trading range. Key resistance levels loom above at 1.15415, 1.15533, and crucially, 1.15734. A decisive break above the latter would be a significant bullish signal, potentially opening the door for a more substantial upward move.
Support levels on the daily chart are found at 1.15096, 1.14895, and 1.14777. A drop below these could signal a reversal of the recent bullish bias. The indicators on the daily timeframe show a generally positive outlook. The RSI at 63.18 is in the neutral zone, suggesting room for growth. The MACD is showing positive momentum with the MACD line above the signal line, a classic bullish signal. The Stochastic Oscillator, with %K at 86.12 and %D at 78.01, is in overbought territory and showing a bullish crossover (%K > %D), reinforcing the upside potential. The ADX at 25.41 indicates a strong trend, which, combined with the other indicators, suggests that if the pair can break through its daily resistance, the move could be significant.
Intermarket Analysis: DXY, Equities, and the Commodity Complex
The performance of GBPUSD cannot be viewed in isolation. Its correlation with the US Dollar Index (DXY) is paramount. As noted, the DXY is currently showing bearish signs across multiple timeframes, trading at 99.71. This weakness provides a supportive environment for GBPUSD. A continued slide in the dollar, perhaps exacerbated by fading Federal Reserve rate hike expectations – a sentiment reinforced by recent weak ADP employment data (44k vs expectations) – could fuel further upside in the Sterling pair. The fact that GBP/USD was noted to be pushing higher if buyers held control above 1.3400, as reported recently, aligns with this narrative.
Equities also play a crucial role. The S&P 500 is trading at 6572.87, up 0.74% on the day, indicating a return of risk appetite. This 'risk-on' environment typically benefits currency pairs like GBPUSD, especially when the US dollar is weakening. Conversely, a sharp sell-off in equities, perhaps triggered by negative economic data or geopolitical tensions, could quickly reverse the fortunes of GBPUSD, pushing it lower as investors flock back to the perceived safety of the dollar. The current divergence, with the Nasdaq 100 showing a 1H bearish trend (ADX 37.87) while the S&P 500 rallies, adds another layer of complexity, suggesting tech-heavy indices might be facing headwinds that don't necessarily translate to a broad risk-off move.
Commodities, particularly oil, also offer insights. Brent crude is trading around $78.68, showing a recent upward trend. Rising oil prices can be a double-edged sword: they can signal increased global demand (risk-on) but also contribute to inflation concerns, potentially leading central banks to maintain tighter monetary policies, which could support the dollar. However, in the current environment, the inflationary aspect of rising oil prices seems to be overshadowed by the broader dollar weakness and risk-on sentiment.
Geopolitical and Macroeconomic Undercurrents
Beyond the charts, macroeconomic data and geopolitical events are constantly shaping the currency landscape. While specific UK economic data releases are not provided in this snapshot, general market sentiment towards the Sterling is influenced by expectations for the Bank of England's monetary policy. Any hints of a more hawkish stance, or conversely, signs of economic weakness that might prompt a pause or cut, would significantly impact GBPUSD. Similarly, US data releases, such as employment figures and inflation reports, heavily influence Fed policy expectations and, by extension, the dollar's strength.
Recent news highlights the sensitivity of markets to economic data. The weak US ADP employment report, for instance, reinforced the market's conviction that the Fed might be nearing the end of its tightening cycle. This sentiment shift can rapidly alter currency pair dynamics. Geopolitical risks, though not overtly dominating headlines today, always remain a background factor. Any escalation of tensions in Eastern Europe or the Middle East could trigger a flight to safety, boosting the dollar and potentially reversing any gains in GBPUSD. Conversely, de-escalation could further fuel risk-on sentiment, benefiting Sterling.
Navigating the $1.35 Level: What Traders Should Watch
The immediate focus for GBPUSD traders remains squarely on the $1.35 area. A sustained break above the resistance at 1.15544, and more importantly, above the daily resistance at 1.15734, would be a strong signal for further upside. This would likely require continued dollar weakness and positive risk sentiment. The 4-hour chart, with its bullish trend and RSI at 68.71, suggests this is the path of least resistance if key levels are cleared.
Conversely, failure to break higher at the current resistance could lead to a retracement. The hourly chart's negative MACD momentum and the Stochastic nearing overbought territory serve as cautionary signals. If GBPUSD falters, the support levels at 1.15494 on the hourly and 1.15376 on the 4-hour chart would be the first lines of defense. A decisive close below these levels could signal a deeper correction, especially if the DXY finds footing or risk sentiment deteriorates.
Bearish Scenario: Resistance Holds Firm
35% ProbabilityConsolidation Scenario: Choppy Price Action
30% ProbabilityBullish Scenario: Resistance Breakout
35% ProbabilityThe Road Ahead: Watching for Confirmation
The technical indicators present a slightly divergent picture, with the 4-hour chart showing strong bullish signals (RSI 68.71, ADX 21.67) while the 1-hour chart introduces caution with negative MACD momentum and Stochastic nearing overbought. The daily chart, however, maintains a neutral-to-bullish bias, awaiting a decisive move. The critical resistance at 1.15734 on the daily chart is the key level to watch. A confirmed breakout above this point, especially if accompanied by sustained dollar weakness and positive equity market performance, could signal the start of a more significant rally. Conversely, failure to break this level could see GBPUSD revert to its support levels, potentially testing the 1.15300 area.
Traders should remain vigilant for confirmation. A bullish scenario requires price action to decisively break and hold above the aforementioned daily resistance, supported by continued dollar weakness and a risk-on environment. The alternative, a bearish scenario, would be signaled by a failure to overcome the immediate resistance, leading to a potential test of lower support levels, particularly if the DXY finds renewed strength or risk aversion creeps back into the markets. The neutral scenario suggests a period of consolidation, where price may oscillate between the hourly resistance and support levels, offering range-bound trading opportunities but lacking a clear directional conviction until a breakout occurs.
Frequently Asked Questions: GBPUSD Analysis
What happens if GBPUSD breaks above the $1.15734 resistance level?
A decisive break above the $1.15734 daily resistance level, especially with strong volume and continued dollar weakness, would likely signal a continuation of the bullish trend. This could open the door for targets towards $1.15900 and potentially $1.16150, supported by positive market sentiment.
Should I buy GBPUSD at current levels of $1.15542 given the mixed signals?
Entering a long position at current levels carries risk due to the proximity of resistance at $1.15734 and conflicting hourly signals. A more prudent approach might be to wait for a confirmed breakout above resistance or a pullback to a clear support level like $1.15376, offering a better risk-reward ratio.
Is the RSI at 68.71 on the 4H chart a buy signal for GBPUSD?
An RSI of 68.71 indicates strengthening bullish momentum but is not yet in overbought territory (typically above 70). While it supports a bullish outlook, it's crucial to consider it alongside other indicators like the Stochastic, which is nearing overbought, and the overall trend context to avoid premature entries.
How might the upcoming ADP employment data affect GBPUSD this week?
Weak ADP employment data, as recently reported (44k vs expectations), reinforces the market's belief that the Fed may be done with rate hikes. This can lead to dollar weakness, which would likely support GBPUSD, potentially aiding a push towards higher resistance levels if other factors remain favorable.
Technical Outlook Summary
| Indicator | Value | Signal | Interpretation |
|---|---|---|---|
| RSI (14) | 63.18 | Neutral | Supports bullish trend, room to move higher. |
| MACD Histogram | +0.0015 | Bullish | Positive momentum, MACD line above signal. |
| Stochastic | K:86.12, D:78.01 | Bullish | Overbought, but bullish crossover confirmed. |
| ADX | 25.41 | Strong Trend | Indicates a strong trend on daily chart. |
| Bollinger | Middle Band | Watch | Price above mid-band, suggesting upward bias. |
Key Levels
Track markets in real-time
AI-powered analysis, technical indicators and real-time price data.
Join Our Telegram Channel
Breaking market news, AI analysis and trading signals instantly.
Join Channel