

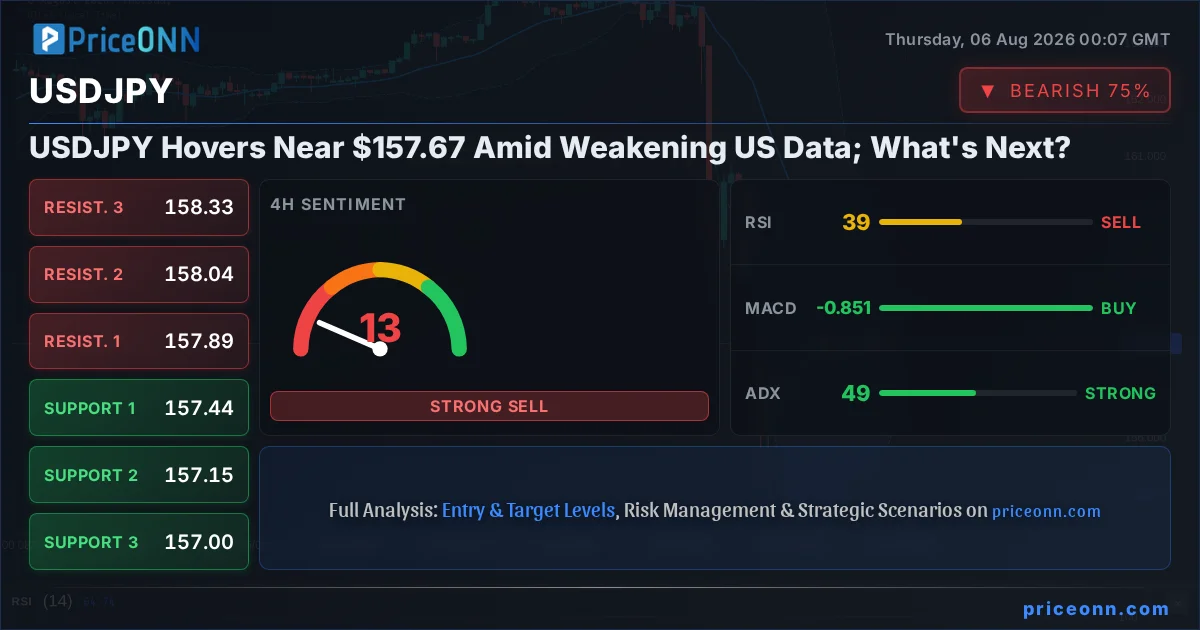
The currency markets are currently navigating a complex landscape, with the USDJPY pair finding itself in a state of consolidation just shy of the significant $157.67 mark. This period of relative calm follows a week marked by notable shifts in economic sentiment, particularly influenced by a softer-than-expected ADP Employment report from the United States. This report has intensified speculation about the Federal Reserve's future monetary policy, suggesting a potential pause in rate hikes, which in turn has cast a shadow over the dollar's recent strength.
- RSI at 51.21 on the 1H chart signals a neutral stance, with no immediate overbought or oversold pressure.
- Critical support for USDJPY sits at $157.20, a level that has historically acted as a floor during periods of consolidation.
- The MACD histogram below the signal line indicates weakening momentum, suggesting a potential shift in short-term direction.
- The correlation with the DXY, currently trading around 99.69, plays a crucial role in USDJPY's movements, with a weaker dollar typically putting downward pressure on the pair.
The narrative surrounding the Federal Reserve's monetary policy has been a dominant theme, and recent data points have only amplified the intrigue. The ADP National Employment Report, released recently, painted a picture of a cooling US labor market, with the number of jobs added falling significantly short of expectations. This crucial piece of data, often seen as a precursor to the more widely watched Non-Farm Payrolls (NFP) report, has reinforced market convictions that the Fed might be nearing the end of its aggressive tightening cycle. For USDJPY, this translates into a complex dynamic: while a less hawkish Fed could typically pressure the dollar lower, the pair's trajectory is also heavily influenced by the Bank of Japan's (BOJ) own policy stance and yield differentials.
On the technical front, the USDJPY pair's current posture near $157.67 reflects a market in equilibrium, at least in the short term. The 1-hour RSI(14) hovers at 51.21, a reading that signifies a neutral market condition, neither pushing into overbought nor oversold territory. This suggests that neither bulls nor bears have a decisive upper hand at this immediate juncture. However, looking at the MACD indicator on the same timeframe, we observe a negative momentum reading with the MACD histogram positioned below its signal line. This divergence between the RSI and MACD hints at a potential waning of upward momentum, even if the overall trend doesn't appear to be reversing sharply.
The ADX, a measure of trend strength, on the 1-hour chart stands at a relatively low 11.41. This reading is significant; it indicates a weak trend, suggesting that the recent price action has been more characterized by sideways movement or a lack of strong directional conviction rather than a sustained trend. This aligns with the consolidation narrative. When the ADX is this low, it implies that any breakout from the current range could be sharp, as market participants have been relatively indecisive, allowing positions to build up on either side.
The interplay between the US dollar's strength, driven by Fed policy expectations, and the Japanese yen's safe-haven appeal is critical. While the weak ADP report might suggest a pause from the Fed, the yen's traditional role as a safe haven could be tested if global risk sentiment takes a downturn. Currently, with the DXY around 99.69, the dollar is exhibiting some weakness, which theoretically should cap USDJPY gains. However, the BOJ's continued dovish stance and the widening interest rate differential remain powerful underlying forces supporting the pair.
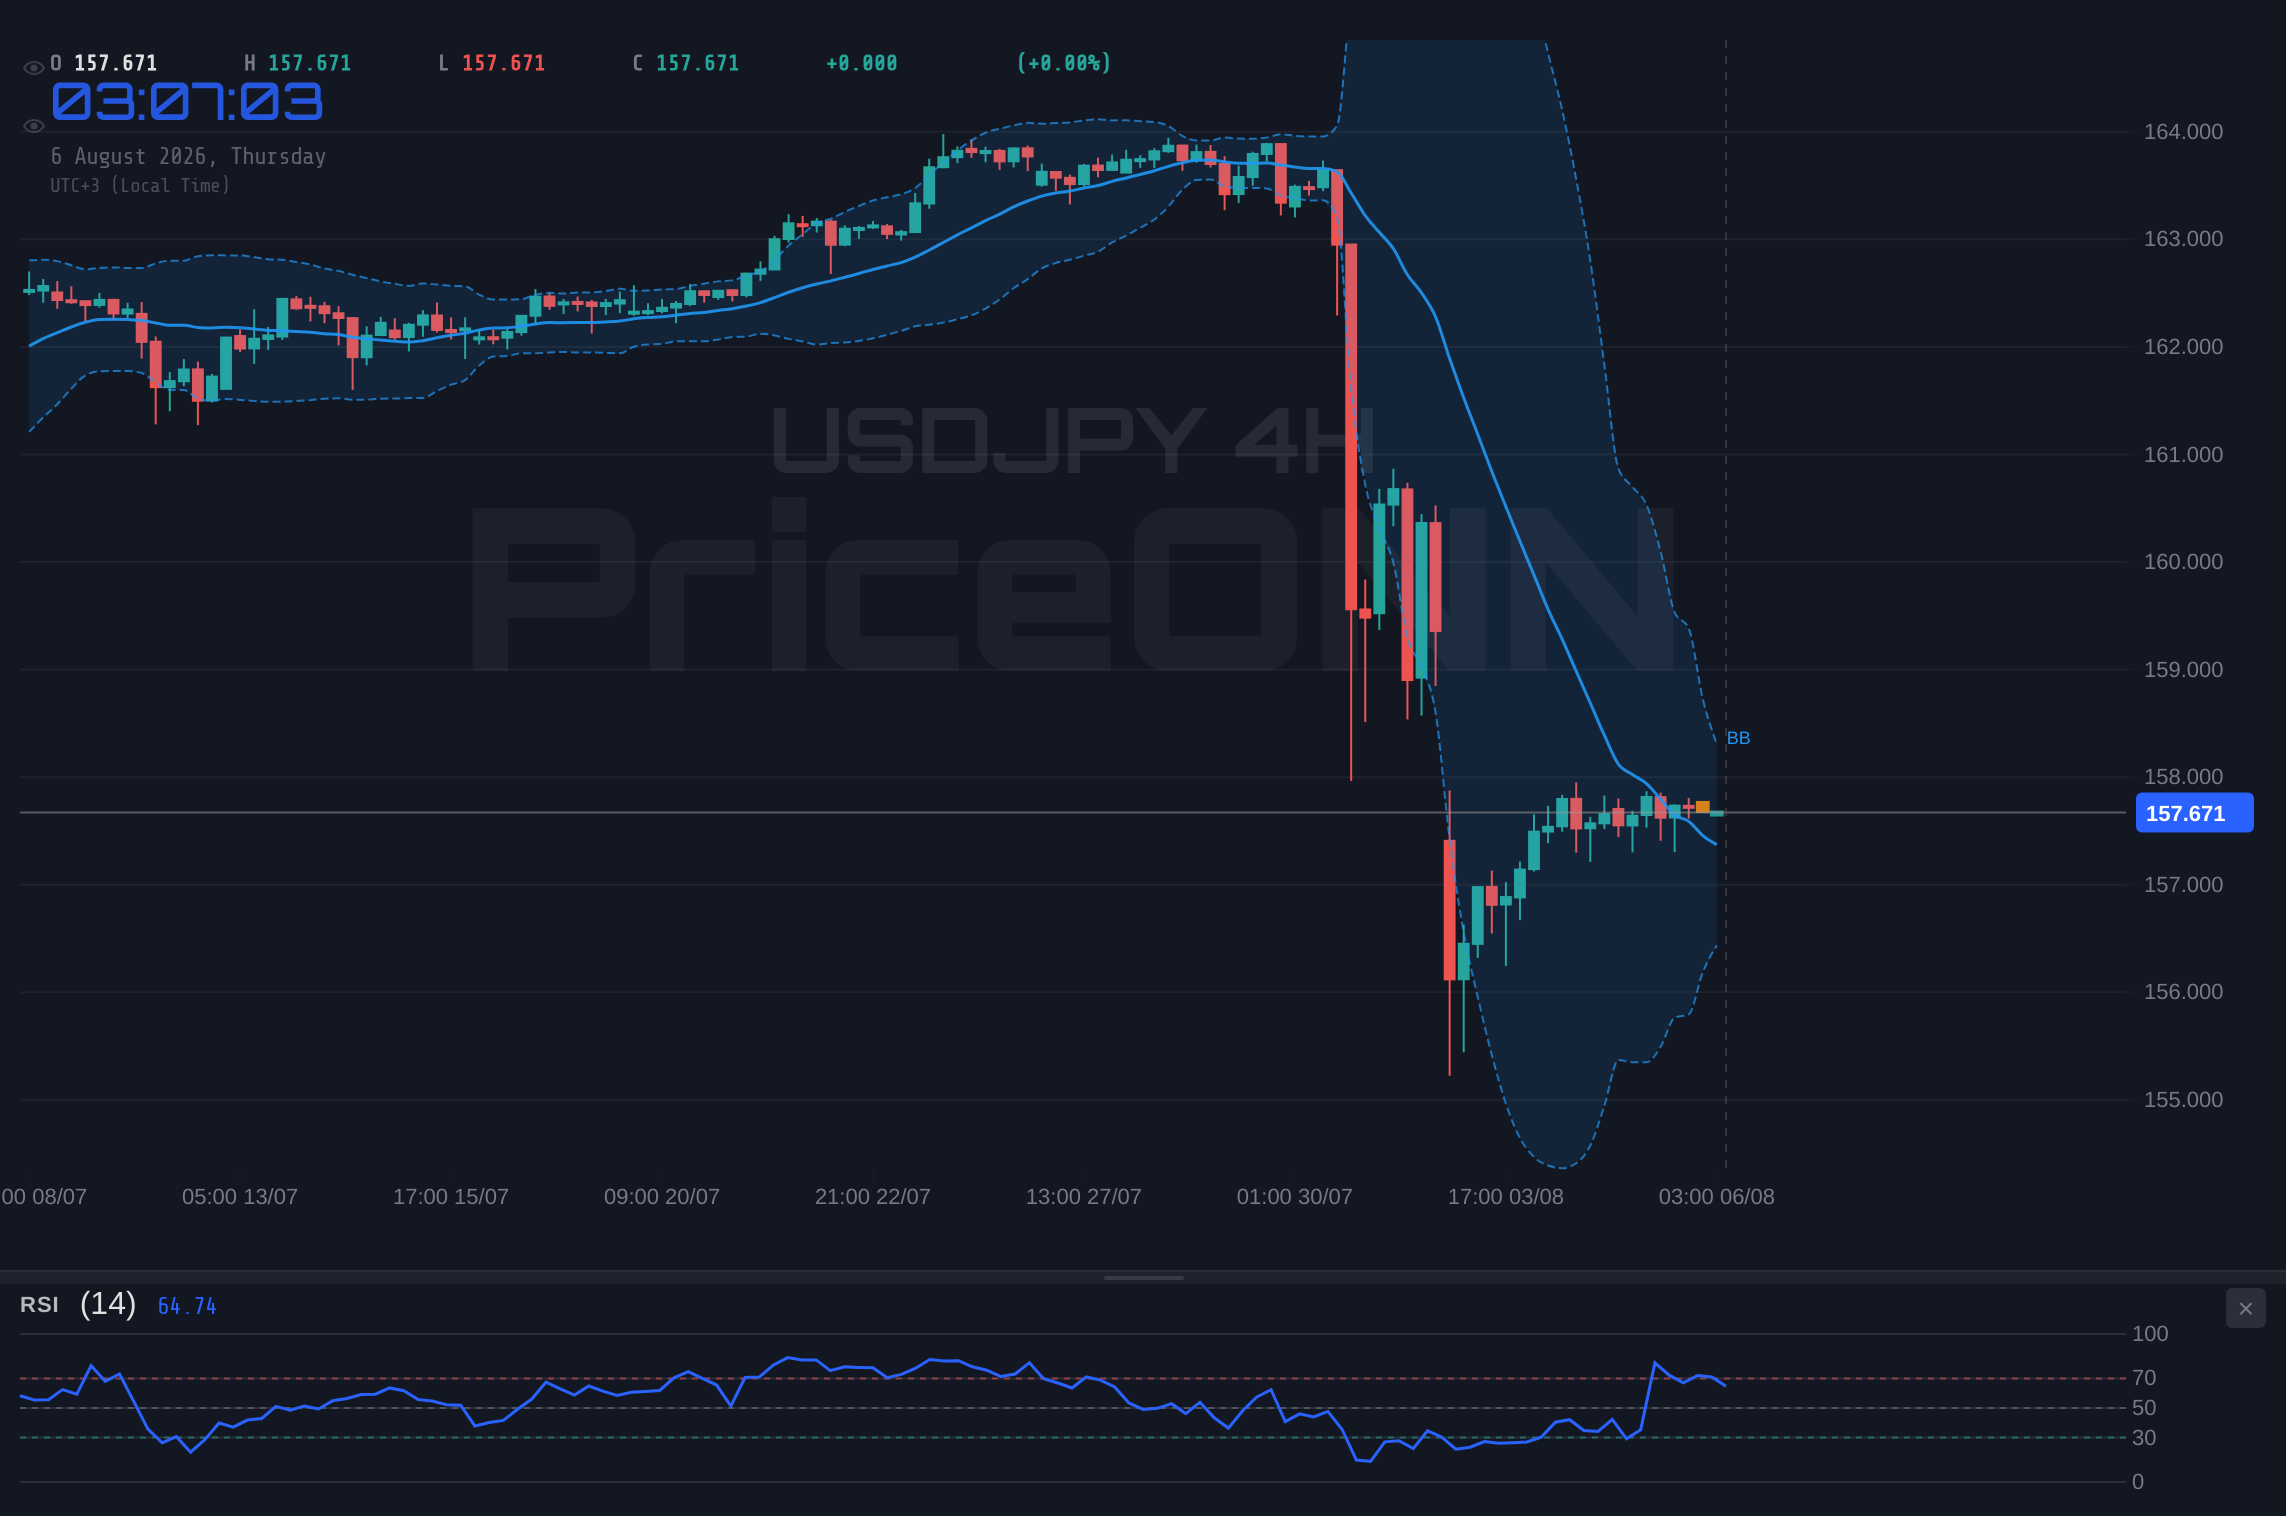
Examining the 4-hour timeframe for USDJPY provides a slightly different perspective, although the overarching theme of consolidation persists. The trend here is technically classified as 'Düşüş' (Downtrend) with a strength of 100%, which might seem contradictory given the current price action. However, this designation likely reflects the broader context of the pair having recently retreated from higher levels. The RSI(14) on this timeframe is at 38.68, moving towards oversold territory but still holding neutral. This suggests that while there might be some selling pressure, it hasn't reached extreme levels yet, leaving room for a potential bounce or continued decline.
The MACD on the 4-hour chart presents a more bullish picture, showing positive momentum with the MACD line above the signal line. This contrasts with the 1-hour MACD and highlights the conflicting signals across different timeframes, a common characteristic of consolidating markets. Bollinger Bands on this timeframe are also positioned above the middle band, indicating an upward bias, but the Stochastic oscillator, with K=62.68 and D=73.4, shows a bearish signal (%K
The ADX on the 4-hour chart is at 49.4, indicating a strong downtrend. This reading, much like the trend classification, reflects the downward pressure that has characterized the pair in recent times, even if the immediate price action is more range-bound. The overall signal for the 4-hour chart leans towards 'SAT' (Sell), reflecting the strength of the downtrend as indicated by the ADX and the Stochastic's bearish crossover, despite some conflicting signals from the MACD and Bollinger Bands.
The divergence between the 1-hour and 4-hour MACD readings is a key point to watch. A positive MACD on the 4-hour chart, suggesting underlying bullish momentum, could eventually override the short-term bearish signals on the 1-hour chart, especially if key support levels hold. Conversely, if the 1-hour MACD's negative momentum intensifies and the ADX continues to signal a strong downtrend, the pair could be poised for a further descent towards the lower support levels.
Shifting to the daily timeframe, USDJPY presents a neutral trend with a power of 50%. The RSI(14) at 27.66 is notably in the oversold territory, a reading that traditionally signals potential buying opportunities. This is a significant observation, as it suggests that the recent selling pressure might have been overdone, potentially setting the stage for a corrective bounce. The MACD on the daily chart, however, shows negative momentum with the MACD line below the signal line, reinforcing the idea that the broader trend, despite the oversold RSI, has been bearish.
The Bollinger Bands on the daily chart are below the middle band, indicating a bearish inclination. Yet, the Stochastic oscillator, with K=25.91 and D=38.79, also shows a bearish signal (%K
The 'Genel Sinyal' (Overall Signal) for the daily timeframe is 'SAT' (Sell), driven by the strong ADX and the bearish MACD. However, the extremely oversold RSI and Stochastic readings cannot be ignored. These indicators, when reaching such low levels, often precede significant price corrections upwards. Therefore, while the prevailing trend signals are bearish, the market is potentially ripe for a short-term bullish reversal, contingent on further price action and confirmation from other indicators.
The current situation for USDJPY, with its oversold daily RSI and mixed signals across timeframes, highlights the importance of fundamental drivers. The weak ADP report has indeed put a dent in the dollar's armor, but the underlying interest rate differential between the US and Japan remains a key factor. If the Bank of Japan signals any shift away from its ultra-loose monetary policy, even a minor one, it could significantly alter the dynamics for USDJPY, potentially overriding short-term technical signals.
Correlation analysis further adds layers to this intricate market picture. The Dollar Index (DXY), currently trading around 99.69, is exhibiting weakness, which typically correlates with a decline in USDJPY. A rising DXY often exerts downward pressure on pairs like USDJPY, as it signifies a stronger dollar across the board. With the DXY showing a 'SAT' (Sell) signal on the 1-hour and 4-hour charts, its current weakness supports the idea of USDJPY potentially struggling to maintain higher levels, or even declining further if other factors align.
However, the relationship isn't always linear. The 'Risk Appetite' indicators, such as the S&P 500 (SP500) and Nasdaq 100 (Nasdaq100), are showing mixed signals. The SP500 is in a bullish trend on the 1-hour and 4-hour charts, while the 1-day trend is bearish. The Nasdaq 100 shows a bullish trend on the 4-hour and 1-day charts but a bearish trend on the 1-hour. This mixed picture in equities suggests that global risk sentiment is not definitively leaning towards either risk-on or risk-off, which can create volatility and uncertainty for safe-haven currencies like the Japanese yen.
When risk appetite declines (equities fall), the yen often strengthens as investors seek safety. Conversely, a strong risk-on sentiment can weaken the yen. Currently, the mixed signals in US equities mean that this traditional yen driver is not providing a clear directional cue for USDJPY. This lack of a strong, consistent correlation with risk assets adds another layer of complexity to predicting USDJPY's next move.
The $157.20 support level on the daily chart is absolutely critical. If USDJPY breaks decisively below this level, especially with strong volume, it would invalidate any short-term bullish reversal hopes stemming from the oversold RSI and Stochastic readings. Such a break could signal a deeper correction towards the next significant support at $156.75. Conversely, holding above this level and seeing a confirmed break above the immediate resistance around $157.70 could signal the start of a more sustainable upward move.
Looking at other related currency pairs can also provide valuable context. For instance, EURUSD is showing a generally bullish trend across timeframes, trading near 1.1557. A stronger euro against the dollar could indirectly influence USDJPY if it signals a broader weakening of the US dollar. However, the impact is often secondary to the direct drivers of USDJPY, such as interest rate differentials and risk sentiment. Similarly, GBPUSD is showing a bullish trend on the 1- and 4-hour charts, and a neutral-to-bullish trend on the daily. These movements in major pairs, while informative, do not provide a definitive directional bias for USDJPY on their own.
The energy markets, particularly Brent Crude (currently around $78.52) and WTI Crude (around $76.05), are showing bearish trends on the 1-hour and 4-hour charts, and neutral on the daily. Oil prices are often seen as an inflation indicator, and their current weakness might suggest cooling inflation expectations. This could indirectly support the idea of a Fed pivot, further complicating the outlook for USDJPY. A sustained drop in oil prices could reduce inflationary pressures, potentially leading to a less hawkish stance from central banks globally, including the Fed.
Cryptocurrencies, like Bitcoin (BTCUSD) at $64,609 and Ethereum (ETHUSD) at $1,907.72, are largely showing bullish trends across multiple timeframes, albeit with some mixed signals on the daily charts. The crypto market's performance can sometimes act as a barometer for risk appetite, though its correlation with traditional markets can be inconsistent. The current bullish sentiment in crypto might suggest a general 'risk-on' environment, which typically weighs on safe-haven assets like the Japanese yen. However, the fact that USDJPY is consolidating rather than surging higher despite this suggests other factors are at play, most notably the interest rate differential.
The upcoming economic calendar is crucial. The Non-Farm Payrolls (NFP) report, which is on the horizon, will be the next major catalyst. If it comes in significantly weaker than expected, reinforcing the narrative of a Fed pause, it could lead to further dollar weakness and potentially push USDJPY lower. Conversely, a surprisingly strong NFP report could reignite hawkish Fed expectations and support a move higher. Additionally, any hints or policy shifts from the Bank of Japan regarding yield curve control or interest rate policy would be a major event risk for USDJPY.
The current technical setup for USDJPY, characterized by a neutral RSI, bearish MACD momentum on the 1-hour chart, and oversold conditions on the daily RSI and Stochastic, presents a precarious balance. The strong ADX readings across timeframes, particularly the daily's 26.01, indicate that while the trend might be bearish, the market is not necessarily in a slow, grinding decline but rather experiencing periods of directional strength. This means that any move away from the current consolidation range could be swift.
The key takeaway from this analysis is that USDJPY is at a critical juncture, caught between the implications of a softening US labor market and the persistent interest rate differential favoring the dollar. The technical indicators offer conflicting signals, underscoring the market's indecision. Traders should pay close attention to the $157.20 support and the $157.70 resistance levels. A decisive break above resistance, confirmed by increasing volume and positive momentum indicators, could signal a move towards higher targets. However, a break below support, especially with the oversold daily indicators failing to provide a floor, could open the door for a more significant correction.
Frequently Asked Questions: USDJPY Analysis
What happens if USDJPY breaks below the critical $157.20 support level?
A decisive break below $157.20 would likely trigger further selling pressure, potentially invalidating the oversold signals on the daily charts. The next significant support level to watch would be around $156.75, with the downtrend potentially reasserting itself.
Should I consider buying USDJPY at current levels near $157.67 given the daily RSI is oversold at 27.66?
While the oversold RSI at 27.66 presents a potential buy-the-dip opportunity, caution is advised due to conflicting bearish signals from the MACD and strong ADX readings. A confirmed break above $157.70 resistance, coupled with positive momentum, would be a stronger buy signal than current oversold conditions alone.
Is the MACD showing a sell signal for USDJPY on the 1-hour chart at $157.67?
Yes, the 1-hour MACD histogram is below the signal line, indicating negative momentum and a potential short-term bearish signal. This contrasts with the 4-hour MACD, which shows positive momentum, highlighting the conflicting signals across timeframes.
How will upcoming US Non-Farm Payrolls data affect USDJPY this week?
A weaker-than-expected NFP report could reinforce Fed pause expectations, potentially weakening the dollar and pushing USDJPY lower towards support levels like $157.20. Conversely, a strong NFP could revive hawkish Fed sentiment, supporting a move back towards resistance around $157.70.
Track markets in real-time
AI-powered analysis, technical indicators and real-time price data.
Join Our Telegram Channel
Breaking market news, AI analysis and trading signals instantly.
Join Channel