

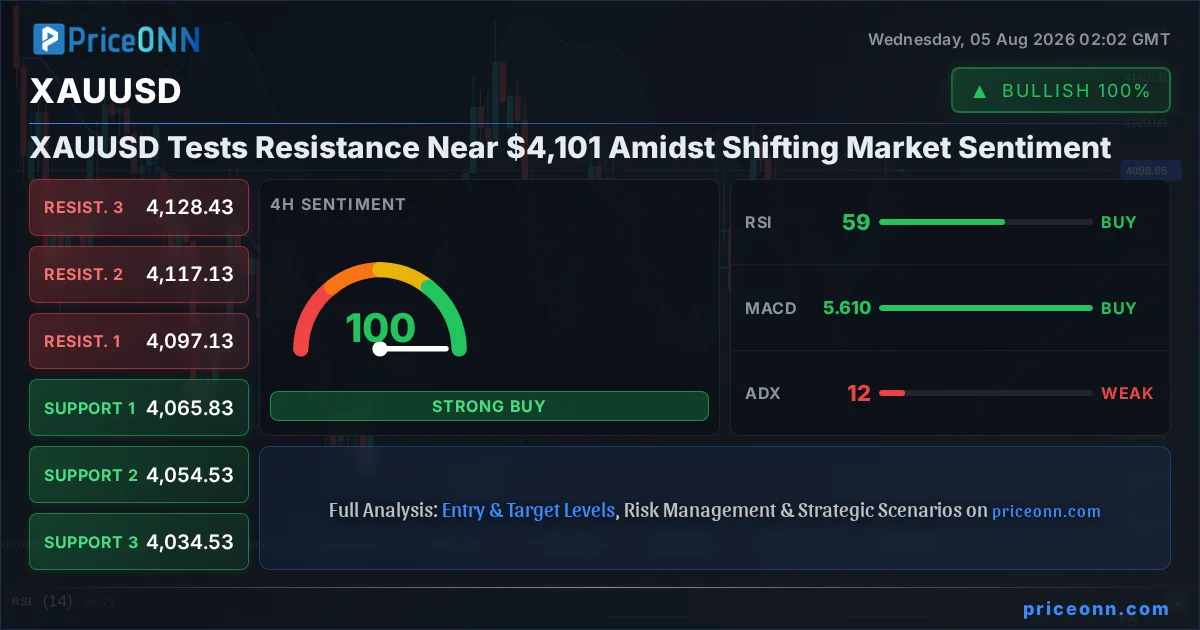
The relentless ascent of gold has brought XAUUSD to a critical juncture, now testing resistance levels near the $4,101 mark. This pivotal moment is a battleground where bullish momentum clashes with emerging bearish signals, forcing traders to scrutinize every tick and every economic whisper. The question on every trader's mind: is this merely a pause before the next leg up, or the beginning of a significant correction? Having tracked XAUUSD through its recent volatile swings, it's clear that the market sentiment is at a crossroads, influenced by a complex interplay of inflation concerns, central bank policy expectations, and the ever-present geopolitical backdrop.
- Gold's price action shows a clear test of resistance around $4,101.18, with RSI at 66.71 on the 1-hour chart indicating neutral but upward momentum.
- Critical support for XAUUSD is currently eyed at $4,073.79 (1H) and $4,065.83 (4H), while resistance hovers around $4,099.79 (1H) and $4,117.13 (4H).
- The MACD on the 1-hour chart displays positive momentum, but the daily Stochastic %K (45.78) is beginning to dip below %D (46.83), hinting at potential caution.
- Correlations with the DXY, currently at 99.92, show a weakening dollar potentially supporting gold, while mixed signals from SP500 (6572.87) suggest caution in risk appetite.
The narrative supporting higher gold prices remains compelling, rooted in persistent inflation fears and the potential for central banks, particularly the Federal Reserve, to pivot towards more accommodative policies. While recent data points might suggest a cooling economy, the underlying inflationary pressures, exacerbated by geopolitical tensions and supply chain fragilities, continue to fuel demand for gold as a hedge. Analysts are closely watching upcoming economic releases, such as PMI data and employment figures, for clues on the trajectory of core inflation and the Fed's next move. The Fresnillo profit report, tripling on gold and silver rallies, underscores the strength in precious metals, suggesting that institutional interest remains robust.
The Bull Case: Why Gold Could Extend Its Rally
On the bullish front, the 1-hour and 4-hour technical indicators paint a largely optimistic picture for XAUUSD. The 1H trend strength is an impressive 86%, with the RSI hovering at 66.71, indicating that while not yet overbought, the momentum is clearly pushing upwards. The MACD is showing positive momentum, consistently above its signal line, reinforcing the idea of sustained buying pressure. Stochastic oscillators on the 1H chart are also signaling a bullish crossover (%K at 49.03, %D at 41.92), suggesting further upward movement is likely. Even on the daily chart, despite some conflicting signals, the RSI is at 50.42 and showing an upward trend, and the MACD remains positive, suggesting that the longer-term trend might be reasserting itself.
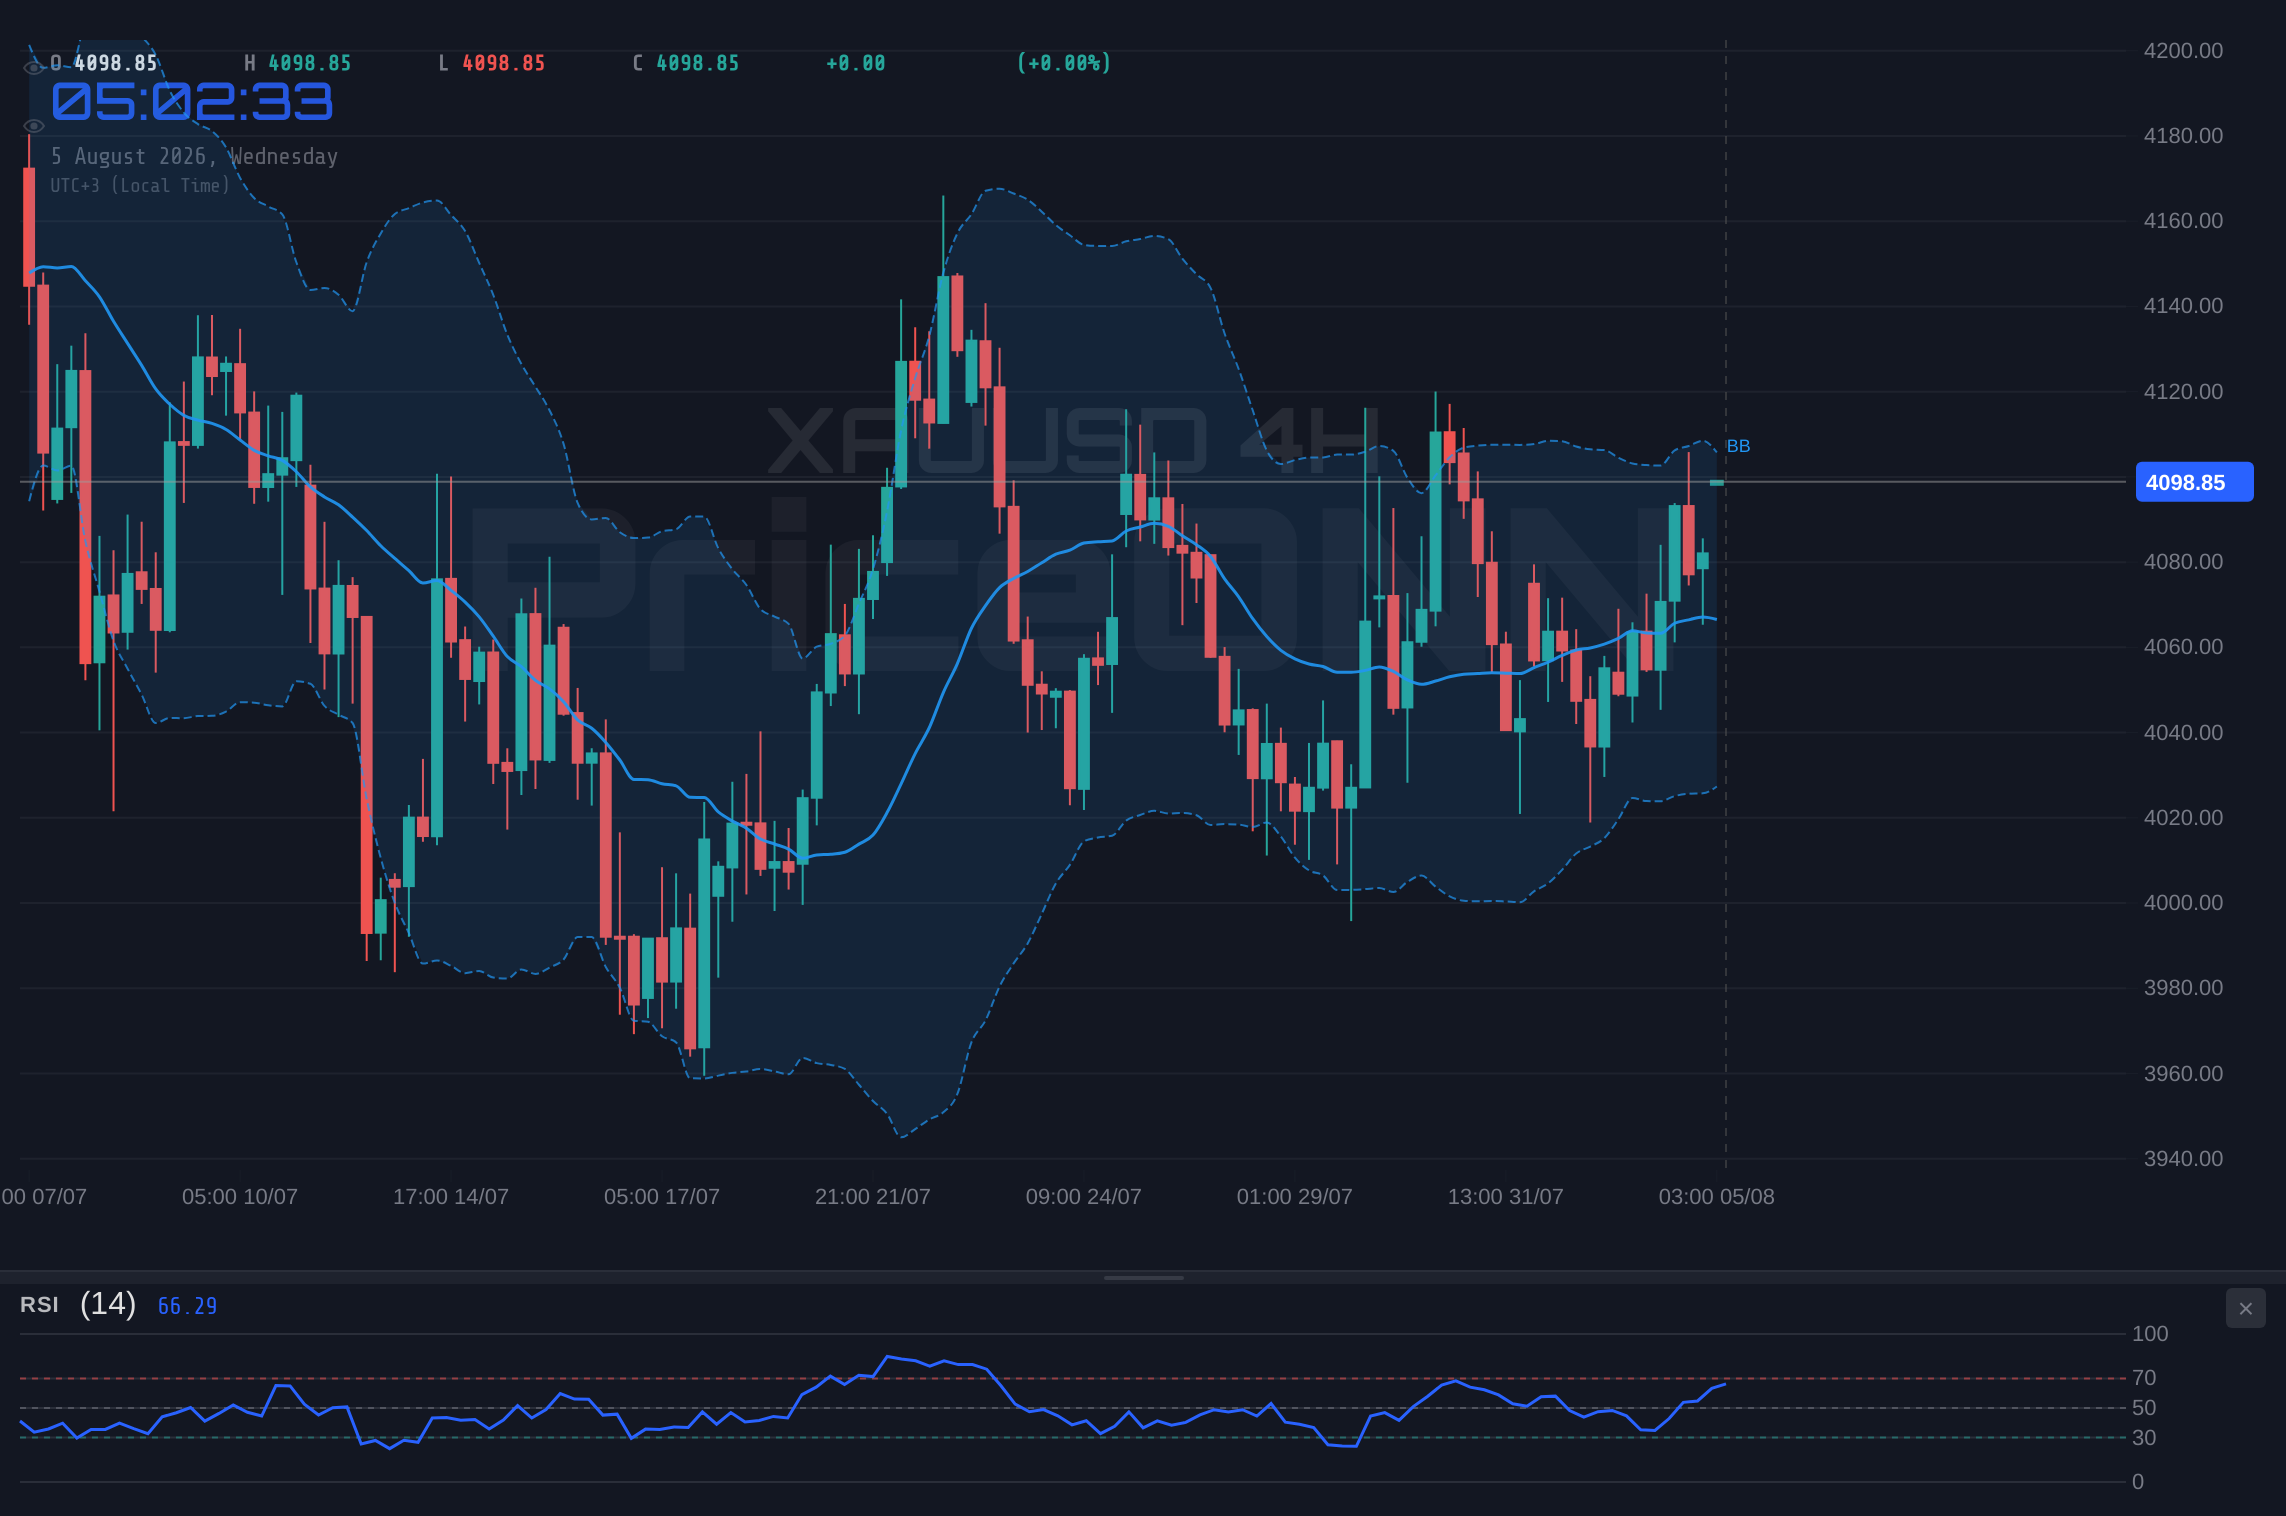
Furthermore, the current price action near $4,101.18 positions gold above key intraday support levels, such as $4,073.79 and $4,065.83 on the 1-hour timeframe, and $4,065.83 and $4,054.53 on the 4-hour timeframe. The fact that these levels are holding, or have recently been tested and held, provides a psychological and technical floor. The broader macroeconomic environment also lends support. With the DXY (Dollar Index) currently trading at 99.92 and showing a slight downward bias on the 1-hour chart, a weaker dollar typically translates into stronger gold prices, as it becomes cheaper for holders of other currencies. This inverse correlation is a classic driver for gold, and its re-emergence would be a significant tailwind.
The geopolitical landscape continues to be a significant tailwind for gold. Ongoing global uncertainties, from regional conflicts to trade disputes, naturally drive demand for safe-haven assets. While specific headlines can cause short-term volatility, the underlying trend of geopolitical risk remains a constant, providing a structural bid for gold. Analysts are closely monitoring any developments in the Middle East and other flashpoints, as these can quickly shift market sentiment and trigger renewed safe-haven flows into precious metals. The recent report from Fresnillo, highlighting tripled profits due to surging gold and silver prices, is a testament to the underlying strength in the precious metals market, indicating that major producers are benefiting from the current price environment and potentially signaling continued investor interest.
The Bear Case: Caution Amidst Divergences
However, the bullish narrative is not without its counterarguments. A closer look at the longer-term technicals reveals potential cracks in the armor. While the 1H and 4H charts lean bullish, the Daily (1D) timeframe presents a more cautious outlook. The daily trend is officially categorized as 'Düşüş' (Downtrend) with a strength of 93%, and the ADX at 26.32 indicates a strong trend, albeit a bearish one. The daily RSI at 50.42 is neutral but showing an upward trend, which could be interpreted as a pause before further decline rather than a reversal. More concerning for bulls, the daily Stochastic shows %K at 45.78 and %D at 46.83, with %K dipping below %D, a classic bearish signal suggesting that momentum might be shifting downwards.
Moreover, the price is currently testing resistance levels that are crucial for the short-to-medium term outlook. On the 1-hour chart, resistance is seen at $4,086.79, $4,091.52, and $4,099.79. On the 4-hour chart, this resistance extends to $4,097.13 and $4,117.13. A failure to decisively break and hold above these levels could lead to a sharp pullback. The daily resistance is even more significant, with key levels at $4,083.41, $4,111.74, and $4,143.99. If the price is rejected from these upper bounds, we could see a move back towards the daily support levels, which are situated at $4,022.83, $3,990.58, and $3,962.25. The fact that the daily ADX is at 26.32, indicating a strong trend, implies that if a downward move begins, it could have significant momentum.
The broader market correlation also offers a note of caution. While the DXY's slight weakness is supportive of gold, the performance of major equity indices presents a mixed picture. The SP500 is trading at 6572.87 with a daily gain of 0.74%, indicating some risk appetite. However, its 1-hour RSI is at 70.95, nearing overbought territory, which could signal an impending pullback in equities. Such a pullback in risk assets could potentially spill over into gold, especially if it's driven by concerns about inflation or Fed policy. Conversely, the Nasdaq 100's significant 3.28% daily gain to 29753.88 suggests strong tech sector strength, which might temporarily overshadow traditional safe-haven demand for gold if risk sentiment remains elevated.
Weaving the Technical Threads Together
When we synthesize the technical signals across different timeframes, a nuanced picture emerges. The short-term (1H and 4H) charts are clearly in bullish territory, driven by strong momentum and positive indicator readings. The ADX on the 1H chart at 22.97 suggests a moderately strong trend, which aligns with the overall upward price movement. However, the Stochastic on the 4H chart is flashing an 'overbought' signal with %K at 92.46 and %D at 89.77, indicating that the current rally might be extended and due for a breather. This divergence between the momentum indicators and the price action is a classic sign of caution.
The daily timeframe presents the most significant conflict. The trend is officially bearish, yet the price has been pushing higher, creating a divergence. The daily RSI is neutral, and the MACD is positive, but the Stochastic is showing a bearish crossover. This conflict suggests that the market is grappling with conflicting fundamental forces. The bulls are trying to break out of a longer-term downtrend based on inflation and potential Fed dovishness, while the bears are still in control on the daily chart, waiting for a catalyst to resume their pressure. The ADX on the daily chart at 26.32 indicates a strong trend is in play, which means whichever direction the market ultimately commits to, it could be significant.
The current price of $4,101.18 is the focal point. It sits just below the daily resistance of $4,083.41 and within the broader range of daily resistance up to $4,111.74. A decisive break above $4,099.79 on the 1-hour chart, and subsequently above $4,117.13 on the 4-hour chart, would be a strong bullish signal, potentially invalidating the daily bearish trend. Conversely, a failure to hold the intraday supports, particularly the $4,073.79 level, could accelerate a move lower, retesting the $4,065.83 level and potentially heading towards the daily support at $4,022.83. The strength of the ADX on the 1H (22.97) and 4H (11.67) charts suggests that a breakout could be powerful if it occurs, but the weaker ADX on the 4H also hints at the possibility of range-bound trading until clearer direction emerges.
Economic Calendar and Forward Guidance
Looking ahead, the economic calendar is packed with events that could significantly influence XAUUSD's trajectory. Upcoming PMI releases for manufacturing and services sectors in major economies will provide crucial insights into global economic health and inflationary pressures. Stronger-than-expected data could reignite fears of persistent inflation, potentially strengthening the case for continued hawkishness from central banks, which would typically pressure gold. Conversely, weaker data might support the narrative of a slowing global economy, increasing the appeal of safe-haven assets like gold and reinforcing expectations of future rate cuts.
Employment data, such as Non-Farm Payrolls (NFP) and unemployment rates, will be particularly critical. Positive employment figures might suggest economic resilience, but if wage growth remains subdued, it could ease inflation concerns. The market is acutely sensitive to any deviation from expected NFP numbers, as they directly impact Fed policy expectations. Fed officials' speeches, such as those from Fed's Williams, often provide forward guidance. Williams' recent comments focusing beyond oil shocks and on core inflation trends, while expressing confidence in a gradual decline, suggest a data-dependent approach. Any hints of a sooner-than-expected pivot or a more hawkish stance could trigger significant market moves in gold.
The interplay between interest rate expectations and gold prices cannot be overstated. Markets are constantly pricing in the probability of future rate hikes or cuts. Higher interest rates generally increase the opportunity cost of holding non-yielding assets like gold, making them less attractive. Conversely, falling or stable interest rates reduce this opportunity cost, boosting gold's appeal. Traders will be scrutinizing Fed Funds Futures and OIS rates for any shifts in market expectations following upcoming economic data. Any indication that the Fed is nearing the end of its tightening cycle, or even contemplating cuts, would likely provide a substantial boost to XAUUSD.
Bearish Scenario: The Daily Downtrend Resumes
60% ProbabilityBullish Scenario: Breaking the Daily Resistance
30% ProbabilityNeutral Scenario: Consolidation Around Resistance
10% ProbabilityFrequently Asked Questions: XAUUSD Analysis
What happens if XAUUSD breaks decisively above $4,099.79 resistance?
A sustained break above the $4,099.79 resistance level on the 1-hour chart would invalidate the immediate bearish outlook. This could trigger further upside momentum, potentially targeting the $4,117.13 level on the 4-hour chart, and could signal a shift in the longer-term trend.
Should I buy XAUUSD at current levels near $4,101 given the mixed daily signals?
Caution is advised at current levels. While short-term charts show bullish momentum, the daily timeframe presents conflicting signals with a bearish trend and a bearish Stochastic crossover. It would be prudent to wait for confirmation, such as a clear break above daily resistance or a pullback to a more defined support level like $4,073.79, before considering a long position.
Is the daily RSI at 50.42 a buy signal for XAUUSD?
A daily RSI of 50.42 is considered neutral territory and, by itself, is not a strong buy signal. While it indicates a lack of strong selling pressure, the upward trend associated with it on the daily chart needs to be viewed in conjunction with other indicators. The bearish Stochastic crossover and the overall daily downtrend suggest that this neutral reading may not be enough to signal a sustained bullish reversal without further confirmation.
How will upcoming PMI data affect XAUUSD this week?
Upcoming PMI data will be crucial for XAUUSD. Stronger-than-expected manufacturing and services PMIs could signal persistent inflation, potentially leading to renewed Fed hawkishness and pressuring gold prices downwards. Conversely, weaker PMIs might reinforce recession fears, boosting gold's safe-haven appeal and potentially triggering a rally if it leads to expectations of a Fed pivot.
| Indicator | Value | Signal | Interpretation |
|---|---|---|---|
| RSI (14) | 66.71 | Neutral | Approaching overbought on 1H, neutral on 4H/1D. Watch for divergence. |
| MACD Histogram | +0.15 (1H) | Bullish | Positive momentum across timeframes, but watch for fading on daily. |
| Stochastic | K=49.03, D=41.92 (1H) | Bullish | Bullish crossover on 1H, but daily shows bearish crossover. |
| ADX | 22.97 | Moderate Trend | Indicates a trend is present but not yet overwhelmingly strong on 1H. |
| Bollinger Bands | Upper Band Test (1H) | Watch | Price testing upper band on 1H suggests potential for overextension or breakout. |
Track markets in real-time
AI-powered analysis, technical indicators and real-time price data.
Join Our Telegram Channel
Breaking market news, AI analysis and trading signals instantly.
Join Channel