

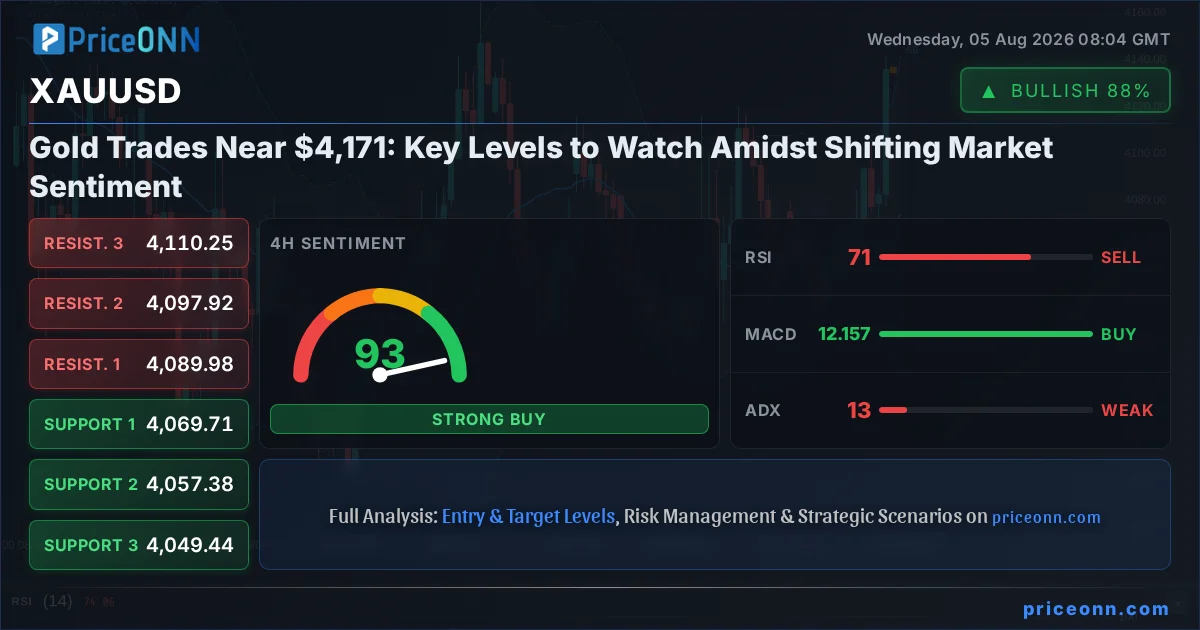
Gold is currently navigating a critical juncture, hovering just below the $4,171.48 mark. This pivotal price point comes amidst a complex interplay of macroeconomic forces, including shifting central bank expectations, a fluctuating dollar index, and evolving risk appetite across global markets. The precious metal has demonstrated remarkable resilience, etching out a significant upward trend on the 1-hour and 4-hour charts, yet the daily outlook presents a more nuanced picture, hinting at potential consolidation or a shift in momentum. Understanding the confluence of these factors is paramount for any trader looking to position themselves effectively in the current gold market landscape. This analysis delves into the intricate technical signals and broader market correlations that are shaping gold's immediate trajectory.
- RSI at 79.55 on the 1-hour chart signals significant overbought pressure, suggesting a potential for pullback or consolidation.
- The critical support level for XAUUSD currently sits at $4,165.68, a level that has shown strength in recent trading sessions.
- The ADX at 37.04 on the 1-hour timeframe confirms a strong uptrend, though the 4-hour ADX at 13.47 indicates waning trend strength over a broader period.
- The DXY at 99.84 is showing signs of weakness, which typically supports gold prices, but its correlation with equities and bond yields adds complexity.
Navigating the Gold Rush: A Technical Deep-Dive
The Ascending Momentum and Its Signals
The 1-hour technicals for XAUUSD paint a picture of robust bullish momentum. The trend is unequivocally upwards, with a strength score of 100%. This is supported by a MACD that remains firmly above its signal line, indicating positive momentum. The RSI(14) stands at a formidable 79.55, firmly entrenched in overbought territory. While this signifies strong buying pressure, it also raises a red flag for potential pullbacks or at least a period of consolidation. The Stochastic oscillator echoes this sentiment, with %K at 93.9 and %D at 88.66, both deep in overbought territory and indicating that the market may be due for a pause. The ADX at 37.04 further solidifies the presence of a strong trend, suggesting that the current upward move has significant conviction behind it. However, it's crucial to note that the Bollinger Bands are trading above the upper band, a classic sign of an extended move that could precede a correction.
The confluence of these indicators suggests that while the immediate pressure is to the upside, the short-term timeframe is flashing an overbought warning. This doesn't necessarily signal an imminent reversal, but it warrants caution for aggressive long entries without further confirmation or a healthy retracement. The general signal across the 1-hour timeframe leans heavily towards BUY (6 Buy, 2 Sell, 0 Neutral), reflecting the prevailing bullish sentiment. This strong upward push needs to be viewed in the context of broader market dynamics to ascertain its sustainability.
The 4-Hour Perspective: A Strong Trend Under Strain?
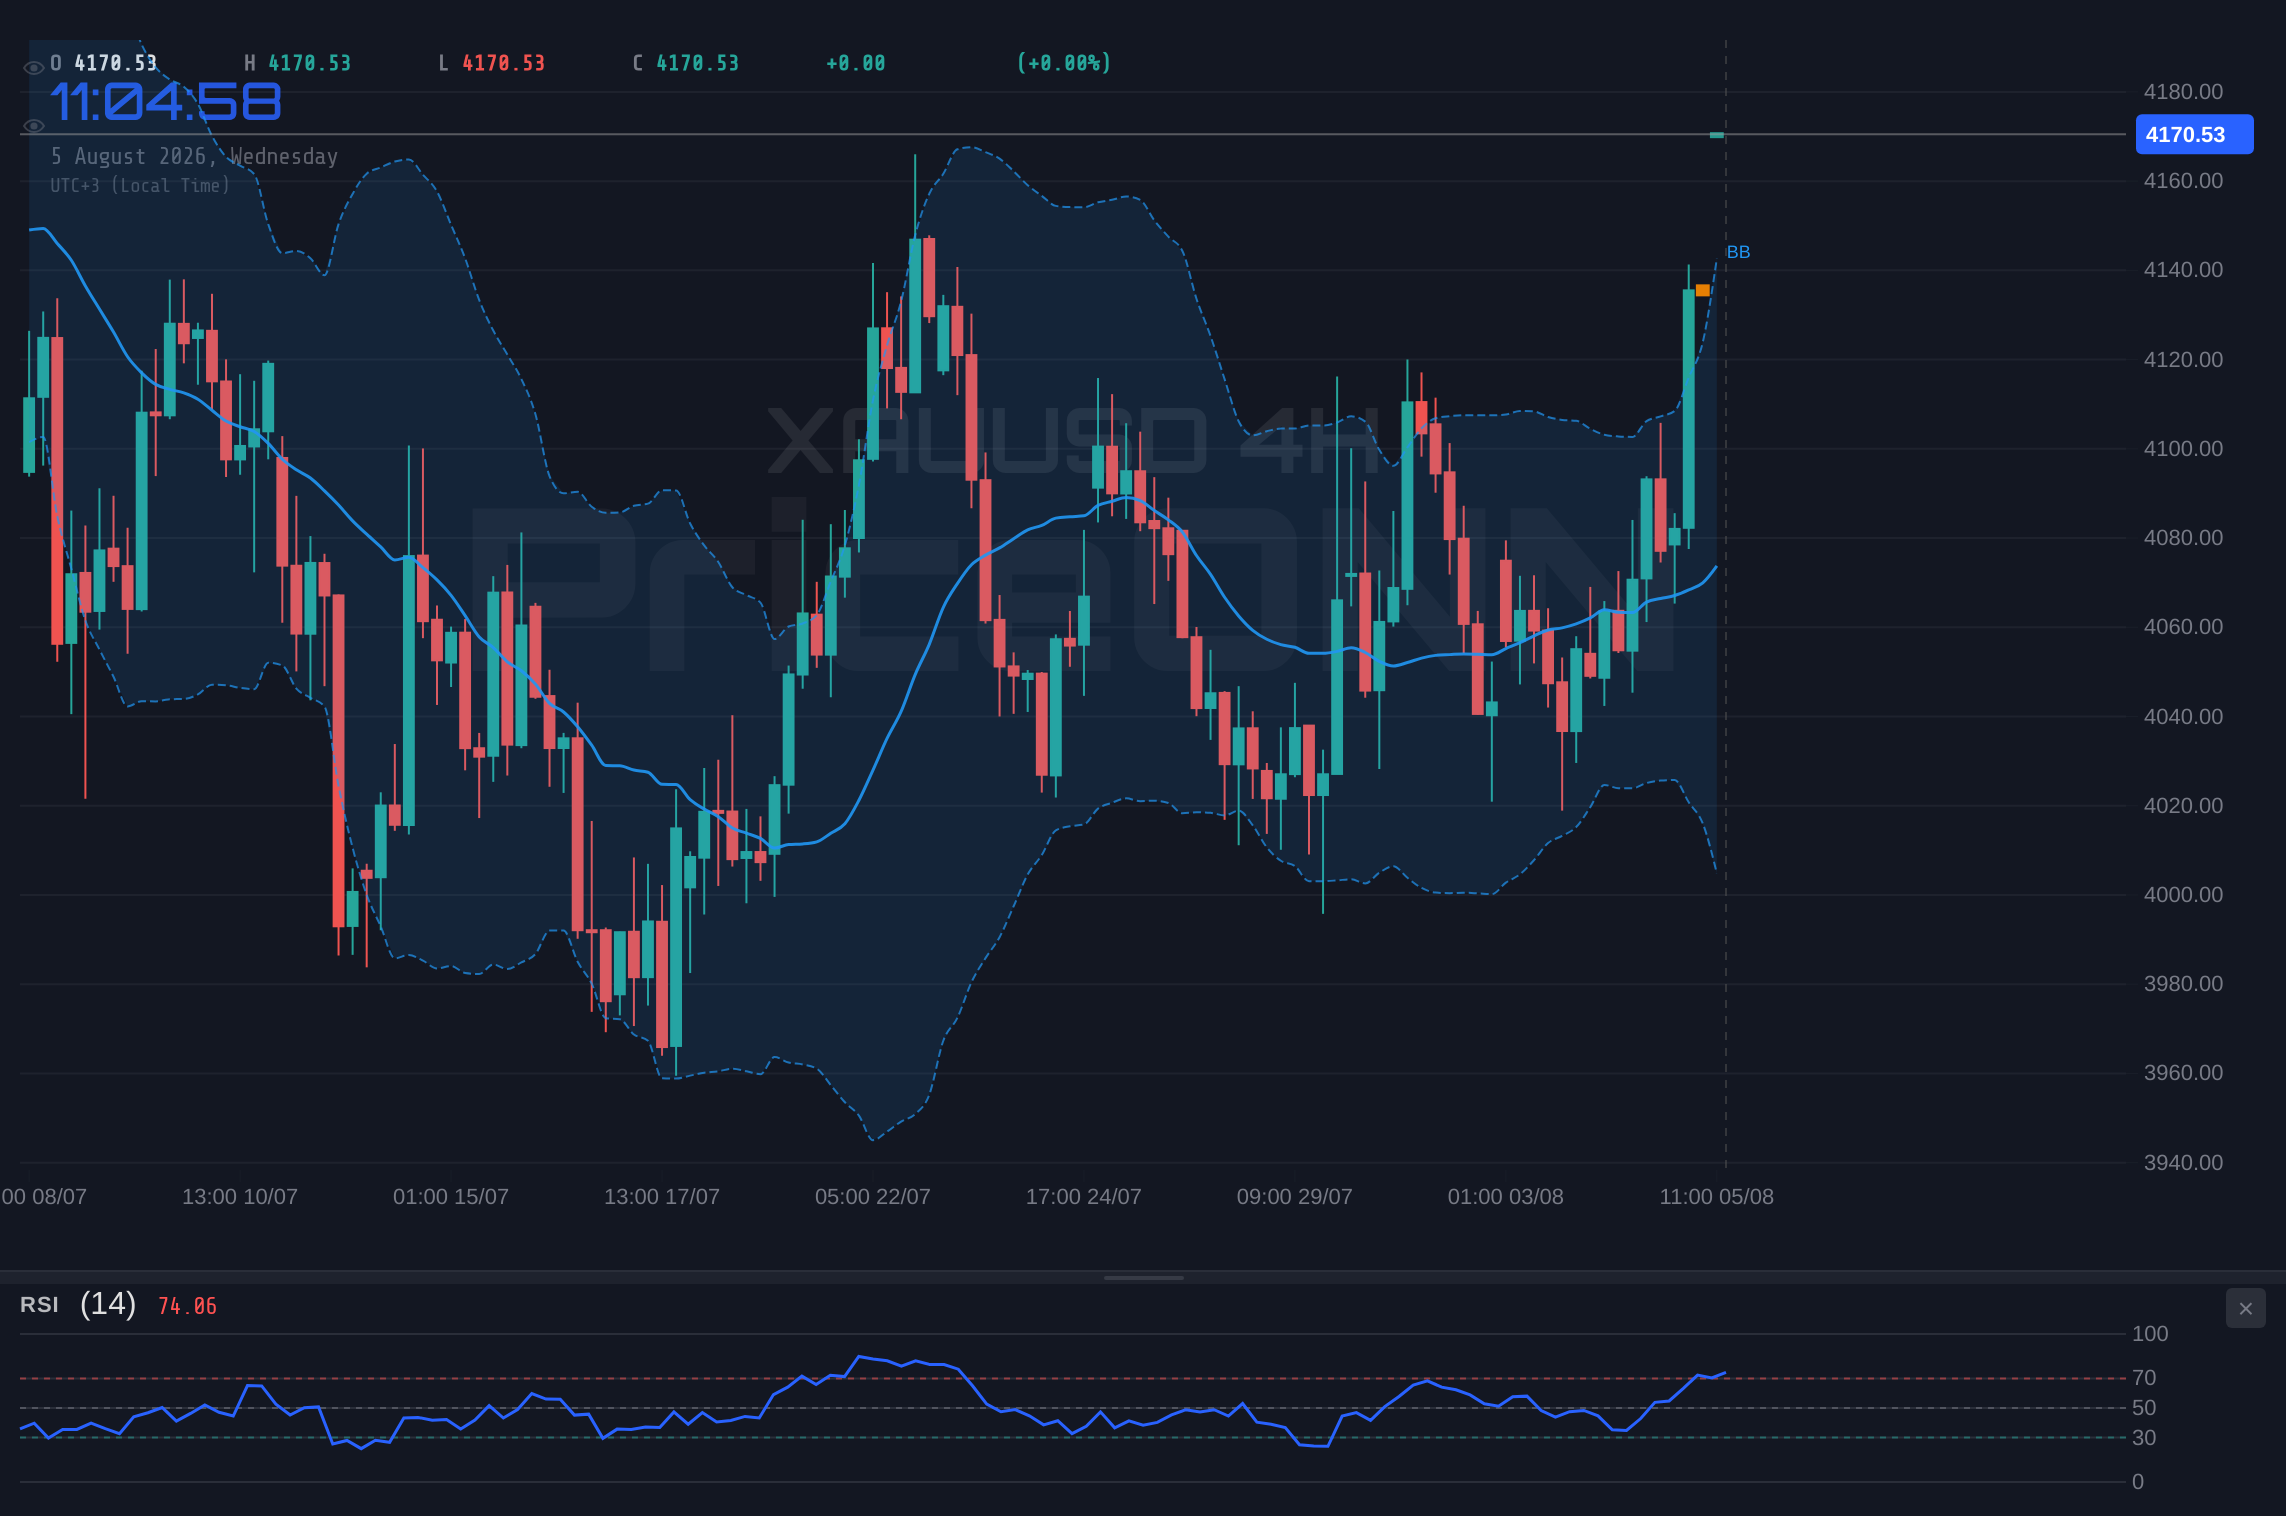
Shifting to the 4-hour timeframe, the bullish trend remains dominant, with a strength of 92%. The current price of XAUUSD, trading around $4,171.48, finds immediate support at $4,165.68 and further down at $4,153.81. Resistance levels to watch are $4,183.91 and $4,190.27. The RSI(14) on this timeframe is at 70.86, still within the overbought zone but less extreme than the 1-hour reading. This suggests that while the buying pressure is significant, it's not at a critical exhaustion point yet. The MACD continues to show positive momentum, confirming the upward trend. Stochastic oscillators are also in overbought territory at K=79.89 and D=75.4, signaling a strong upward move, though %K is above %D, which can sometimes precede a cross-over and a potential dip.
The ADX on the 4-hour chart, however, presents a contrasting view. At 13.47, it indicates a weak trend, suggesting that the recent strong moves might be part of a broader, less directional phase or a period of consolidation. This divergence between the shorter-term strong trend indicators and the weaker trend strength on the 4-hour timeframe is noteworthy. The Bollinger Bands remain above the upper band, consistent with the overbought condition observed on the hourly chart. The overall signal on the 4-hour chart is AL (7 Buy, 1 Sell, 0 Neutral), reinforcing the bullish bias but with a caveat from the lower ADX reading. This suggests that while the trend is up, the conviction might be less solid than the hourly chart implies.
The Daily Chart: A Neutral Stance Amidst Upward Drift
The daily chart for XAUUSD offers a different perspective, revealing a market in a more neutral state, with a trend strength of 50%. The key price levels to monitor are support at $4,044.40, $4,011.66, and $3,980.95, with resistance expected around $4,107.85, $4,138.56, and notably, $4,171.30. The RSI(14) at 55.94 sits comfortably in the neutral zone, showing a slight upward bias but far from overbought or oversold conditions. This suggests ample room for further price appreciation before hitting extreme levels. The MACD is positive and above its signal line, continuing the narrative of bullish momentum, albeit on a longer timeframe. The Stochastic oscillator is also showing a bullish signal with %K at 62.21 and %D at 48.76, indicating that the upward trend has room to run.
The ADX on the daily chart is 25.09, which typically signifies a strong trend. This contradicts the 50% trend strength and the neutral RSI. This discrepancy might indicate that while a trend is present, it lacks the overwhelming directional conviction seen on shorter timeframes, or that the market is in a transition phase. The Bollinger Bands are trading above the middle band, hinting at a bullish bias. The overall signal on the daily chart is AL (7 Buy, 1 Sell, 0 Neutral), suggesting that the longer-term outlook remains positive, but the lack of extreme indicator readings implies that the current rally might be part of a larger, more complex wave rather than a parabolic surge. This neutral stance on the daily chart, juxtaposed with strong bullish signals on intraday timeframes, creates an environment where caution and strategic positioning are key.
Intermarket Dynamics: Gold's Dance with the Dollar and Equities
The Dollar Index (DXY) as a Barometer
The US Dollar Index (DXY), currently trading around 99.84, plays a crucial role in the gold market's narrative. Historically, gold and the DXY share an inverse relationship; as the dollar strengthens, gold tends to face headwinds, and vice versa. The DXY's current slight decline, down 0.03% to 99.84, with intraday support at 99.73 and resistance at 99.84, is generally supportive for gold. The 1-hour chart for the DXY shows a downtrend with 88% strength, confirmed by negative MACD momentum and a position below the middle Bollinger Band. This aligns with gold's upward trajectory. However, the 4-hour and daily charts present a more neutral outlook for the dollar, with ADX readings indicating strong downtrends but mixed signals from RSI and MACD. This mixed picture for the dollar introduces a degree of uncertainty regarding its future impact on gold.
The fact that gold has managed to rally despite some underlying dollar strength on the longer timeframes suggests that other factors, such as inflation concerns or geopolitical risks, might be currently overriding the typical dollar-gold correlation. The recent news that Fed's John Williams is focusing on core inflation trends, looking beyond oil shocks, might imply a less aggressive stance on rate hikes if core inflation moderates. This could further weaken the dollar in the medium term, providing additional tailwinds for gold. Traders are closely watching the DXY's ability to break below key support levels; a sustained move below 99.70 could significantly boost gold's ascent.
Equity Markets: Risk Appetite and Its Implications
The performance of major equity indices like the S&P 500 and Nasdaq 100 provides insight into broader market risk sentiment, which in turn influences gold's safe-haven appeal. The S&P 500 is currently trading at 6572.87, showing a 0.74% daily gain, indicating a risk-on environment. The 1-hour trend is strong and bullish, with RSI at 70.95 nearing overbought territory, and MACD showing negative momentum suggesting a potential short-term pullback. The Nasdaq 100 is also showing strength, trading at 29786.25 with a 0.3% daily increase. Its 1-hour trend is strongly bullish, with RSI at 75.26, also signaling overbought conditions. The ADX for both indices on the 1-hour timeframe is above 49, confirming strong existing trends.
The fact that gold is rallying strongly while equities are also showing positive momentum is somewhat counterintuitive to its traditional safe-haven status during risk-off periods. However, gold can also act as an inflation hedge, and if market participants are anticipating sustained inflation despite rising equities, they might be buying gold regardless of risk sentiment. Conversely, if the equity rally falters, we could see a flight to safety, further boosting gold. The ADX readings on the daily charts for both S&P 500 (47.51) and Nasdaq 100 (25.01) suggest strong downward trends on that longer timeframe, which, if they resume, would likely increase demand for gold as a safe haven.
Geopolitical Currents and Inflationary Pressures
The Inflation Hedge Narrative
The persistent narrative surrounding inflation continues to be a primary driver for gold. While headline inflation figures might fluctuate, underlying pressures, coupled with supply chain disruptions and geopolitical events, keep the inflation hedge argument for gold firmly in play. The recent analyst focus on Freeport-McMoran Copper & Gold, a major player in the metals market, as a top pick, underscores the market's continued interest in precious and base metals as inflation plays. Although Brent crude oil is trading around $79.36, showing a recent upward move, its daily trend on the 4-hour and daily charts indicates a bearish bias, suggesting that the immediate inflationary impulse from energy might be moderating, or that the market is discounting future demand. However, any renewed surge in oil prices, potentially driven by geopolitical tensions in the Middle East, could reignite inflation fears and send gold higher.
The recent news regarding Fed’s John Williams looking beyond oil shocks to focus on core inflation trends suggests that central bankers are increasingly concerned about sticky underlying inflation. This suggests that while headline figures might be volatile, the focus on core inflation could keep the door open for continued hawkish monetary policy or at least a prolonged period of higher interest rates. Such an environment typically favors gold as a store of value, especially if real interest rates remain low or negative. The market's reaction to future inflation data releases will be crucial in determining whether gold's inflation-hedging appeal continues to strengthen.
Geopolitical Tensions and Safe-Haven Flows
Geopolitical risks remain a constant undercurrent in financial markets, and gold often benefits from heightened uncertainty. While the provided data doesn't detail specific geopolitical events, the general market context of potential global instability, trade relations, and regional conflicts can fuel demand for gold as a safe-haven asset. The strength observed in gold prices, even when equities are rising, could partly be attributed to underlying geopolitical concerns that are not fully reflected in market sentiment indicators. For instance, any escalation of tensions in Eastern Europe or the Middle East could trigger a flight to safety, directly benefiting gold. Similarly, ongoing trade disputes or political uncertainties in major economies could add to gold's safe-haven appeal.
The robust upward trend on the 1-hour and 4-hour charts for XAUUSD, despite potentially mixed signals from longer-term charts and correlations, suggests that market participants are actively seeking protection or upside exposure in gold. This could be a proactive measure against potential future shocks rather than a reactive response to current events. The high RSI readings on shorter timeframes indicate strong buying interest, which might be partly fueled by a desire for portfolio diversification and risk mitigation in an uncertain global landscape. As we move forward, any significant geopolitical developments will likely be a key catalyst for gold's price action.
Strategic Considerations: Levels, Scenarios, and Outlook
Key Levels and Potential Price Action
The current price of XAUUSD at $4,171.48 places it precariously close to the $4,171.30 daily resistance level. A decisive break and hold above this level would be a significant bullish signal, potentially opening the door for further upside towards $4,183.91 and $4,190.27 as indicated by the 1-hour resistance levels. The strength of the upward trend on shorter timeframes suggests this is a plausible scenario if buying momentum continues unabated. However, the overbought conditions indicated by RSI and Stochastic oscillators on the 1-hour and 4-hour charts suggest that a pullback is also a strong possibility. If sellers step in at current levels or around $4,183.91, we could see a retest of the immediate support at $4,165.68. A break below this level could accelerate the decline towards $4,153.81 and potentially the daily support at $4,147.45, although the daily trend strength is currently neutral.
The divergence in trend strength between the 1-hour (100%) and 4-hour (92%) charts versus the weaker trend on the daily (ADX 25.09) is crucial. While the intraday momentum is strong, the longer-term picture suggests that the market might be consolidating these gains before the next major move. Traders should pay close attention to the price action around $4,171.48. A sustained move above this level, especially with increasing volume, would validate the bullish case. Conversely, a failure to break higher and a subsequent close below $4,165.68 could signal a short-term reversal, offering opportunities for bearish trades targeting lower support levels.
Scenario Analysis: Mapping Potential Futures
Bullish Scenario: Sustained Rally Above Key Resistance
45% ProbabilityConsolidation Phase: Choppy Trading Around Current Levels
50% ProbabilityBearish Scenario: Overbought Correction
5% ProbabilityThe Road Ahead: What to Watch
Looking forward, the market will be keenly observing the interplay between short-term overbought signals and the underlying bullish momentum. The daily chart's neutral stance, coupled with the strong intraday uptrends, suggests that gold could be coiling for its next significant move. Key economic data releases, particularly those related to inflation and employment, will be critical in shaping the Federal Reserve's future policy decisions, which in turn will influence the DXY and, consequently, gold prices. Any unexpected shifts in geopolitical sentiment could also rapidly alter the risk landscape, potentially driving significant safe-haven demand for the yellow metal. Traders should remain vigilant, paying close attention to the $4,165.68 support level and the $4,183.91 resistance level as immediate indicators of the market's short-term direction. The ability of XAUUSD to digest current overbought conditions without a sharp reversal will be a key determinant of its near-term trajectory.
Frequently Asked Questions: XAUUSD Analysis
What happens if XAUUSD breaks above the $4,183.91 resistance level?
A sustained break above $4,183.91, especially on strong volume, would validate the bullish scenario. This could trigger further buying pressure, targeting the next resistance at $4,190.27 and potentially extending towards $4,202.14, as indicated by the 1-hour chart's upper Bollinger Band. This would signal that the short-term overbought conditions are being overcome by strong upward momentum.
Should I buy XAUUSD at current levels around $4,171.48 given the RSI at 79.55?
Buying at current levels with the 1-hour RSI at 79.55 carries elevated risk due to overbought conditions. While the trend is bullish, a pullback is possible. A more prudent approach might be to wait for a dip towards the $4,165.68 support for a better risk-reward ratio, or for confirmation of a bullish continuation above $4,183.91. Aggressive traders might consider tighter stop-losses.
Is the RSI at 79.55 a sell signal for XAUUSD right now?
An RSI of 79.55 on the 1-hour chart is a strong overbought signal, indicating that the asset has experienced rapid price increases. While it doesn't automatically trigger a sell, it suggests caution for new long entries and increases the probability of a short-term pullback or consolidation. The market needs to show signs of reversal or a break of key support levels before a confirmed sell signal emerges.
How will the Fed's focus on core inflation affect XAUUSD this week?
If the Fed continues to emphasize core inflation trends and shows less concern about headline figures like oil prices, it could signal a less aggressive monetary policy stance. This might weaken the dollar (DXY at 99.84), which would likely support gold prices. However, if core inflation remains stubbornly high, it could lead to continued hawkishness, potentially capping gold's upside despite the dollar's weakness.
Track markets in real-time
AI-powered analysis, technical indicators and real-time price data.
Join Our Telegram Channel
Breaking market news, AI analysis and trading signals instantly.
Join Channel