

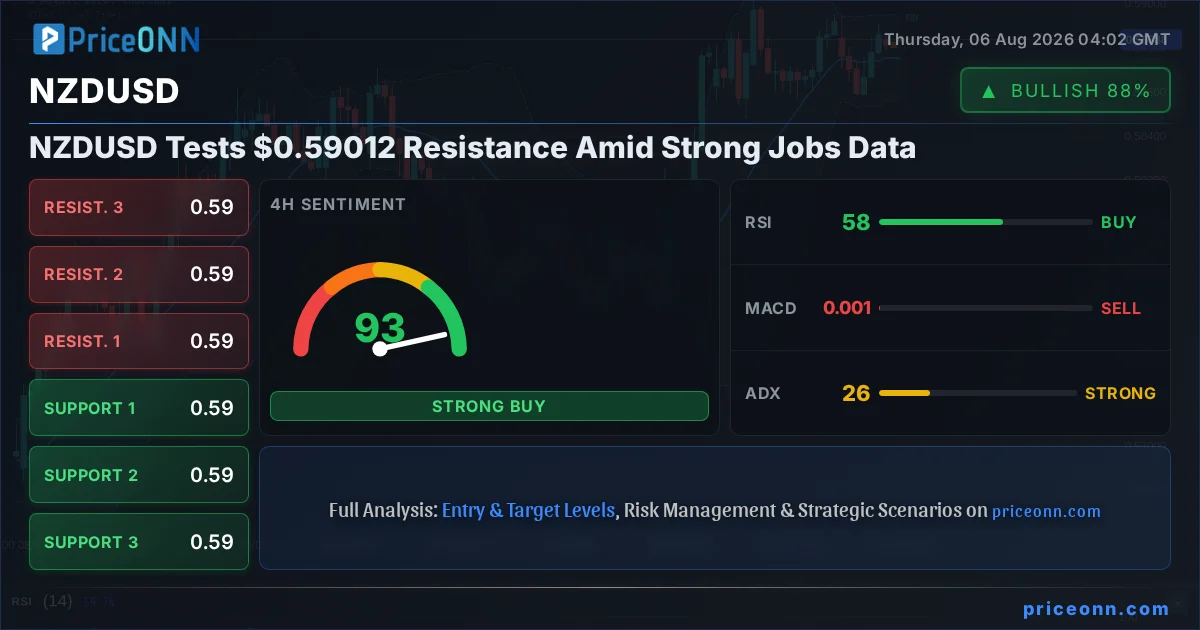
The narrative for NZDUSD is getting interesting, and frankly, it’s a situation that demands attention right now. We're seeing the pair flirt with a significant resistance level around $0.59012, currently trading at $0.58847, off the back of surprisingly strong New Zealand jobs data. This isn't just a small tick up; it's a data point that could reshape expectations for the RBNZ and, consequently, the kiwi's trajectory. The question on every trader's mind is: can this momentum carry NZDUSD higher, or is this just another setup for a pullback before a deeper move?
- NZDUSD is currently trading at $0.58847, approaching the critical $0.59012 resistance level.
- New Zealand's Q2 employment report showed stronger-than-expected hiring, with the unemployment rate ticking up slightly to 4.1% but job growth exceeding forecasts.
- The 4-hour RSI at 74.84 for XAUUSD suggests overbought conditions, contrasting with NZDUSD's own RSI of 65.84 on the 4H chart, indicating room for further upside pressure.
- The US Dollar Index (DXY) is showing weakness, trading at 99.75, which typically supports riskier currencies like the NZD.
- ADX readings on NZDUSD across multiple timeframes (1H: 16.95, 4H: 26.12, 1D: 27.66) indicate a developing trend, with the daily showing a strong upward trend.
The Jobs Data Dilemma: A Boost for the Kiwi?
Let's cut to the chase: the latest New Zealand employment figures dropped a surprise, and it’s exactly the kind of data that makes currency pairs like NZDUSD dance. The second-quarter report revealed a labor market that, while showing a slight uptick in unemployment to 4.1%, managed to create jobs at a pace that outstripped expectations. This is crucial because it paints a picture of economic resilience in New Zealand. For months, the market has been grappling with inflation concerns and the RBNZ's monetary policy path. Stronger employment numbers, even with a slight rise in unemployment, suggest the economy isn't collapsing, which is a positive signal for the kiwi. It reinforces the idea that the RBNZ might have room to keep interest rates higher for longer, or at least not pivot to aggressive cuts anytime soon. This resilience is exactly what the bulls have been looking for.
Now, this isn't a simple 'good news is good news' scenario for NZDUSD. While the jobs data provides a fundamental tailwind, we need to look at the technicals to see if the price action is aligning. The current price of $0.58847 is hovering just below a significant resistance at $0.59012. This level has acted as a ceiling multiple times, and breaking it decisively would be a major technical development. The fact that the pair is even approaching this level after the jobs report suggests that the market is indeed pricing in some of this positive economic news. However, the immediate vicinity of $0.59012 is where the real battle will be fought. It's a critical juncture where we'll see if the positive sentiment from the labor market can overcome the technical overhead.
Technical Picture: Navigating the Levels
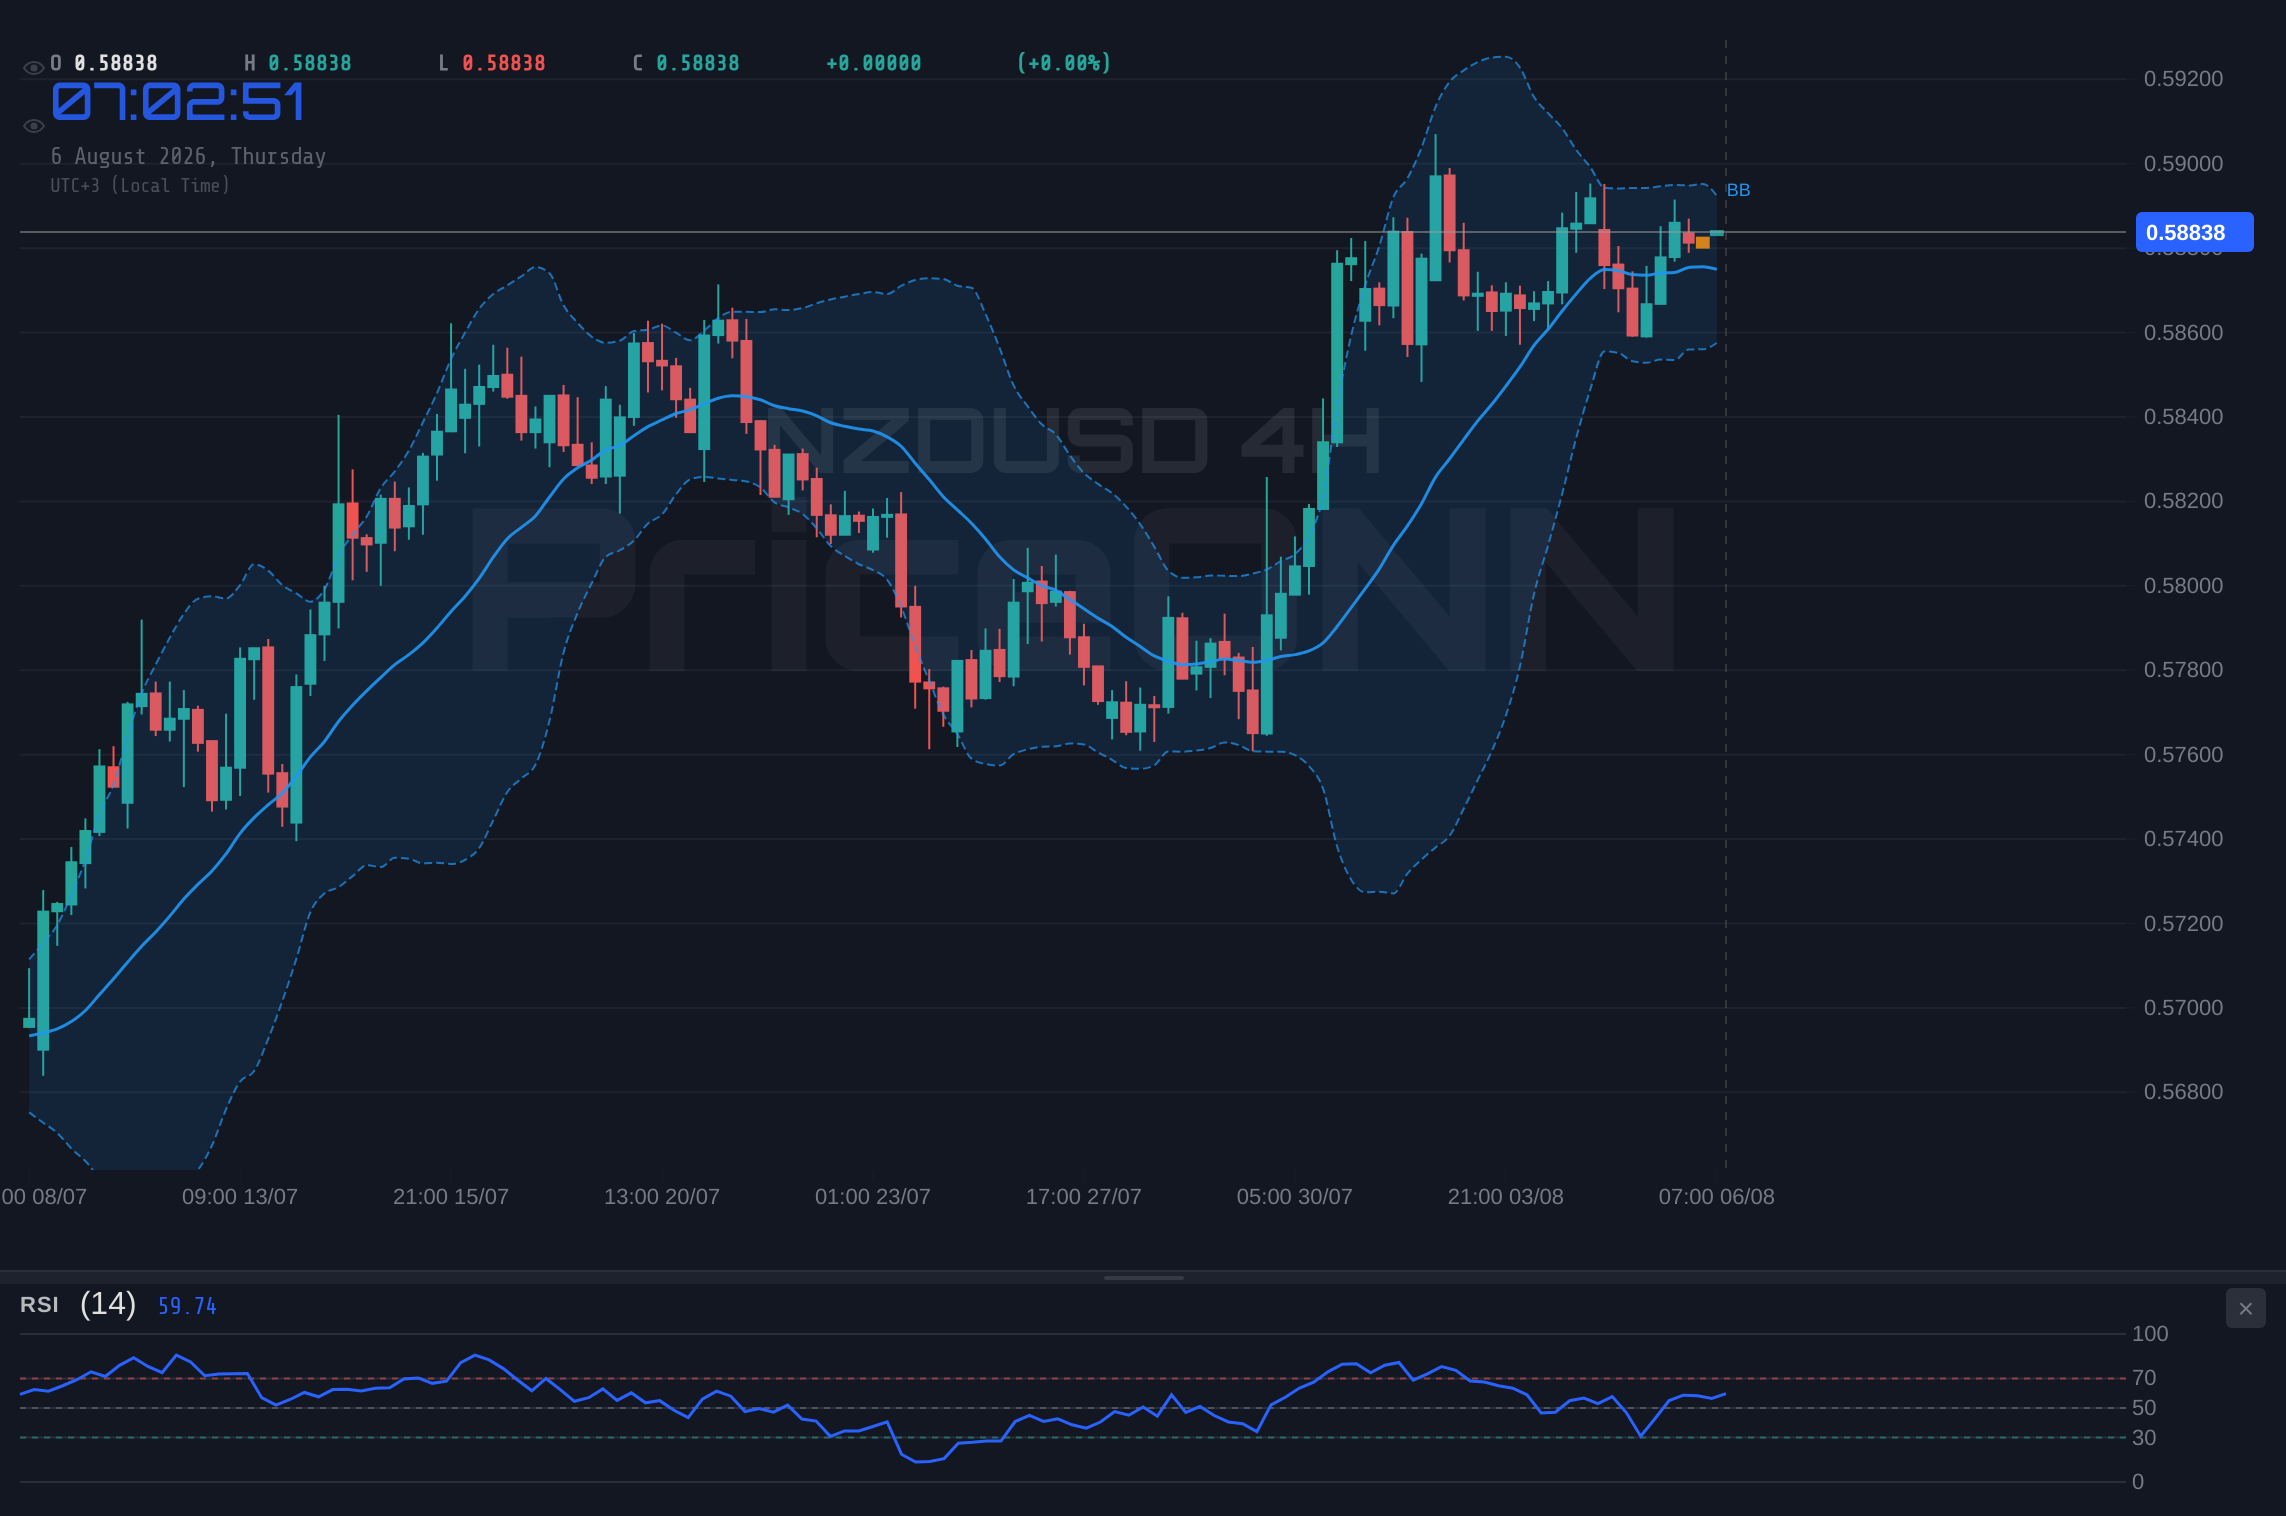
Looking at the charts, the NZDUSD pair is at a fascinating crossroads. On the 1-hour timeframe, the ADX is reading a relatively weak 16.95, suggesting that the current move might lack sustained directional conviction. However, this picture changes significantly as we move to higher timeframes. The 4-hour ADX jumps to 26.12, indicating a moderately strong trend, and the daily ADX solidifies this with a reading of 27.66, pointing towards a strong upward trend on the daily chart. This divergence across timeframes is typical of a market consolidating before a potential breakout or reversal. The bulls will be eyeing the breach of $0.59012, which would then open the door towards the next resistance at $0.6249. This is where the real upside potential lies.
The RSI indicator offers a mixed bag. On the 1-hour chart, it sits at 52.84, comfortably in neutral territory and showing a slight upward tendency, which aligns with the positive jobs data. However, the 4-hour RSI is at 65.84, creeping towards overbought territory, and the daily RSI is at 56.6, also in the neutral zone but with room to climb. This suggests that while there's momentum, the move towards $0.59012 might be facing some cooling-off pressure from a purely technical standpoint, especially on the 4-hour chart. We need to see the RSI push higher and stay above 70 on the daily for a truly bullish confirmation, but the current levels aren't screaming 'overbought' just yet.
Stochastic readings add another layer of complexity. On the 1-hour, it’s at 62.97%K and 61.77%D, showing a slight upward bias. The 4-hour Stochastic shows K=80.77 and D=77.76, which is in overbought territory and signaling a potential downturn, especially with the %K line above %D. The daily Stochastic is even more bullish, with K=86.07 and D=77.9, indicating strong upward momentum. This conflict - overbought signals on higher timeframes versus neutral to bullish on lower ones - is precisely why patience is key. It tells us that the market is still deciding its next move, and a clear break above resistance might be needed to resolve this ambiguity.
Correlation and External Factors: The DXY Effect
It’s impossible to talk about NZDUSD without considering its correlation with the US Dollar Index (DXY). Currently, the DXY is trading at 99.75, showing a slight decline from recent highs. This is generally a supportive factor for riskier currencies like the New Zealand dollar. When the dollar weakens, it makes assets denominated in other currencies relatively cheaper, and this often translates into increased demand for those currencies, including the NZD. The fact that the DXY is showing a slightly bearish signal across its 4-hour and 1-day charts (ADX at 37.95 and 26.98 respectively, with RSI below 40) suggests that the broader market environment might be conducive to further kiwi strength, provided domestic factors remain supportive.
The correlation with global equities also plays a role. The SP500 is currently trading at 6572.87, showing a positive daily change of 0.74%. This indicates a generally risk-on sentiment in the broader market. A rising stock market often correlates with higher demand for riskier currencies and assets, which would benefit NZDUSD. Conversely, if equities were to turn south, we might see a flight to safety, potentially strengthening the USD and weakening the NZD. The Nasdaq100, despite a slight daily dip, is showing a strong bullish trend on the 4-hour chart, reinforcing the idea of a generally positive risk appetite. This global context is crucial; it suggests that the strength seen in NZDUSD, driven by local jobs data, is happening within a supportive global risk environment.
Geopolitical Undercurrents and Broader Market Sentiment
While the immediate focus is on the NZDUSD pair and its domestic data, we cannot ignore the broader geopolitical landscape. The ongoing crisis in the Strait of Hormuz, as reported by energy news outlets, continues to cast a shadow. While this might seem distant, geopolitical instability, especially concerning major energy chokepoints, can trigger risk-off sentiment. This could indirectly impact NZDUSD by increasing demand for safe-haven assets like the US dollar, even if the DXY is currently showing weakness. Traders must remain aware that a sudden escalation in geopolitical tensions could quickly override the positive impact of the jobs data, leading to sharp reversals. The market's reaction to such events is often swift and unpredictable.
Furthermore, the global inflation narrative and central bank policies are always in the background. While the strong jobs data might suggest a more resilient New Zealand economy, the global inflation picture remains a key driver for monetary policy. If inflation proves persistent, central banks worldwide, including the RBNZ, may be forced to maintain tighter monetary conditions. This could lead to higher interest rate differentials, potentially supporting the NZD. Conversely, if inflation begins to recede faster than expected, it could prompt central banks to consider rate cuts sooner, which would put downward pressure on their respective currencies. For now, the jobs data points towards a scenario where the RBNZ can maintain its current stance, providing a supportive backdrop for NZDUSD.
Trade Scenarios: What Lies Ahead for NZDUSD?
Bearish Scenario: Resistance Holds Firm
40% ProbabilityNeutral Scenario: Consolidation Around Resistance
30% ProbabilityBullish Scenario: Breakout Confirmed
30% ProbabilityThe immediate path for NZDUSD hinges on the battle at the $0.59012 resistance level. If the bulls can push through, fueled by the positive jobs data and a weaker DXY, we could see a significant upward move. The 4-hour chart, with its RSI at 65.84 and Stochastic in overbought territory, suggests potential for further upside, but also a need for caution. A sustained break above $0.59012 would be a strong signal, potentially targeting the 1H resistance levels around $0.6249 and $0.6272. This would confirm the bullish trend indicated by the daily ADX of 27.66.
However, the bearish scenario cannot be ignored. If the $0.59012 resistance proves too strong, or if global risk sentiment shifts due to geopolitical events or unexpected inflation data, NZDUSD could easily reverse. The 4-hour Stochastic's overbought reading is a warning sign, and failure to break higher could lead to a pullback towards the support levels. The key invalidation point for the bullish case would be a close back below $0.58900, opening the door for a test of the daily support levels at $0.58633 and $0.58436. The probabilities assigned reflect this tension: a 40% chance of a bearish move, 30% for consolidation, and 30% for a bullish breakout.
The most crucial takeaway here is the confluence of strong domestic data and a key technical resistance. The jobs report has provided the fundamental fuel, but the price action must confirm the breakout. Traders should be watching the $0.59012 level closely. A decisive break above it, supported by continued dollar weakness and positive risk sentiment, could ignite a new leg higher. Conversely, a failure to overcome this hurdle might signal a short-term top, leading to a retracement. The ADX on the daily timeframe at 27.66 is a strong indicator of an established trend, so whichever way this resistance breaks, expect volatility.
Frequently Asked Questions: NZDUSD Analysis
What happens if NZDUSD breaks decisively above the $0.59012 resistance level?
A sustained break above $0.59012, confirmed by a 4-hour candle close, would invalidate the immediate bearish outlook and potentially target higher resistance levels. The next significant hurdles would be around $0.6249 and $0.6272, supported by the strong daily upward trend signaled by the ADX at 27.66.
Should I buy NZDUSD at current levels around $0.58847 given the jobs data?
Entering at current levels carries risk as $0.59012 is a strong resistance. A more prudent approach would be to wait for confirmation of a breakout above $0.59012, or to enter on a pullback to support levels like $0.58633 if the bullish sentiment persists. The probability for a bullish breakout is currently around 30%.
Is the 4-hour RSI at 65.84 a sell signal for NZDUSD?
An RSI of 65.84 on the 4-hour chart indicates strong upward momentum but is not yet in extreme overbought territory. While it suggests caution and potential for a short-term pullback or consolidation, it doesn't necessarily signal an immediate sell. The daily RSI at 56.6 still shows room for growth.
How will upcoming US employment data affect NZDUSD this week?
Upcoming US employment data, such as Non-Farm Payrolls, will be critical. Stronger-than-expected US data could strengthen the USD, putting downward pressure on NZDUSD, potentially causing it to test support levels. Weaker US data could weaken the dollar and provide further upside for NZDUSD, especially if it reinforces the idea of the Fed pausing rate hikes.
Technical Outlook Summary
| Indicator | Value | Signal | Interpretation |
|---|---|---|---|
| RSI (14) | 65.84 | Neutral | Approaching overbought on 4H, room to run on Daily. |
| MACD Histogram | 0.009 | Bullish | Positive momentum on 4H and Daily charts. |
| Stochastic | K=80.77, D=77.76 | Bearish Signal (Overbought) | K/D lines in overbought zone, may signal consolidation. |
| ADX | 27.66 | Strong Trend | Indicates a strong upward trend on the Daily timeframe. |
| Bollinger Bands | Upper Band | Watch | Price above middle band on 4H/Daily, suggests bullish momentum. |
Track markets in real-time
AI-powered analysis, technical indicators and real-time price data.
Join Our Telegram Channel
Breaking market news, AI analysis and trading signals instantly.
Join Channel