

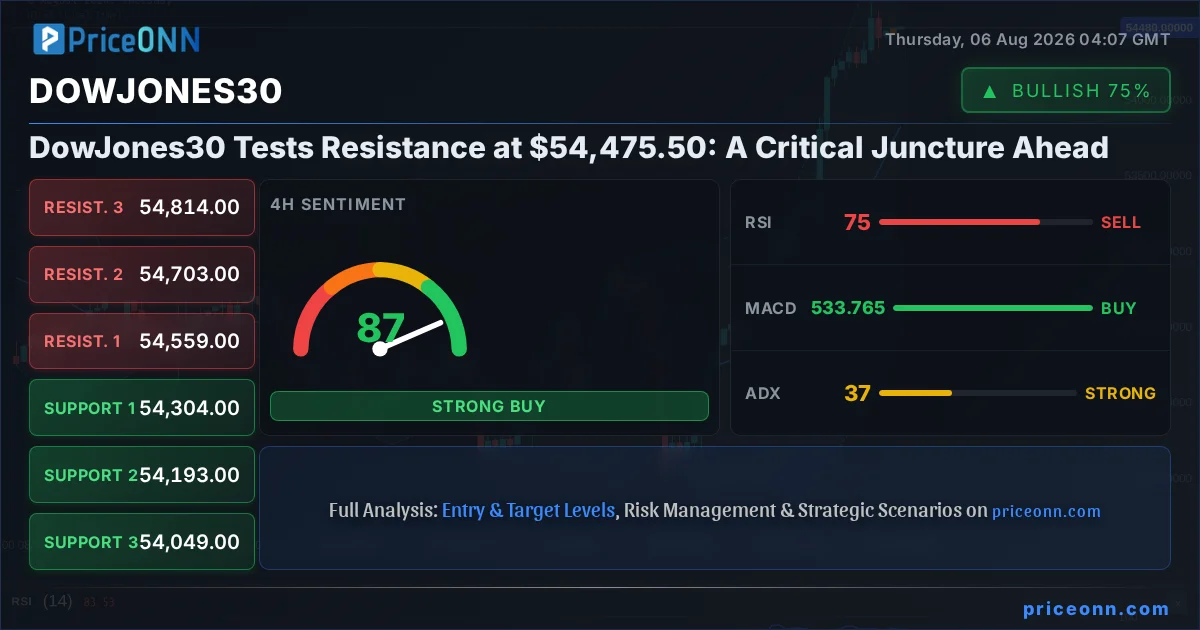
The Dow Jones Industrial Average (DJIA) is currently trading at a pivotal point, hovering precariously near the $54,475.50 mark. All eyes are on the $54,704 resistance level, a crucial barrier that could dictate the market's immediate trajectory. As traders grapple with mixed signals and a complex interplay of technical indicators, the question on everyone's mind is whether the bulls have the strength to push through this resistance or if the bears are poised to reassert their dominance. This in-depth analysis explores the intricate technical landscape, dissecting multiple timeframes and indicators to map out potential scenarios.
- The Dow Jones Industrial Average is currently consolidating near $54,475.50, with significant overhead resistance at $54,704.
- On the 1-hour chart, the ADX at 37.23 indicates a strong trend, but conflicting signals from RSI (60.28) and Stochastic (K=50.01, D=33.64) suggest caution.
- The 4-hour chart shows a strong uptrend (ADX: 37.34) with RSI at 75.03 in overbought territory, signaling potential for a pullback.
- The daily chart presents a bullish picture with strong ADX (20.59) and RSI (68.44), but the Stochastic K/D crossover needs confirmation.
- The primary battleground remains between the $54,475.50 current price and the $54,704 resistance.
Navigating the $54,704 Resistance Zone
The Current Technical Landscape for DowJones30
The Dow Jones Industrial Average (DJIA) finds itself at a critical juncture, trading at $54,475.50. This level is more than just a price point; it represents a psychological barrier and a key area of interest for both retail and institutional traders. The immediate overhead resistance at $54,704 is the level that everyone is watching. A decisive break above this mark could signal further upside potential, potentially igniting a new leg of the rally. Conversely, a failure to overcome this resistance could lead to a price consolidation or even a reversal, as sellers step in to capture profits or initiate new short positions.
On the 1-hour timeframe, the Average Directional Index (ADX) at 37.23 points to a strong underlying trend, suggesting that momentum could be in play. However, this strength is somewhat contradicted by the Relative Strength Index (RSI) hovering around 60.28. While not yet in overbought territory, it indicates growing bullish pressure that could soon face a correction. The Stochastic Oscillator, with its %K line at 50.01 and %D line at 33.64, shows a divergence, with %K crossing above %D, hinting at a potential upward move, but its position near the midline suggests a lack of strong conviction. This short-term picture is one of cautious optimism, where a clear breakout is needed to confirm a sustained move higher.
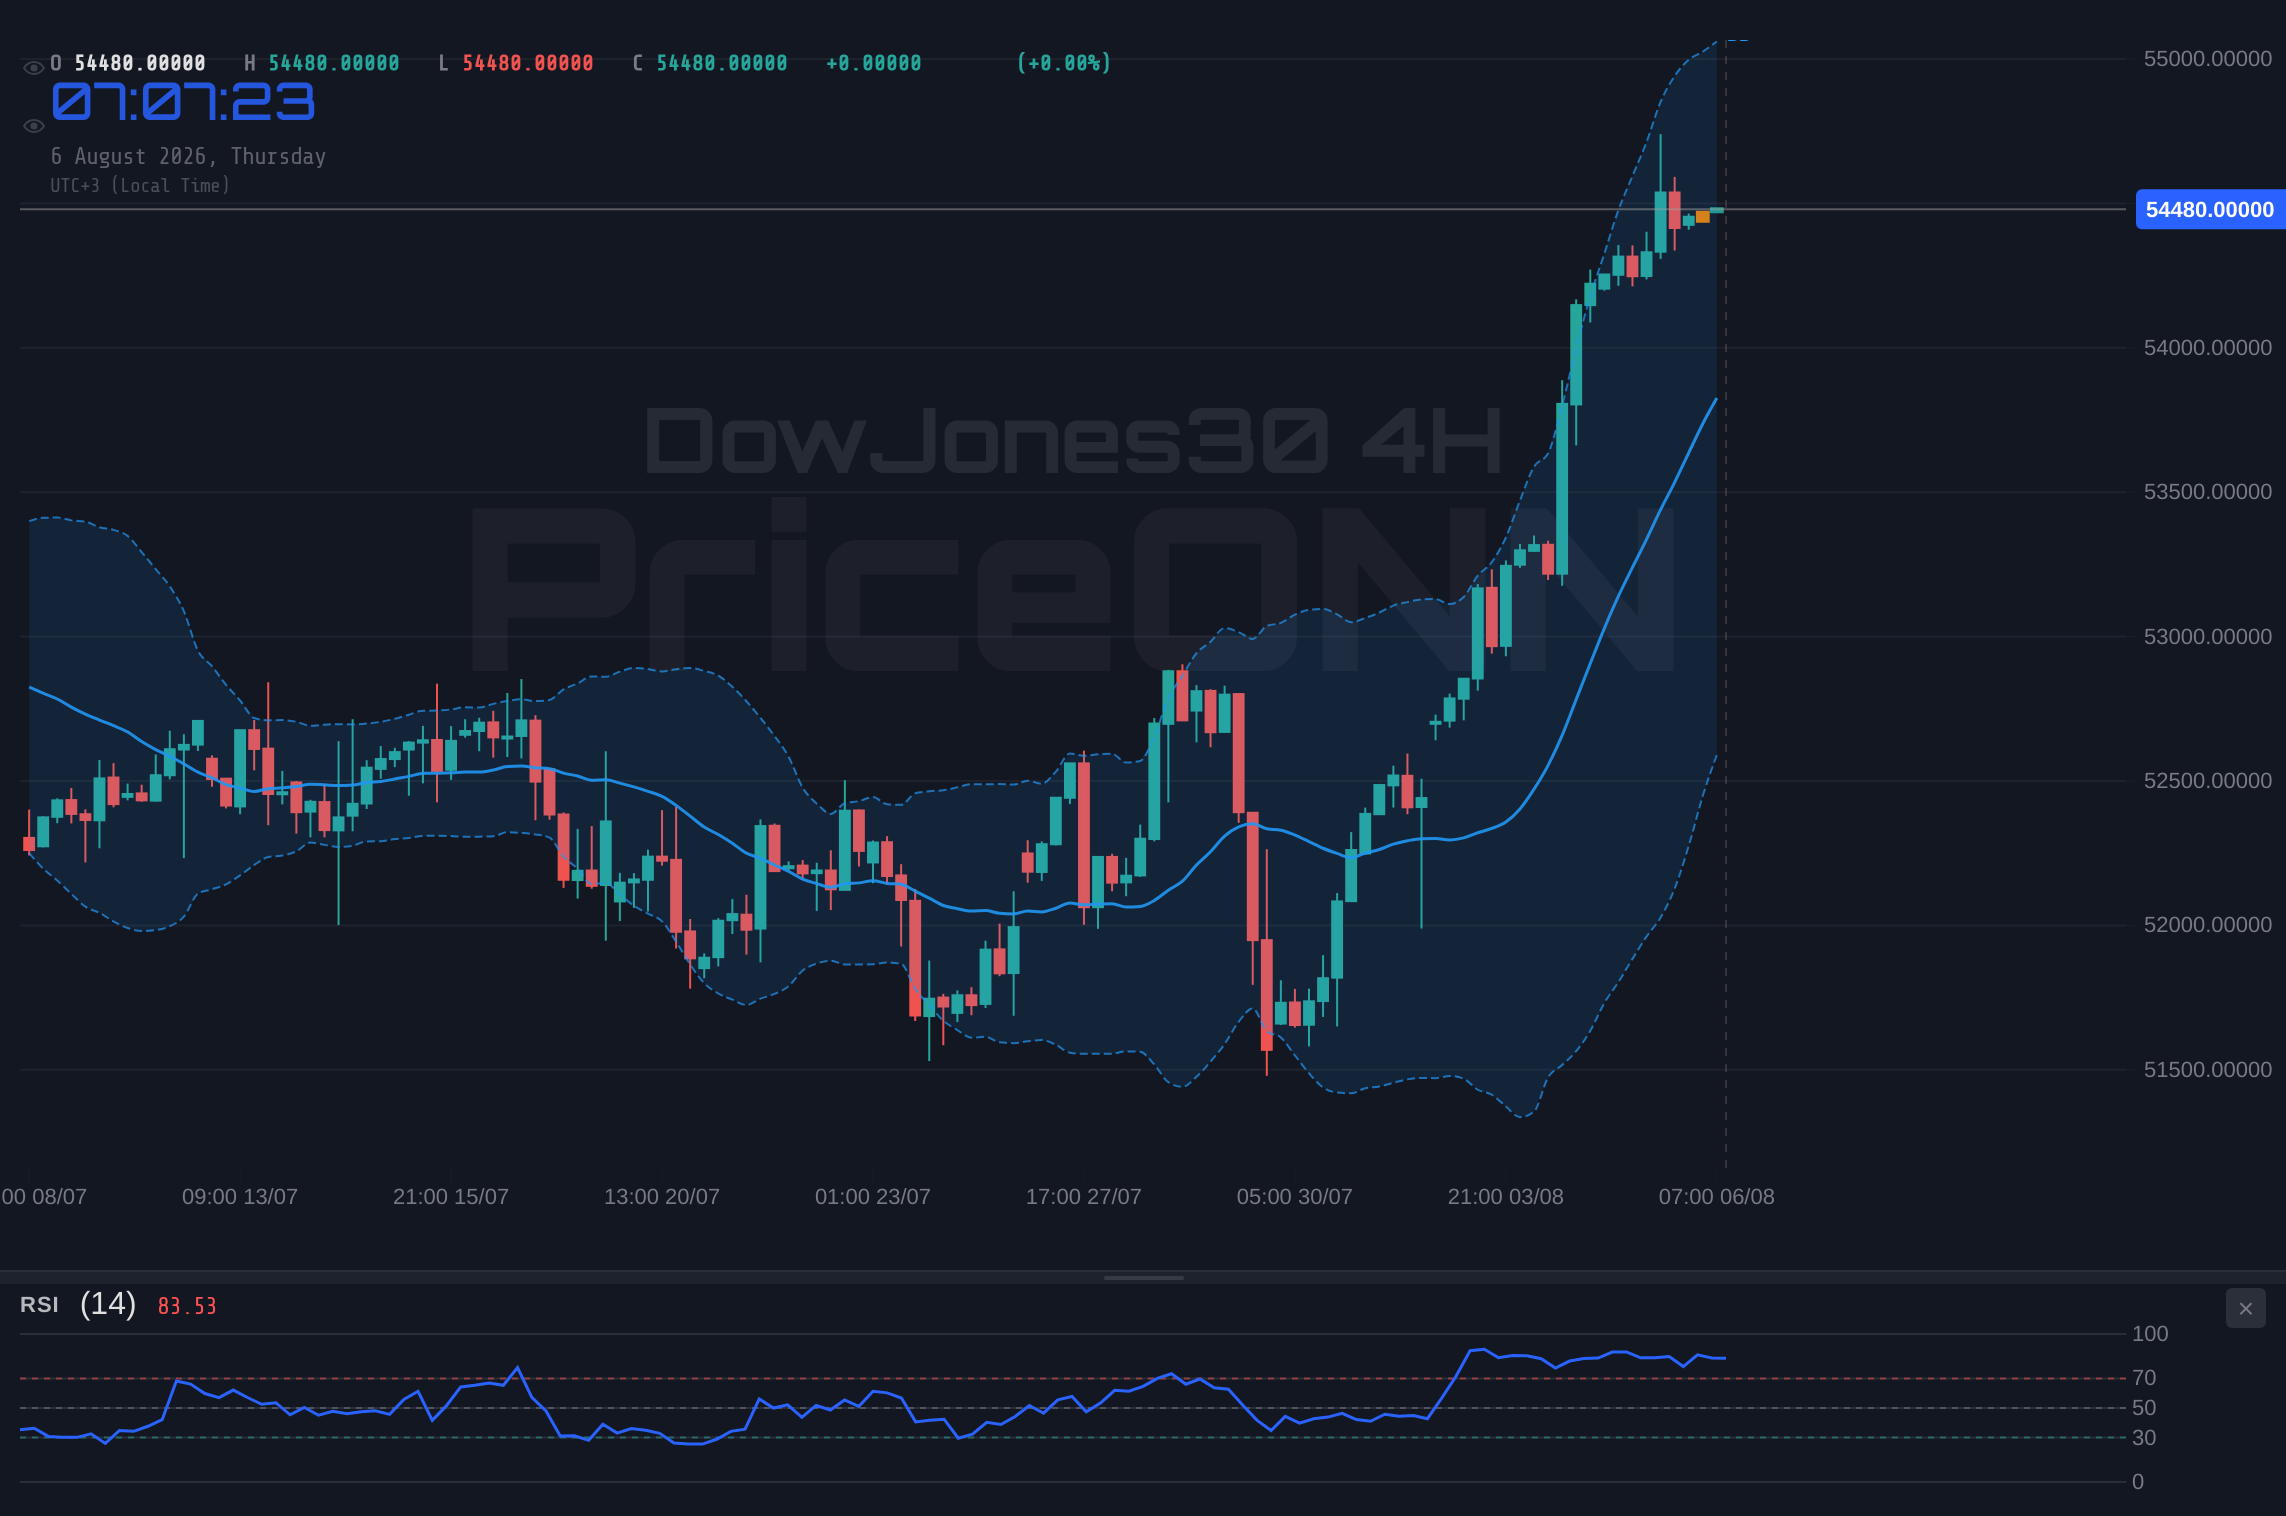
The 4-hour chart offers a slightly different perspective. Here, the ADX is even stronger at 37.34, reinforcing the idea of a powerful trend. The RSI, however, has climbed to 75.03, firmly within the overbought zone. This reading is a classic warning sign of potential exhaustion and increases the probability of a near-term pullback or consolidation. While the overall trend might still be bullish, the overbought RSI suggests that the market might need to consolidate or retrace before it can sustainably challenge higher resistance levels. The Stochastic Oscillator on this timeframe shows %K at 80.59 and %D at 90.89, indicating an overbought condition and a potential bearish crossover, further supporting the idea of a looming correction.
The daily timeframe provides the broadest view, painting a picture that is still predominantly bullish, albeit with nuances. The ADX stands at 20.59, indicating a strong uptrend is in place. The RSI at 68.44 is in the neutral-to-bullish zone, showing room for further upside. The Stochastic Oscillator, with %K at 93.39 and %D at 73.63, is in extreme overbought territory and has already made a bearish crossover, signaling a potential reversal. This conflicting signal between the ADX/RSI and the Stochastic highlights the current uncertainty. While the trend strength indicated by ADX is promising, the overbought Stochastic warrants caution, suggesting that a period of consolidation or a minor dip might be necessary before the next significant upward move can materialize. The key takeaway here is that while the long-term trend appears intact, short-to-medium term indicators are flashing mixed signals, demanding careful observation of immediate price action around the $54,704 resistance.
The Bull's Roadmap: Charting a Path Above Resistance
For the bulls to maintain control and push the Dow Jones Industrial Average higher, a decisive break above the $54,704 resistance level is paramount. This level has acted as a significant ceiling, and a sustained move above it would signal strong buying pressure and a potential continuation of the bullish trend. The first target on a confirmed breakout would likely be the $54,993 resistance level, followed by the more ambitious target of $55,246. Such a move would require robust trading volume and a clear catalyst, perhaps driven by positive economic data or a shift in market sentiment towards risk-on assets.
The technical indicators would need to align to support this bullish scenario. On the 1-hour chart, the RSI would need to hold above 60, ideally moving towards 70 without showing immediate bearish divergence. The Stochastic Oscillator would need to either avoid a bearish crossover or complete one and then quickly reverse, staying above the 50 level. The ADX, already strong, should ideally remain above 30, confirming the trend's integrity. On the 4-hour chart, the RSI would need to break out of its overbought condition by consolidating sideways rather than sharply declining, perhaps moving back towards the 70-65 zone, while the Stochastic would need to avoid further bearish crossovers or show a bullish reversal.
The daily chart's Stochastic would be the most crucial indicator to watch. A sustained move above $54,704, coupled with the daily Stochastic either failing to make a significant bearish crossover or completing one and then immediately turning upwards, would be a powerful confirmation. The ADX at 20.59 suggests the trend is strong enough to absorb some of the overbought signals from the Stochastic. Fundamentally, this scenario would be bolstered by stronger-than-expected employment figures, positive corporate earnings reports, or a more dovish stance from the Federal Reserve regarding future monetary policy. The closing of the gap between the current price of $54,475.50 and the resistance at $54,704 needs to be accompanied by increasing volume to validate the bullish conviction.
This bullish outlook is predicated on the idea that the current consolidation is merely a pause before the next upward leg. The strong uptrend indicated by the daily ADX (20.59) and the RSI (68.44) provides a solid foundation. If the Dow Jones can clear $54,704 with conviction, the path towards $54,993 and potentially $55,246 would open up. This scenario assumes that the market's underlying strength is sufficient to overcome the short-term overbought conditions suggested by the 4-hour RSI (75.03) and daily Stochastic. A catalyst, such as surprisingly robust economic data or a dovish Fed pivot, could be the spark needed to ignite this move. The key is to see sustained buying pressure and confirmation across multiple timeframes, particularly a successful retest of $54,704 as support after the initial breakout.
Where Bears Could Take Control: The Risk of a Downturn
The Bearish Scenario Unfolds Below Key Support
Conversely, a failure to break above the $54,704 resistance could trigger a bearish reversal. The immediate downside target would be the $54,475.50 current price level, followed by the first support level at $54,438.33. A decisive break below this support could open the door to further declines, with the next significant support level at $54,413.67, and a more substantial floor at $54,388.33. This scenario would likely be driven by negative economic news, geopolitical tensions, or a shift towards risk aversion in the broader market.
Technically, this bearish case would be confirmed by a rejection at the $54,704 resistance, followed by a breakdown below $54,475.50 and then $54,438.33. On the 1-hour chart, the RSI would need to fall below 50, and the Stochastic Oscillator would need to confirm a bearish crossover and move lower. The ADX, despite its current strength, would need to start declining, indicating a weakening trend. On the 4-hour chart, the overbought RSI at 75.03 would be the primary signal to watch for a reversal. A bearish crossover in the Stochastic Oscillator on this timeframe, combined with a close below the middle Bollinger Band, would further solidify the bearish outlook.
The daily chart's Stochastic, already showing a bearish crossover in overbought territory, would be a key confirmation signal. If the price falls below $54,475.50 and subsequently breaks the $54,438.33 support, this would invalidate the bullish thesis. The daily RSI would likely dip below 60, and the ADX might start to show signs of waning trend strength. Fundamentally, this scenario could be triggered by disappointing employment reports (like the weak ADP data mentioned in recent news), rising inflation concerns prompting hawkish Fed rhetoric, or escalating geopolitical risks. The recent news about the Hormuz crisis, while primarily impacting energy markets, could contribute to broader risk aversion if tensions escalate further, indirectly pressuring equity indices like the Dow Jones.
The failure to sustain the move above $54,475.50 and a subsequent break below $54,438.33 would signal a significant shift in market sentiment. The overbought conditions on the 4-hour and daily charts, particularly the Stochastic's bearish crossover on the daily, become more potent as warning signs. If the price succumbs to selling pressure, the next levels to watch would be $54,413.67 and $54,388.33. The ADX, currently indicating a strong trend, would need to show signs of reversal, perhaps falling below 25, to confirm that the upward momentum has indeed stalled. This bearish thesis gains credibility if key economic data disappoints or if global risk sentiment deteriorates, leading to a flight to safety that bypasses equities.
The Waiting Game: Consolidation and Sideways Action
When Price Gets Stuck Between Support and Resistance
A third possibility is that the Dow Jones Industrial Average enters a period of consolidation, trading within a defined range between the current price area and the $54,704 resistance. This neutral scenario often occurs when market participants are hesitant, awaiting clearer directional signals from economic data or geopolitical events. In such a case, the index might oscillate between support and resistance, exhibiting choppy price action with lower volume and indecisive indicator readings.
Technically, consolidation would be characterized by the ADX remaining relatively subdued, perhaps hovering in the 20-25 range on the daily chart, indicating a lack of strong trend. The RSI would likely fluctuate around the 50-60 level, failing to decisively enter overbought or oversold territory. The Stochastic Oscillator might move back and forth across the 50 level, with frequent crossovers that lack follow-through. On the shorter timeframes (1-hour and 4-hour), price action could become range-bound, with the index repeatedly testing the $54,704 resistance and bouncing off levels around $54,475.50 or $54,438.33.
Volume would likely decrease during this period, a sign of reduced conviction from traders. Bollinger Bands might start to narrow, indicating lower volatility, which often precedes a significant price move but doesn't predict its direction. This neutral phase could persist until a significant catalyst emerges, such as a key economic release (like upcoming employment reports or inflation data) or a major geopolitical development, forcing the index out of its range. During this period, scalpers and range traders might find opportunities, but swing and position traders would likely adopt a wait-and-see approach.
The key to identifying this scenario early is to observe the lack of follow-through after price tests either support or resistance. If the index fails to break $54,704 convincingly and also fails to break below $54,438.33, then range-bound trading is likely. The ADX's inability to sustain a move above 30 across multiple timeframes would further support this view. This phase could be influenced by mixed economic signals, where some data points are positive while others are negative, leading to market indecision. The current consolidation around $54,475.50, with resistance at $54,704 and support at $54,438.33, fits this description perfectly, suggesting that the market is waiting for a definitive catalyst.
The Most Likely Path: Probabilities and Triggers
Weighing the Scenarios: Where the Smart Money Might Be Positioned
Considering the current technical picture, the most probable scenario appears to be a period of consolidation or a slight bearish bias in the immediate short term, followed by a potential push towards resistance if key conditions are met. The strong ADX readings across most timeframes suggest underlying trend strength, but the overbought conditions on the 4-hour and daily charts, particularly the Stochastic's bearish crossover on the daily, introduce a significant element of caution. Therefore, a direct, immediate breakout above $54,704 seems less likely without some form of pullback or consolidation first.
I assign a 55% probability to a scenario involving initial consolidation or a minor pullback towards the $54,438 support, followed by a potential attempt to break the $54,704 resistance later in the week. A purely bearish scenario, with a decisive break below $54,438.33, has a 30% probability, contingent on negative external catalysts. The most optimistic bullish scenario, a clean and immediate breakout above $54,704, currently holds a 15% probability, requiring strong confirmation and favorable news flow.
The key to validating the bullish continuation lies in the price action around the $54,475.50 to $54,438.33 support zone. If this area holds firm and the RSI on the 1-hour chart can stay above 50 while the Stochastic avoids a strong bearish crossover, then the bulls might get their chance. Conversely, a break below $54,438.33, coupled with the daily Stochastic continuing its bearish trajectory, would significantly increase the probability of the bearish scenario playing out. The market is currently in a state of flux, and the upcoming economic data releases will be crucial in determining the next direction. The recent weakness in the US ADP employment report, which reinforced fading Fed hike bets, suggests that the market is sensitive to employment data, making upcoming reports critical.
The prevailing sentiment leans towards caution, given the conflicting signals. The strong trend strength (ADX) is battling against overbought conditions (RSI, Stochastic) on higher timeframes. This suggests that while the underlying trend may be up, the index is due for a pause or a minor correction. Therefore, the most likely path involves a test of support around $54,438.33, followed by a potential rebound and a renewed assault on the $54,704 resistance. This makes the 55% probability assigned to the consolidation/pullback-then-attempt scenario the most fitting. The high probability of the bearish scenario (30%) underscores the risk of a downturn if market sentiment sours or negative data emerges.
Scenario Breakdown: Triggers and Targets
Bearish Scenario: Retreat Below Support
30% ProbabilityNeutral Scenario: Range-Bound Trading
55% ProbabilityBullish Scenario: Breakout Above Resistance
15% ProbabilityWhat I'm Watching This Week
Key Triggers for DowJones30 Direction
This week, the Dow Jones Industrial Average's path will likely be dictated by a few critical factors. Firstly, the price action around the immediate support at $54,438.33 and resistance at $54,704 will be paramount. A clear break in either direction, supported by increasing volume, will be the primary signal to follow. Secondly, traders will be closely monitoring upcoming economic data releases. Any surprises in employment figures or inflation data could significantly sway market sentiment and provide the catalyst needed to break the current stalemate.
The correlation with the US Dollar Index (DXY), currently trading around 99.75, will also be important. A continued rise in the DXY could put pressure on equities, while a decline might offer some support. The recent news regarding the Hormuz crisis, while primarily impacting energy, serves as a reminder of potential geopolitical risks that could quickly shift the market's risk appetite. Therefore, staying abreast of geopolitical developments is crucial. Finally, the alignment of technical indicators across different timeframes will be key. Confirmation of a breakout above $54,704 requires more than just a single indicator flashing green; it needs confluence across multiple signals, especially on the daily chart.
The market is at a crossroads, and the $54,475.50 level represents a delicate balance. The strength indicated by the ADX across multiple timeframes suggests that the underlying trend is still robust. However, the overbought conditions on higher timeframes cannot be ignored. Therefore, patience is advised. Waiting for a clear confirmation signal – either a decisive break above $54,704 or a confirmed breakdown below $54,438.33 – will be crucial for risk management. The most likely scenario involves range-bound trading or a test of support before any significant upward move, making the $54,438.33 level a critical area to watch for potential buying opportunities if it holds.
Ultimately, navigating this period requires a disciplined approach. The market often presents opportunities even amidst uncertainty. By focusing on the key levels, understanding the conflicting indicator signals, and remaining attuned to macroeconomic and geopolitical developments, traders can position themselves effectively. The $54,704 resistance is the immediate hurdle, and its outcome will shape the near-term outlook for the Dow Jones. Whether it leads to a continuation of the rally or a retracement, adhering to risk management principles and waiting for clear setups will be the most prudent strategy.
Frequently Asked Questions: DowJones30 Analysis
What happens if the DowJones30 breaks above the $54,704 resistance level?
A sustained close above $54,704, confirmed by increasing volume, would likely target $54,993 as the first resistance level, followed by $55,246. This scenario hinges on continued bullish momentum and potentially positive economic news.
Should I buy the DowJones30 at current levels near $54,475.50 given the mixed signals?
Caution is advised. While the underlying trend is strong, overbought conditions on higher timeframes and resistance at $54,704 suggest a potential for consolidation or a pullback. Waiting for a clear signal, such as holding support at $54,438.33 or breaking resistance, is recommended for better risk management.
Is the RSI at 68.44 on the daily chart a sell signal for the DowJones30?
An RSI of 68.44 is in the neutral-to-bullish zone, indicating upward momentum but not yet extreme overbought conditions that typically trigger immediate sell signals. However, combined with the Stochastic's bearish crossover, it warrants watching for potential consolidation or a minor pullback.
How will upcoming employment data affect the DowJones30 this week?
Disappointing employment figures could reinforce fading Fed hike bets, potentially leading to a risk-off sentiment that pressures the Dow Jones, targeting support levels like $54,438.33. Conversely, strong data could validate the bullish trend and fuel a push towards $54,704 resistance.
Track markets in real-time
AI-powered analysis, technical indicators and real-time price data.
Join Our Telegram Channel
Breaking market news, AI analysis and trading signals instantly.
Join Channel