The intricate dance between global economic pressures and asset-specific technicals is on full display as silver, or XAGUSD, finds itself navigating a critical juncture around the $77.05 mark. While the precious metal has shown resilience, the broader market sentiment, influenced by everything from central bank pronouncements to geopolitical tensions, paints a complex picture for traders. Understanding the interplay between these forces is paramount for deciphering silver's next move. This isn't just about a single metal; it's a reflection of larger macroeconomic winds that are shaping investment strategies across asset classes.
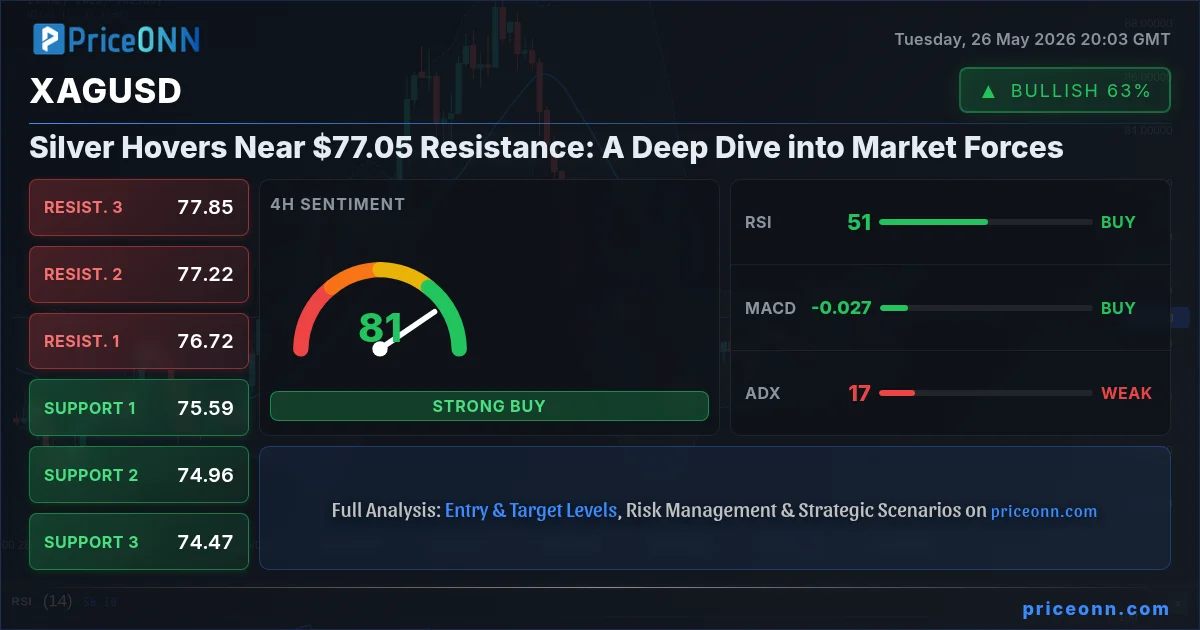
- Silver (XAGUSD) is currently trading at $77.05, showing a neutral trend on the daily timeframe with mixed signals across timeframes.
- Key support for XAGUSD is identified at $76.01, while resistance looms around $77.33, a crucial level to watch for potential breakouts or rejections.
- The daily RSI at 49.1 indicates a neutral stance but with a downward tendency, suggesting caution for aggressive bullish plays.
- The US Dollar Index (DXY) at 98.85 is displaying a neutral-to-bullish bias on lower timeframes, potentially capping upside for silver if it strengthens.
- Geopolitical risks and inflation concerns remain underlying themes, providing a potential floor for precious metals like silver, even amidst technical headwinds.
The current market environment is a fascinating study in contrasts. On one hand, we have persistent geopolitical undercurrents – the lingering effects of global conflicts and trade disputes – that traditionally bolster demand for safe-haven assets like silver. On the other, the specter of inflation, while still a concern, is being met with increasingly hawkish monetary policy stances from major central banks. This creates a tug-of-war: inflation fears push investors towards tangible assets, while rising interest rates increase the opportunity cost of holding non-yielding precious metals. The Dollar Index (DXY), currently hovering around 98.85, acts as a significant counterweight. A strengthening dollar typically exerts downward pressure on dollar-denominated commodities like silver, making them more expensive for holders of other currencies. The interplay between these macro factors and the immediate technical picture for XAGUSD at $77.05 is where the real trading opportunity lies.
Looking at the broader economic calendar, recent data points have painted a mixed picture. While some inflation indicators might be showing signs of cooling, the overall narrative from central bankers suggests a cautious approach, prioritizing the long-term stability of prices over immediate economic stimulus. This implies that interest rates may remain elevated for longer than some market participants anticipate, a factor that generally weighs on commodities. However, the persistent geopolitical risks, particularly in energy-producing regions, continue to add a speculative premium to commodities, including silver, which also has industrial applications. This duality means that while macro headwinds exist, any significant escalation in geopolitical tensions could quickly shift the sentiment back towards precious metals as a hedge, irrespective of interest rate differentials.
Navigating Silver's Technical Landscape
The 1-Hour Chart: A Battle for Momentum
Delving into the shorter-term technicals, the 1-hour chart for XAGUSD presents a nuanced view. The trend is currently identified as 'Düşüş' (Downtrend) with a strong 100% conviction. However, the General Signal is 'AL' (Buy), indicating a potential counter-trend move or a short-covering rally within a broader downtrend. This divergence is precisely where traders need to be most vigilant. The RSI(14) sits at 43.17, firmly in neutral territory but leaning towards a bearish sentiment, suggesting that the recent upward momentum might be losing steam. The MACD further reinforces this by showing negative momentum, with the MACD line below its signal line. Bollinger Bands are also below the middle band, aligning with the downtrend signal. Curiously, the Stochastic Oscillator offers a contrasting signal: K=27.37 and D=23.21, with %K above %D, suggesting a potential bullish turn or oversold conditions being relieved. This conflicting information between RSI/MACD and Stochastic highlights the choppy nature of the current intraday price action. The ADX at 29.65, however, points to a strong downtrend, suggesting that any rallies might be temporary corrections within a larger bearish move. This suggests that while there might be short-term buying opportunities, the overarching trend on this timeframe is downward.
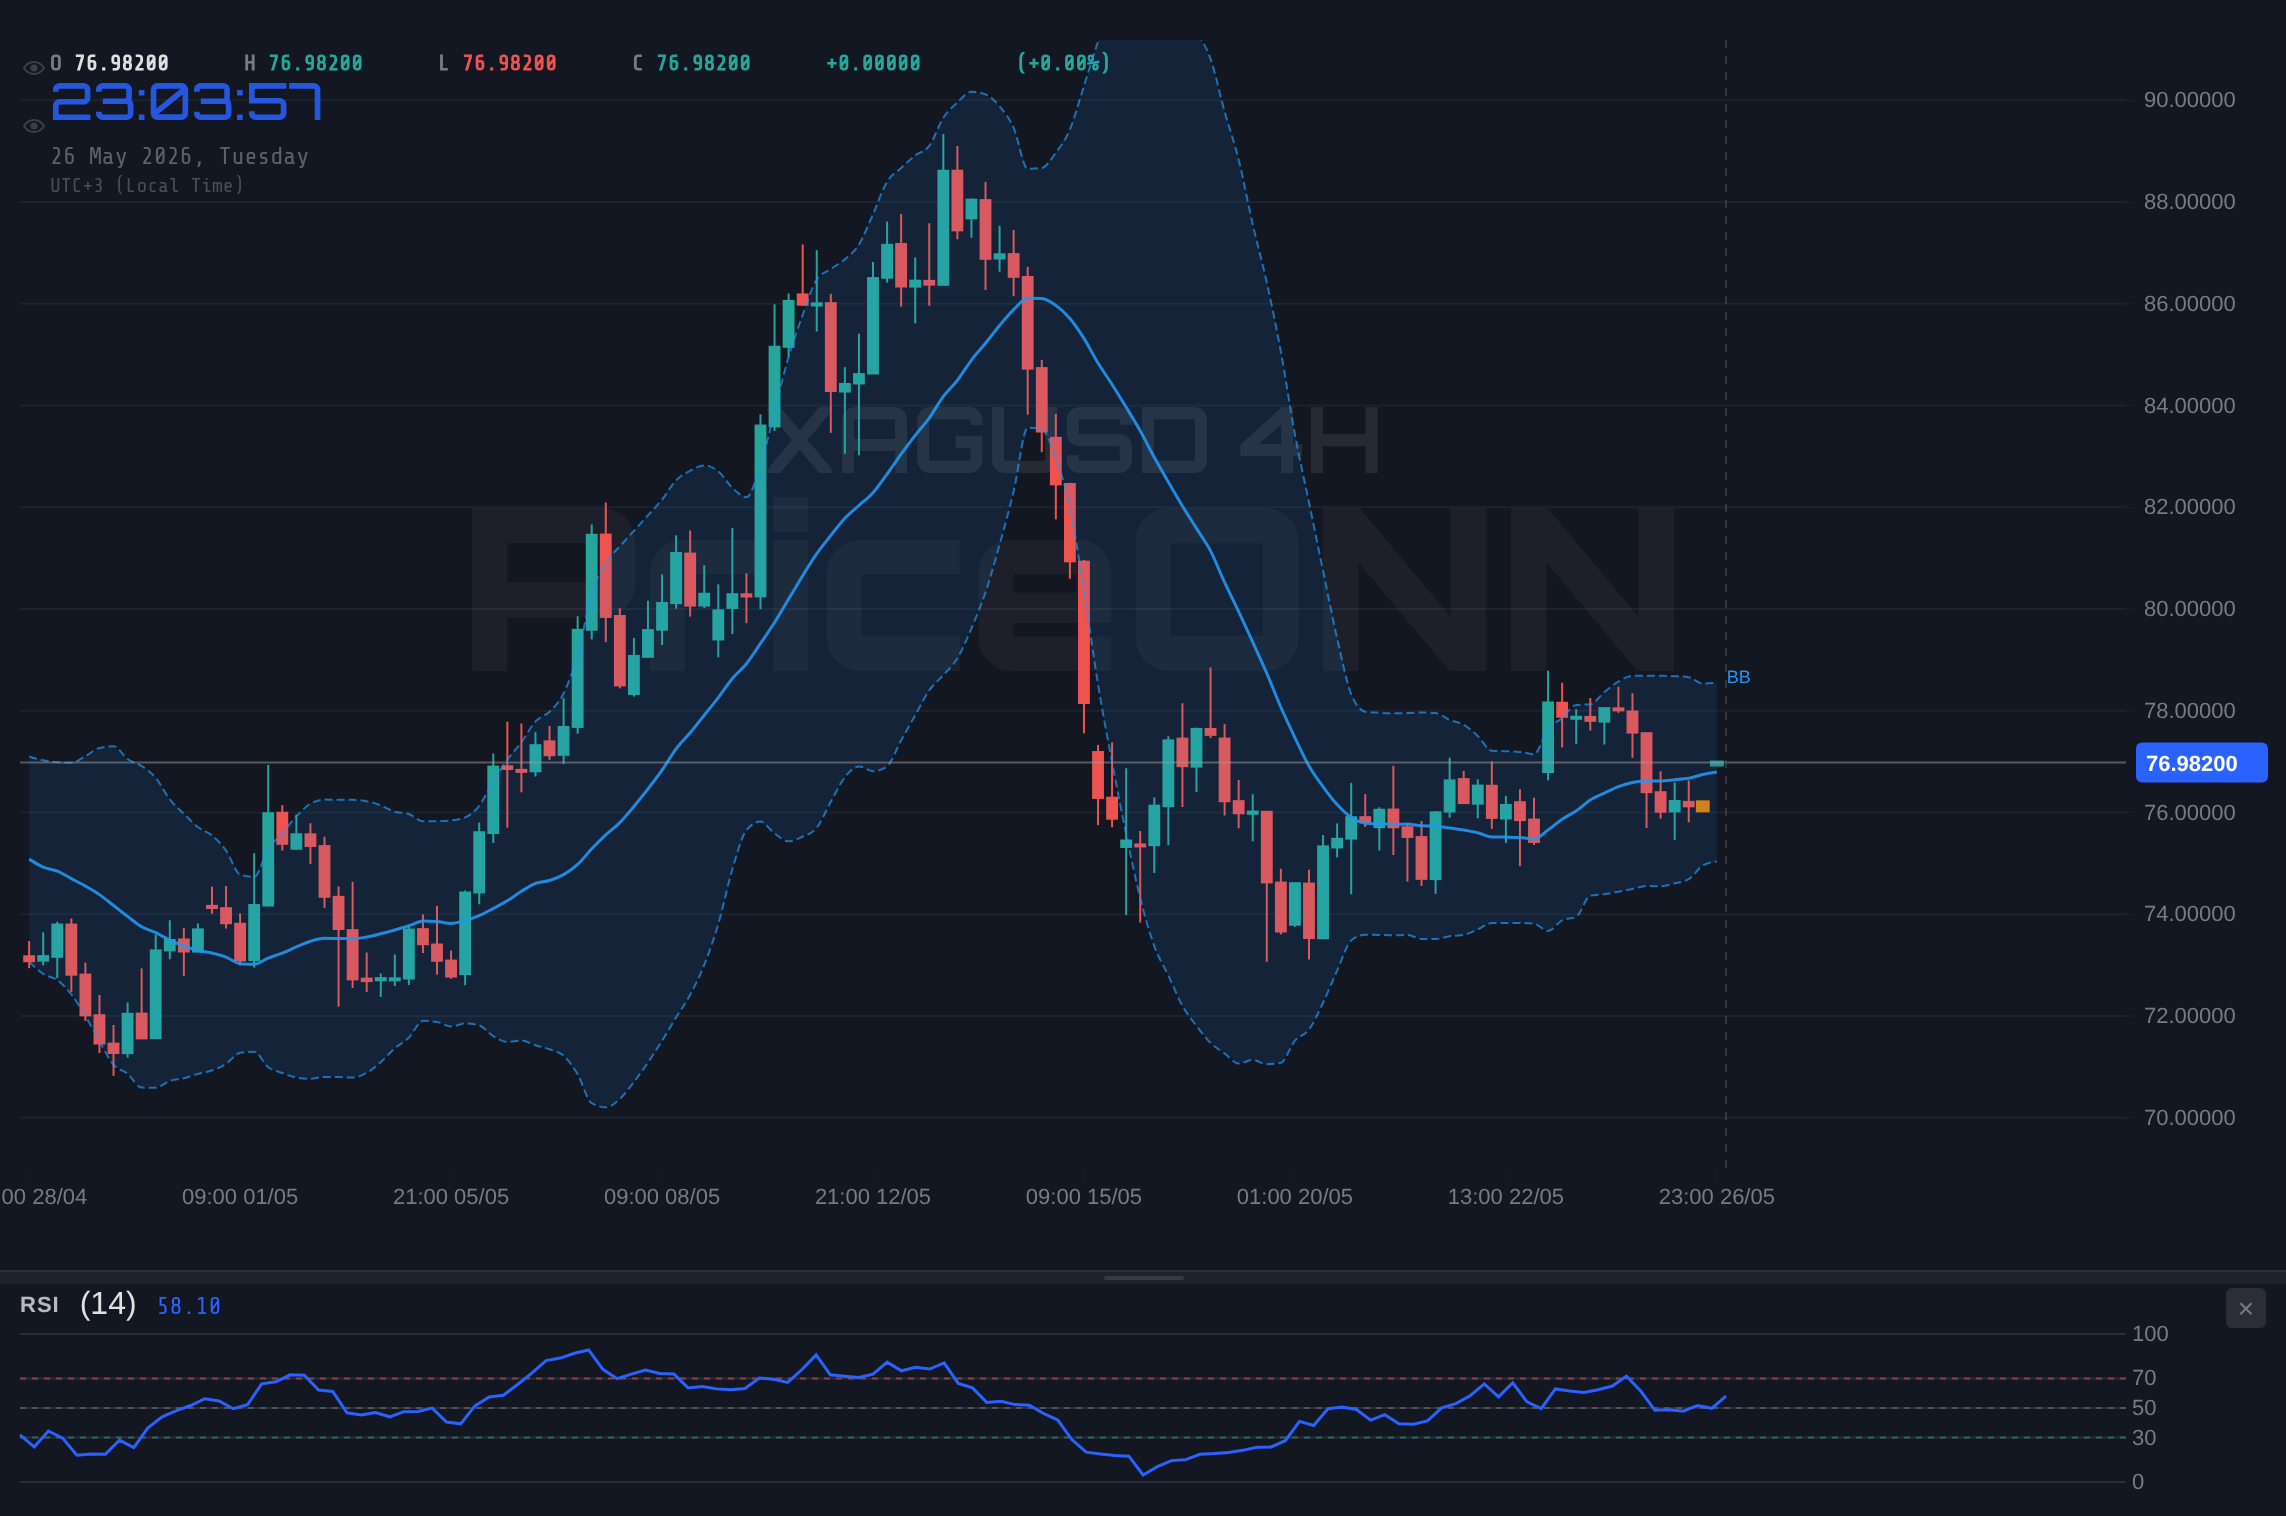
The 4-Hour Perspective: Underlying Weakness
Shifting to the 4-hour timeframe, the picture becomes clearer, leaning more towards a bearish outlook. The trend is confirmed as 'Düşüş' (Downtrend) with 89% power. The General Signal is 'SAT' (Sell), aligning with this bearish sentiment. The RSI(14) at 41.2 remains in neutral territory but continues its downward trajectory, indicating that sellers are maintaining control. MACD confirms negative momentum, with the histogram below zero and the signal line above the MACD line. Bollinger Bands are again hugging the lower side of the middle band, reinforcing the bearish inclination. The Stochastic Oscillator here presents a clear bearish signal: K=14.41, D=50.1, with %K significantly below %D, and both in oversold territory. This suggests that further downside could be expected before any meaningful recovery. The ADX at 18.75 indicates a weak trend, suggesting that while the direction is down, the momentum might be waning, leading to more range-bound conditions rather than a sharp sell-off. Despite the weak trend indicated by ADX, the confluence of RSI, MACD, and Stochastic on this timeframe points towards caution for any bullish positions, and suggests that resistance levels are likely to hold.
The Daily Chart: A Test of Conviction
On the daily chart, the trend is still classified as 'Düşüş' (Downtrend), albeit with slightly less conviction at 85% power. The General Signal remains 'SAT' (Sell). The RSI(14) at 40.18 continues its descent, reinforcing the bearish bias. MACD's negative momentum and its position below the signal line further underscore the selling pressure. Bollinger Bands are trading below the middle band, a classic sign of bearish dominance. The Stochastic Oscillator, with K=21.82 and D=22.37, also indicates a bearish signal, with %K slightly below %D and both in the oversold region. The ADX at 20.79 suggests a medium-strength downtrend, implying that the market has directional conviction but perhaps not explosive momentum. The support levels on the daily chart are 4483.37, 4459.75, and 4428.55, while resistance is eyed at 4538.19, 4569.39, and 4593.01. The current price of $77.05 is well within the trading range observed over the past few days, but the consistent bearish signals across multiple timeframes, particularly the daily, suggest that upside might be capped. The market appears to be consolidating within a defined range, awaiting a catalyst to break decisively in either direction, though the weight of evidence leans bearish.
Intermarket Correlations: The Dollar and Beyond
The DXY's Influence on Silver
The US Dollar Index (DXY) is a critical barometer for silver's price action. With the DXY currently at 98.85, its 1-hour and 4-hour charts show a neutral trend but with a slight bullish bias emerging on the hourly, supported by positive MACD momentum and RSI above 50. This suggests that if the dollar continues to find footing, it could exert further downward pressure on XAGUSD. A stronger dollar makes silver more expensive for international buyers, potentially dampening demand. Conversely, any weakness in the DXY, perhaps triggered by dovish signals from the Federal Reserve or increased global risk aversion, could provide a tailwind for silver. The daily DXY chart, however, shows a neutral trend with a bullish MACD signal, indicating that the dollar's overall direction is still in flux, creating an environment of uncertainty for correlated assets like gold and silver. This ongoing battle between short-term dollar strength and longer-term neutral trends means that XAGUSD traders must closely monitor DXY movements for clues.
Equities and Risk Sentiment
The performance of major stock indices like the S&P 500 and Nasdaq 100 provides crucial insights into market risk appetite. The S&P 500's current price at 6572.87, showing a strong upward move on the 1-hour and 4-hour charts, suggests a 'risk-on' sentiment is prevailing in equities. However, the daily chart paints a different picture, with a downtrend and RSI at 45.35, indicating underlying weakness or a potential pullback after a recent rally. The Nasdaq 100, trading at 30001.66, exhibits a similar pattern, with strong short-term uptrends but a daily RSI nearing overbought territory (75.11) and a bearish MACD signal. This mixed equity picture translates to uncertainty for silver. While a strong 'risk-on' environment might typically see silver struggle as investors flock to riskier assets, persistent inflation concerns and geopolitical risks can keep precious metals in demand as a hedge, even when equities are rallying. The divergence between short-term equity strength and longer-term daily weakness suggests that the 'risk-on' narrative might be fragile, potentially increasing silver's appeal as a safe haven if sentiment shifts.
Oil Prices and Inflationary Pressures
Brent crude oil, trading at $100.19, has seen a significant daily drop of 4.46%. This decline, despite ongoing geopolitical tensions, suggests that demand concerns might be outweighing supply worries, or that recent supply increases are having a more pronounced effect than anticipated. WTI crude, at $96.02, shows a similar pattern. Lower oil prices can have a dual effect on silver. On one hand, they can ease inflationary pressures, potentially reducing the need for inflation hedges like silver and making commodities less attractive overall. On the other hand, a sharp decline in oil prices could signal broader economic weakness, which might, paradoxically, increase safe-haven demand for silver. Given that silver has both monetary and industrial uses, its price is sensitive to both inflation expectations (linked to oil) and industrial demand (linked to economic growth). The current downward trend in oil prices, despite geopolitical risks, might be interpreted as a sign that inflationary fears are slightly receding, which could be a headwind for silver, especially if coupled with a strengthening dollar.
Trade Scenarios: What Lies Ahead for XAGUSD?
Bearish Scenario: Testing the Lower Limits
65% ProbabilityNeutral Scenario: Consolidation Around $77.05
25% ProbabilityBullish Scenario: A Push Towards Resistance
10% ProbabilityThe current technical setup for XAGUSD, especially when viewed through the lens of the 1-hour and 4-hour charts, leans towards a bearish bias. The confluence of bearish signals from RSI, MACD, and Stochastic on the 4-hour timeframe, coupled with the strong downtrend conviction on the 1-hour chart, suggests that downside risk is more pronounced. The ADX readings, while indicating strong trends on shorter timeframes, show weaker trend strength on the daily, implying that the market might be consolidating rather than embarking on a sustained directional move. However, the presence of conflicting signals, particularly from the Stochastic on the 1-hour chart and the overall neutral stance on the daily timeframe, means that a decisive breakout is not yet guaranteed. Traders should be wary of false moves and focus on key support and resistance levels. A break below $76.01 on the 1-hour chart would likely confirm the bearish scenario, opening the door for a test of lower daily support levels. Conversely, a strong push above $77.33 resistance, backed by increasing volume and a shift in macro sentiment (e.g., a weaker dollar or rising inflation fears), could signal a reversal, though this appears less probable based on current data.
The Importance of Risk Management
In any trading environment, especially one characterized by conflicting signals and macroeconomic uncertainty, disciplined risk management is not just advisable - it's essential. The current price of XAGUSD at $77.05 presents a situation where traders must be acutely aware of the potential for both sharp reversals and grinding declines. Establishing clear stop-loss levels is paramount. For those considering a bearish outlook, a stop-loss above the 1-hour resistance of $77.33 would be logical, protecting against a sudden bullish surge. For any contrarian bullish plays, a stop below the 1-hour support at $76.01 would be crucial. Furthermore, position sizing must be adjusted to reflect the prevailing volatility and the conviction of the trade setup. Given the mixed signals and the 'WATCH_ZONE' decision, it's prudent to employ smaller position sizes and focus on trades that offer a favorable risk-reward ratio, perhaps waiting for a clearer signal or a confirmed breakout from the current range.
The ADX at 17.23 on the 4-hour chart and 16.22 on the daily chart indicates weak trend strength. This means the market is choppy and prone to false breakouts. Patience is key; wait for confirmation before committing to a trade.
The interplay between XAGUSD and global monetary policy remains a dominant theme. With central banks worldwide signaling a cautious stance on inflation, the prospect of higher-for-longer interest rates continues to loom. This environment generally favors a stronger US dollar and can act as a headwind for precious metals. However, the persistent geopolitical risks and the underlying demand for silver as both an inflation hedge and an industrial commodity provide a floor. The current price action around $77.05 reflects this tension – a market caught between macro headwinds and the tangible demand drivers for silver. The technical indicators, while leaning bearish on shorter timeframes, show enough ambiguity on the daily chart to suggest that a decisive move is still pending. Traders must remain attuned to shifts in market sentiment, particularly regarding risk appetite and inflation expectations, as these will likely be the primary catalysts for breaking the current stalemate.
Frequently Asked Questions: XAGUSD Analysis
What happens if XAGUSD breaks below the $76.01 support level?
A decisive break below the $76.01 support on the 1-hour chart, especially on increased volume, would likely invalidate any short-term bullish hopes and confirm the bearish trend. This could trigger further selling pressure, potentially targeting the next daily support level around $75.57.
Is the current RSI reading of 49.1 a sell signal for XAGUSD?
An RSI of 49.1 on the daily chart is not a direct sell signal but indicates a neutral stance with a slight downward tendency. It suggests that while the market isn't oversold, the momentum is not strongly bullish, warranting caution for aggressive long positions and aligning with a potential bearish continuation if other indicators confirm.
How will the DXY at 98.85 affect XAGUSD's price outlook this week?
With the DXY showing a neutral-to-bullish bias on shorter timeframes around 98.85, it is likely to exert some downward pressure on XAGUSD. If the dollar strengthens further due to positive US economic data or risk aversion, silver prices could face headwinds, making it harder to break above resistance levels.
Should I consider buying XAGUSD at current levels of $77.05 given the mixed signals?
Buying at $77.05 is a high-risk proposition given the mixed signals and the bearish lean on shorter timeframes. A more prudent approach would be to wait for confirmation, such as a confirmed break above $77.33 resistance with strong volume, or a clear bounce from a more significant support level like $75.57, accompanied by improved macro sentiment.
Track markets in real-time
AI-powered analysis, technical indicators and real-time price data.
Join Our Telegram Channel
Breaking market news, AI analysis and trading signals instantly.
Join Channel