

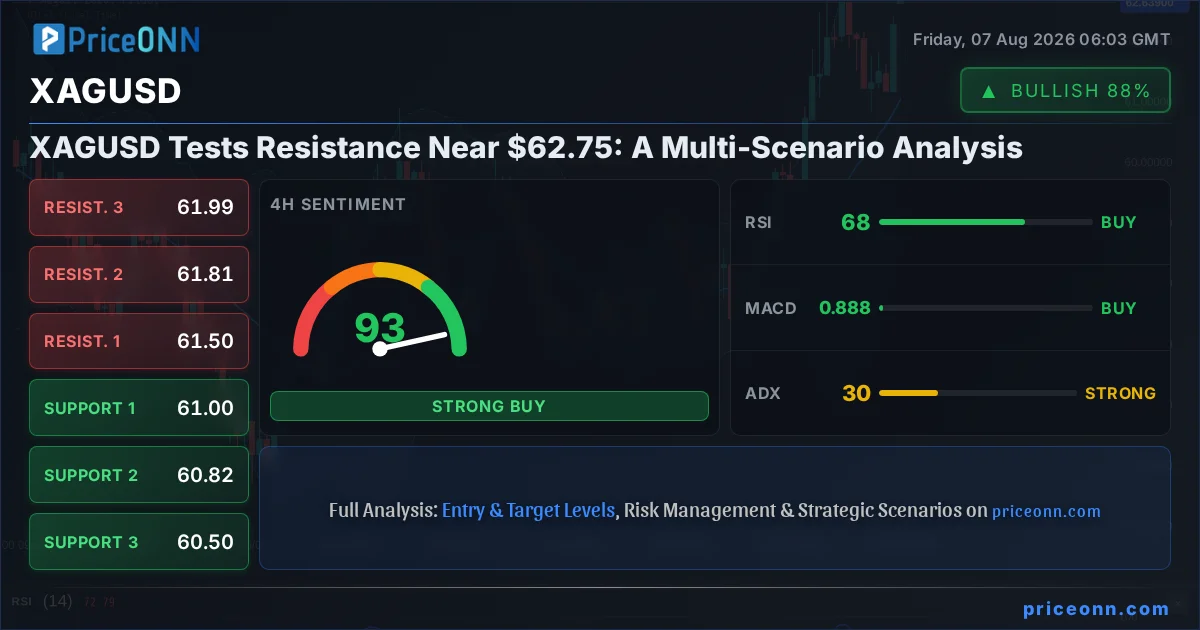
Silver bulls are eyeing the $62.75 mark, but a critical confluence of resistance looms. The precious metal has shown remarkable resilience, but the path forward hinges on breaking through key technical barriers. With the current price hovering precariously near resistance levels, traders are dissecting multiple potential scenarios, each with distinct triggers, invalidation points, and price targets. This deep dive into XAGUSD's technical landscape aims to provide clarity amidst the current market choppiness, leveraging real-time data to map out probable price action.
- RSI at 63.68 signals a neutral-to-bullish leaning, indicating room for further upside but cautioning against extreme overbought conditions.
- The critical resistance level to watch is $62.63, a break above which could target $62.77 and potentially higher.
- ADX at 21.69 on the 1H chart suggests a moderately trending market, while the 4H ADX at 30.27 indicates a stronger trend is developing.
- Conflicting Stochastic signals across timeframes (bullish on 1H/1D, bearish on 4H) highlight the current indecision and potential for volatility.
The XAGUSD pair is currently trading at $62.75, a level that has drawn significant attention from market participants. Recent price action indicates a steady climb, with the 1-hour chart showing a strong bullish trend (92% strength) and the 4-hour chart confirming this with 98% strength. However, the daily timeframe presents a more neutral picture (50% strength), suggesting that the intraday momentum might face headwinds as the week progresses. This divergence across timeframes is crucial for understanding the immediate trading landscape and anticipating potential reversals or continuations.
On the 1-hour chart, the technical indicators paint a largely bullish picture. The Relative Strength Index (RSI) at 60.69 is firmly in neutral territory, but with an upward inclination, suggesting buyers still have some fuel. The Moving Average Convergence Divergence (MACD) is showing positive momentum, with the MACD line above its signal line. Bollinger Bands are trading above the middle band, also favoring an upside bias. The Stochastic Oscillator, with %K at 95.9 and %D at 69.23, is screaming 'bullish' and is in extreme overbought territory, indicating that a short-term pullback or consolidation is highly probable. The Average Directional Index (ADX) at 23.22 suggests a moderate upward trend is in play, not yet a runaway train, but certainly showing directional intent. Overall, the 1H timeframe leans heavily towards a 'BUY' signal, with 8 out of 8 indicators aligning.
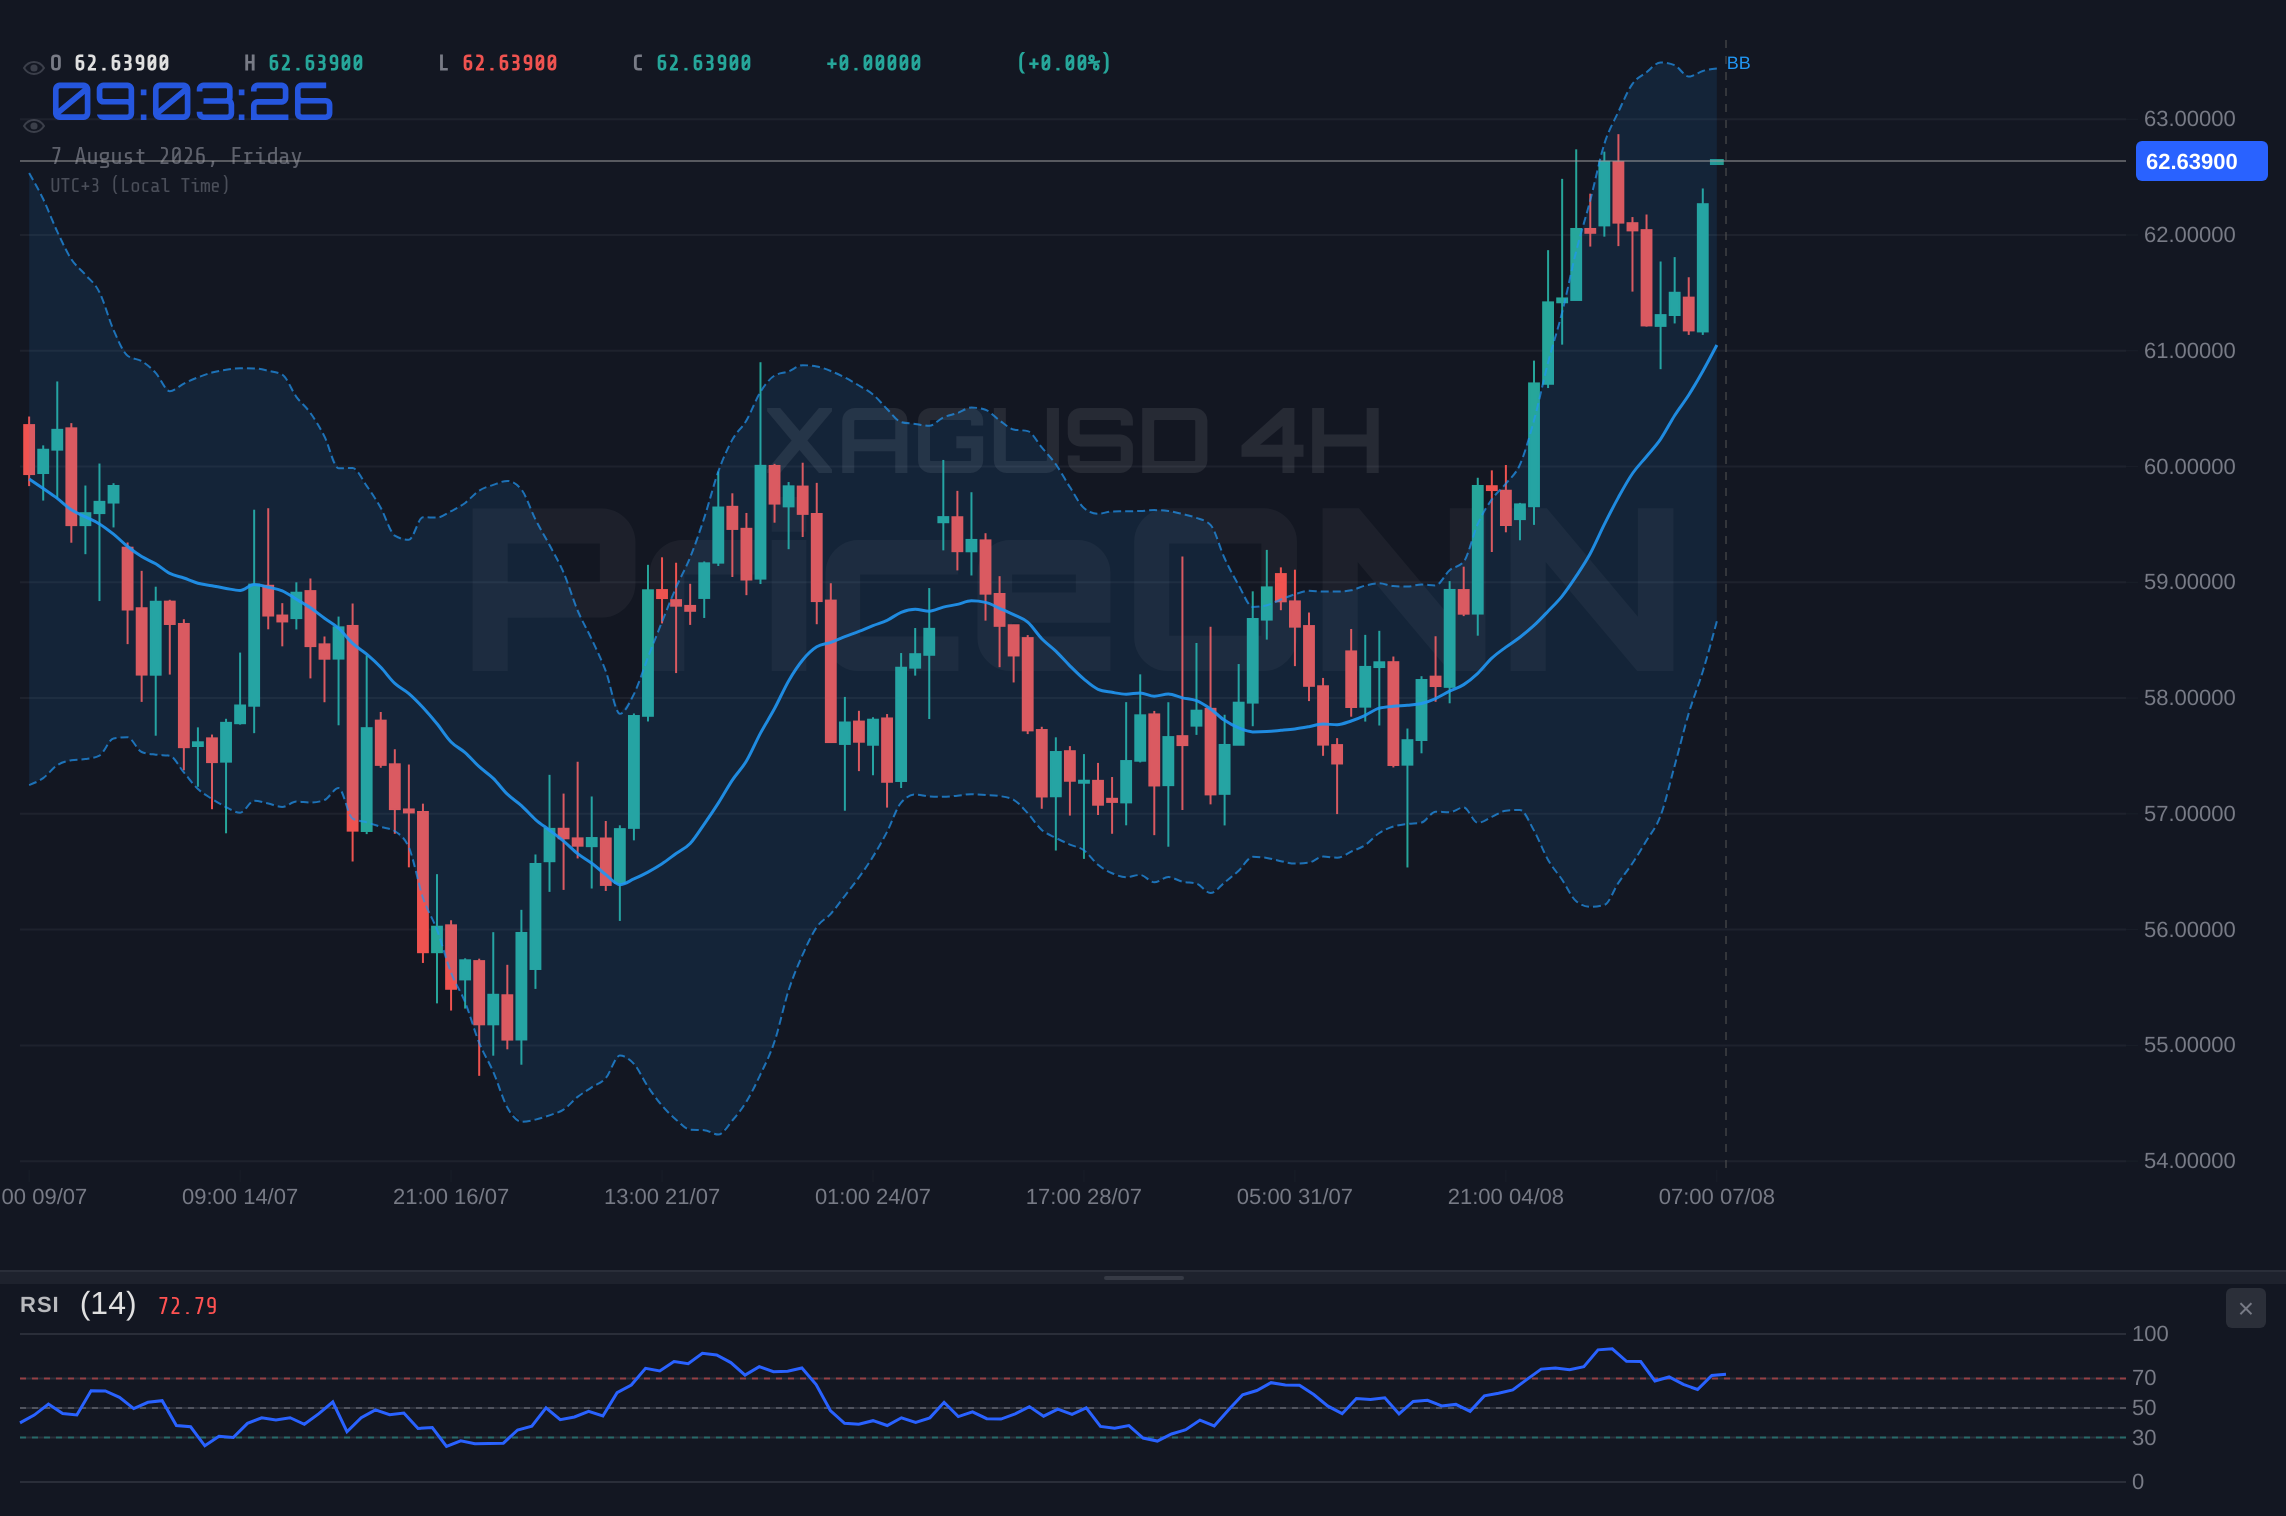
Shifting to the 4-hour timeframe, the bullish sentiment persists, though with some cautionary notes. The trend strength is robust at 98%. The RSI is at 69.66, inching closer to the overbought zone, which could signal limited upside in the short term. MACD continues to display positive momentum. Bollinger Bands remain above the middle band. However, the Stochastic Oscillator presents a conflicting signal here: %K at 56.23 and %D at 70.78 indicate a bearish crossover, suggesting potential downside pressure. The ADX at 35.44 confirms a strong upward trend, reinforcing the bullish bias but also highlighting the potential for significant price swings. The overall signal here is 'BUY' (7 buys, 1 sell), but the Stochastic divergence warrants attention.
The daily chart offers a broader perspective, revealing a market that is currently in a neutral trend (50% strength). This suggests that while shorter-term timeframes might be bullish, the longer-term picture is less clear-cut. The RSI at 62.31 remains in neutral territory, still showing an upward bias. MACD is positive and above its signal line, and Bollinger Bands are trading above the middle band. The Stochastic Oscillator, however, shows %K at 87.93 and %D at 59.65, presenting a strong bullish signal and entering the overbought zone. The ADX at 26.43 indicates a strong trend, which, when viewed against the daily neutral trend strength, could imply that the current trend is consolidating before a potential larger move. The daily timeframe also leans towards a 'BUY' signal (7 buys, 1 sell), but the neutral trend strength is a critical factor to consider for longer-term outlooks.
The Bull's Roadmap: Breaking Resistance
For the bulls to maintain control and push XAGUSD higher, a decisive break above the immediate resistance is paramount. The 1-hour chart shows immediate resistance at $62.68, $62.72, and $62.77. A sustained push above these levels, particularly clearing the $62.77 mark, would signal strong buying conviction. The underlying trend strength across multiple timeframes (92% on 1H, 98% on 4H) supports this potential upside. Confirmation would come from the RSI moving decisively above 70 without immediately triggering a bearish Stochastic crossover, as seen on the 4-hour chart. If this bullish scenario unfolds, the next logical targets would be the 4-hour resistance levels at $62.77, $62.81, and $62.90, followed by the daily resistance at $63.05. The ADX values suggest that if a breakout occurs, it could be supported by a strong trend, especially on the 4-hour timeframe (ADX 30.27).
The key condition for this bullish scenario is not just breaching resistance, but holding above it. A close above $62.77 on the 1-hour chart, followed by a successful retest of this level as support, would be a strong indicator of continued upside momentum. The daily chart's resistance at $62.88 is the next major hurdle. Breaking this level would open the door for a more significant rally, potentially targeting the higher daily resistance points at $63.36 and $63.69. The current market sentiment, influenced by a strong DXY at 99.99 and a rising S&P 500 at 6572.87, suggests that risk appetite is present, which could indirectly support precious metals like silver if inflation concerns remain elevated. However, the conflicting Stochastic signals require traders to remain vigilant for sharp reversals.
Where Bears Could Take Control: Testing the Limits
Conversely, the bears have several technical cues that could signal a reversal or a significant pullback. The immediate resistance levels, particularly around $62.75, are critical. If XAGUSD fails to break decisively above $62.77, especially if coupled with increasing selling pressure, the short-term bullish momentum could quickly evaporate. The Stochastic Oscillator on the 4-hour chart already shows a bearish divergence (%K
The immediate support levels on the 1-hour chart are $62.58, $62.42, and $62.38. A break below $62.58 would be the first sign of weakness, potentially triggering a move towards the 4-hour support at $62.38. If this level fails, the next significant support lies at $62.18, followed by $62.09. A decisive break below $62.09 would invalidate the short-term bullish trend and open the door for a deeper correction, possibly targeting the 4-hour support cluster around $61.00. The daily chart's neutral trend strength suggests that the market is not strongly committed to a direction, making it vulnerable to shifts in sentiment. Geopolitical news, such as the ongoing Hormuz crisis mentioned in recent reports, could inject volatility, potentially driving safe-haven demand into gold and silver if tensions escalate, or causing sell-offs if optimism prevails.
The Waiting Game: Consolidation and Uncertainty
A neutral scenario, characterized by consolidation and range-bound trading, is also a strong possibility given the mixed signals across different timeframes. The immediate resistance at $62.75 and immediate support around $62.58 could act as a tight trading range for the near term. This is particularly plausible if key economic data releases, such as upcoming employment reports or central bank statements, create uncertainty and prompt traders to stay on the sidelines. The ADX values, while indicating trend strength on the 4H (30.27) and 1H (23.22), are not excessively high, suggesting that the current trend might lack the conviction for a sustained breakout in either direction without further catalysts.
In this range-bound environment, the Stochastic Oscillator's conflicting signals could exacerbate the sideways movement. As %K and %D oscillate, they might trap traders on the wrong side of short-term moves. The daily RSI at 62.31 suggests there's still room for upside, but the neutral trend strength on the daily chart acts as a ceiling, preventing a full-blown rally. Traders in this scenario would focus on the boundaries of the range: buying near the lower support levels ($62.18, $62.09) and selling near the upper resistance levels ($62.68, $62.77). Volume analysis would be critical here; a lack of significant volume on attempted breakouts would further support the consolidation thesis. The overall market context, with indices like SP500 at 6572.87 showing strength while DXY battles near 100, presents a complex backdrop that could easily lead to indecision in silver markets.
Scenario Probabilities and What's Driving Them
Considering the technical confluence of resistance near $62.75, the conflicting Stochastic signals, and the varying trend strengths across timeframes, the most probable scenario in the immediate short term (intraday to 24 hours) leans towards a **bearish consolidation or a slight pullback**. The immediate resistance at $62.75, coupled with the 4-hour Stochastic bearish divergence and the daily chart's neutral trend strength, suggests that overcoming this level will be challenging without a significant catalyst. We assign a **45% probability** to this bearish consolidation scenario, where price might struggle to break higher and could retreat towards the $62.38 - $62.18 support zone.
The second most likely scenario is a **bullish breakout**, driven by strong buying pressure and potentially positive economic news or escalating geopolitical tensions that boost safe-haven demand. The strong trend strength on the 1H and 4H charts provides a foundation for this. We assign a **35% probability** to this scenario. This would require XAGUSD to decisively break and hold above $62.77, with subsequent targets at $62.90 and potentially challenging the $63.05 daily resistance. Confirmation would be key, especially seeing the RSI move above 70 and the Stochastic on the 4H chart align bullishly.
Finally, the neutral or range-bound scenario, where XAGUSD trades sideways between defined support and resistance, holds a **20% probability**. This scenario is less likely in the immediate term given the strong intraday trend but could emerge if market participants await major economic events like the US Non-Farm Payrolls (NFP) report or Fed policy cues. In this case, price action would likely oscillate between the $62.18 support and $62.77 resistance, offering range-trading opportunities.
What I'm Watching This Week: Key Triggers for XAGUSD
This week, all eyes will be on the immediate resistance zone around $62.75-$62.88. A clean break and sustained hold above this area, ideally accompanied by strong volume and positive confirmation from oscillators like the RSI moving out of neutral territory, would be the primary bullish trigger. Conversely, a failure to break higher, coupled with a break below the 1-hour support at $62.58 and subsequently the 4-hour support at $62.38, would serve as the key bearish trigger. Traders should also monitor the DXY movements; a significant move above 100.1 could add pressure on XAGUSD, while a retreat below 99.90 might offer some respite.
The Stochastic Oscillator's behavior across the 1H and 4H charts will be critical. A bullish alignment on both, or a bearish alignment on both, would provide clearer directional signals. Currently, the divergence between the two timeframes adds to the uncertainty. Keep an eye on the ADX values as well; a sustained rise above 30 on the daily chart would indicate a more robust trend is forming, making breakouts more sustainable. Given the mixed signals and the proximity to resistance, a cautious approach is warranted. Patience will be key, waiting for clear confirmation before committing to a trade. The market's ability to hold above or break below these critical levels will dictate the next significant move.
Bearish Scenario: Pullback Underway
45% ProbabilityBullish Scenario: Resistance Breakout
35% ProbabilityNeutral Scenario: Range-Bound Trading
20% Probability| Indicator | Value | Signal | Interpretation |
|---|---|---|---|
| RSI (14) | 63.68 | Neutral | Room for upside, but approaching overbought on 4H |
| MACD Histogram | Positive | Bullish Momentum | Positive on 1H/4H, but watch for divergence |
| Stochastic | K=95.02, D=78.34 (1H) | Bullish (Extreme) | Overbought on 1H, but bearish crossover on 4H |
| ADX | 21.69 | Moderate Trend | Stronger trend on 4H (30.27), weak on Daily (26.43) |
| Bollinger Bands | Above Mid | Bullish Bias | Suggests upward pressure, but watch for breakouts/reversals |
Frequently Asked Questions: XAGUSD Analysis
What happens if XAGUSD breaks above the $62.77 resistance level?
A sustained break above $62.77, confirmed by RSI moving above 70 and bullish Stochastic alignment on the 4H chart, would likely trigger a bullish scenario targeting $62.90 and potentially $63.05. This suggests strong buying conviction and could initiate a further upward move.
Should I consider selling XAGUSD if it fails to break $62.75, given the current technical signals?
If XAGUSD fails to break above $62.75 and shows signs of weakness, such as breaking below $62.58, a bearish scenario becomes more probable. The 45% probability assigned to this scenario suggests caution, with potential targets at $62.38 and $62.18. Monitoring for bearish Stochastic divergence would be a key confirmation.
Is the RSI at 63.68 a sell signal for XAGUSD right now?
An RSI of 63.68 is in neutral territory with an upward bias, not typically a sell signal on its own. It indicates room for further price appreciation but also suggests that the market is not yet extremely overbought. A move above 70 would be needed to signal overbought conditions, and even then, confirmation from other indicators like Stochastic or price action is crucial.
How might the current DXY level of 99.99 affect XAGUSD's price action this week?
The DXY at 99.99, hovering near key psychological levels, exerts pressure on dollar-denominated assets like XAGUSD. A sustained move by the DXY above 100.00 could dampen silver's upside potential, while a pullback in the dollar index might provide support for silver. Traders should watch for correlations, as a stronger DXY often leads to weaker silver prices.
Track markets in real-time
AI-powered analysis, technical indicators and real-time price data.
Join Our Telegram Channel
Breaking market news, AI analysis and trading signals instantly.
Join Channel