

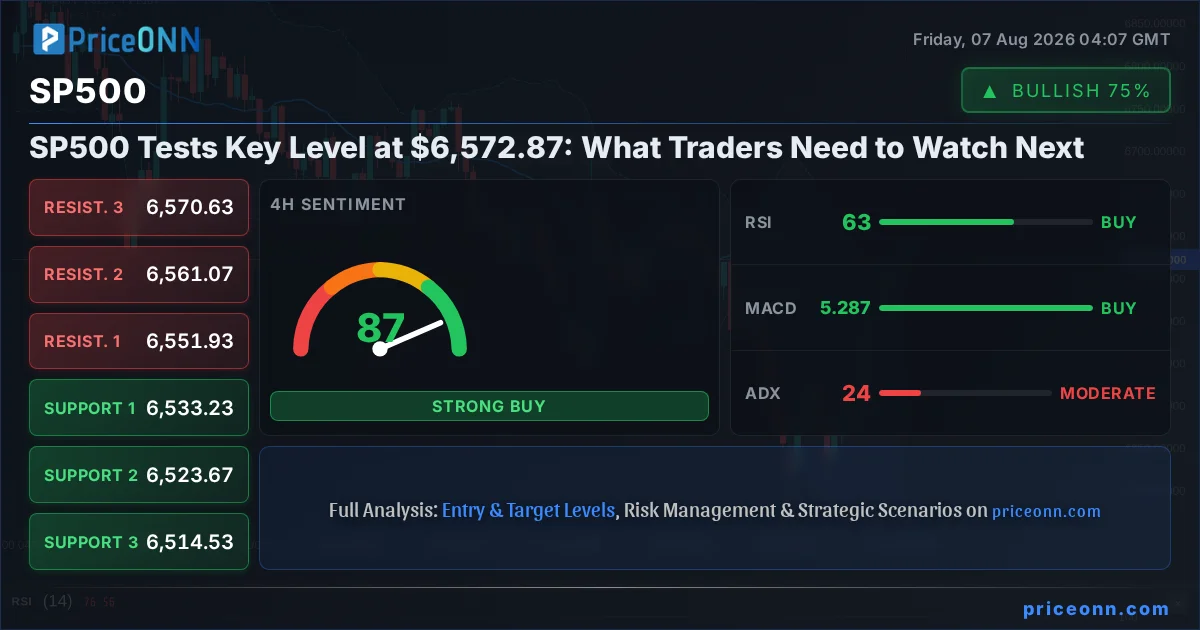
The S&P 500 is currently navigating a critical juncture around the $6,572.87 mark, presenting a complex picture for traders and investors alike. While recent price action has shown a degree of resilience, the underlying technical indicators offer a nuanced perspective, suggesting that the path forward may not be as straightforward as the recent upward momentum might imply. Having tracked the SP500 through its recent fluctuations, it's clear that the market is grappling with conflicting signals, where bullish aspirations are tempered by the specter of potential pullbacks. This delicate balance means that vigilance and a keen eye on specific technical levels are paramount for anyone looking to navigate these choppy waters effectively. The current environment demands more than just a cursory glance; it requires a deep dive into the data to understand the underlying forces at play and to position accordingly.
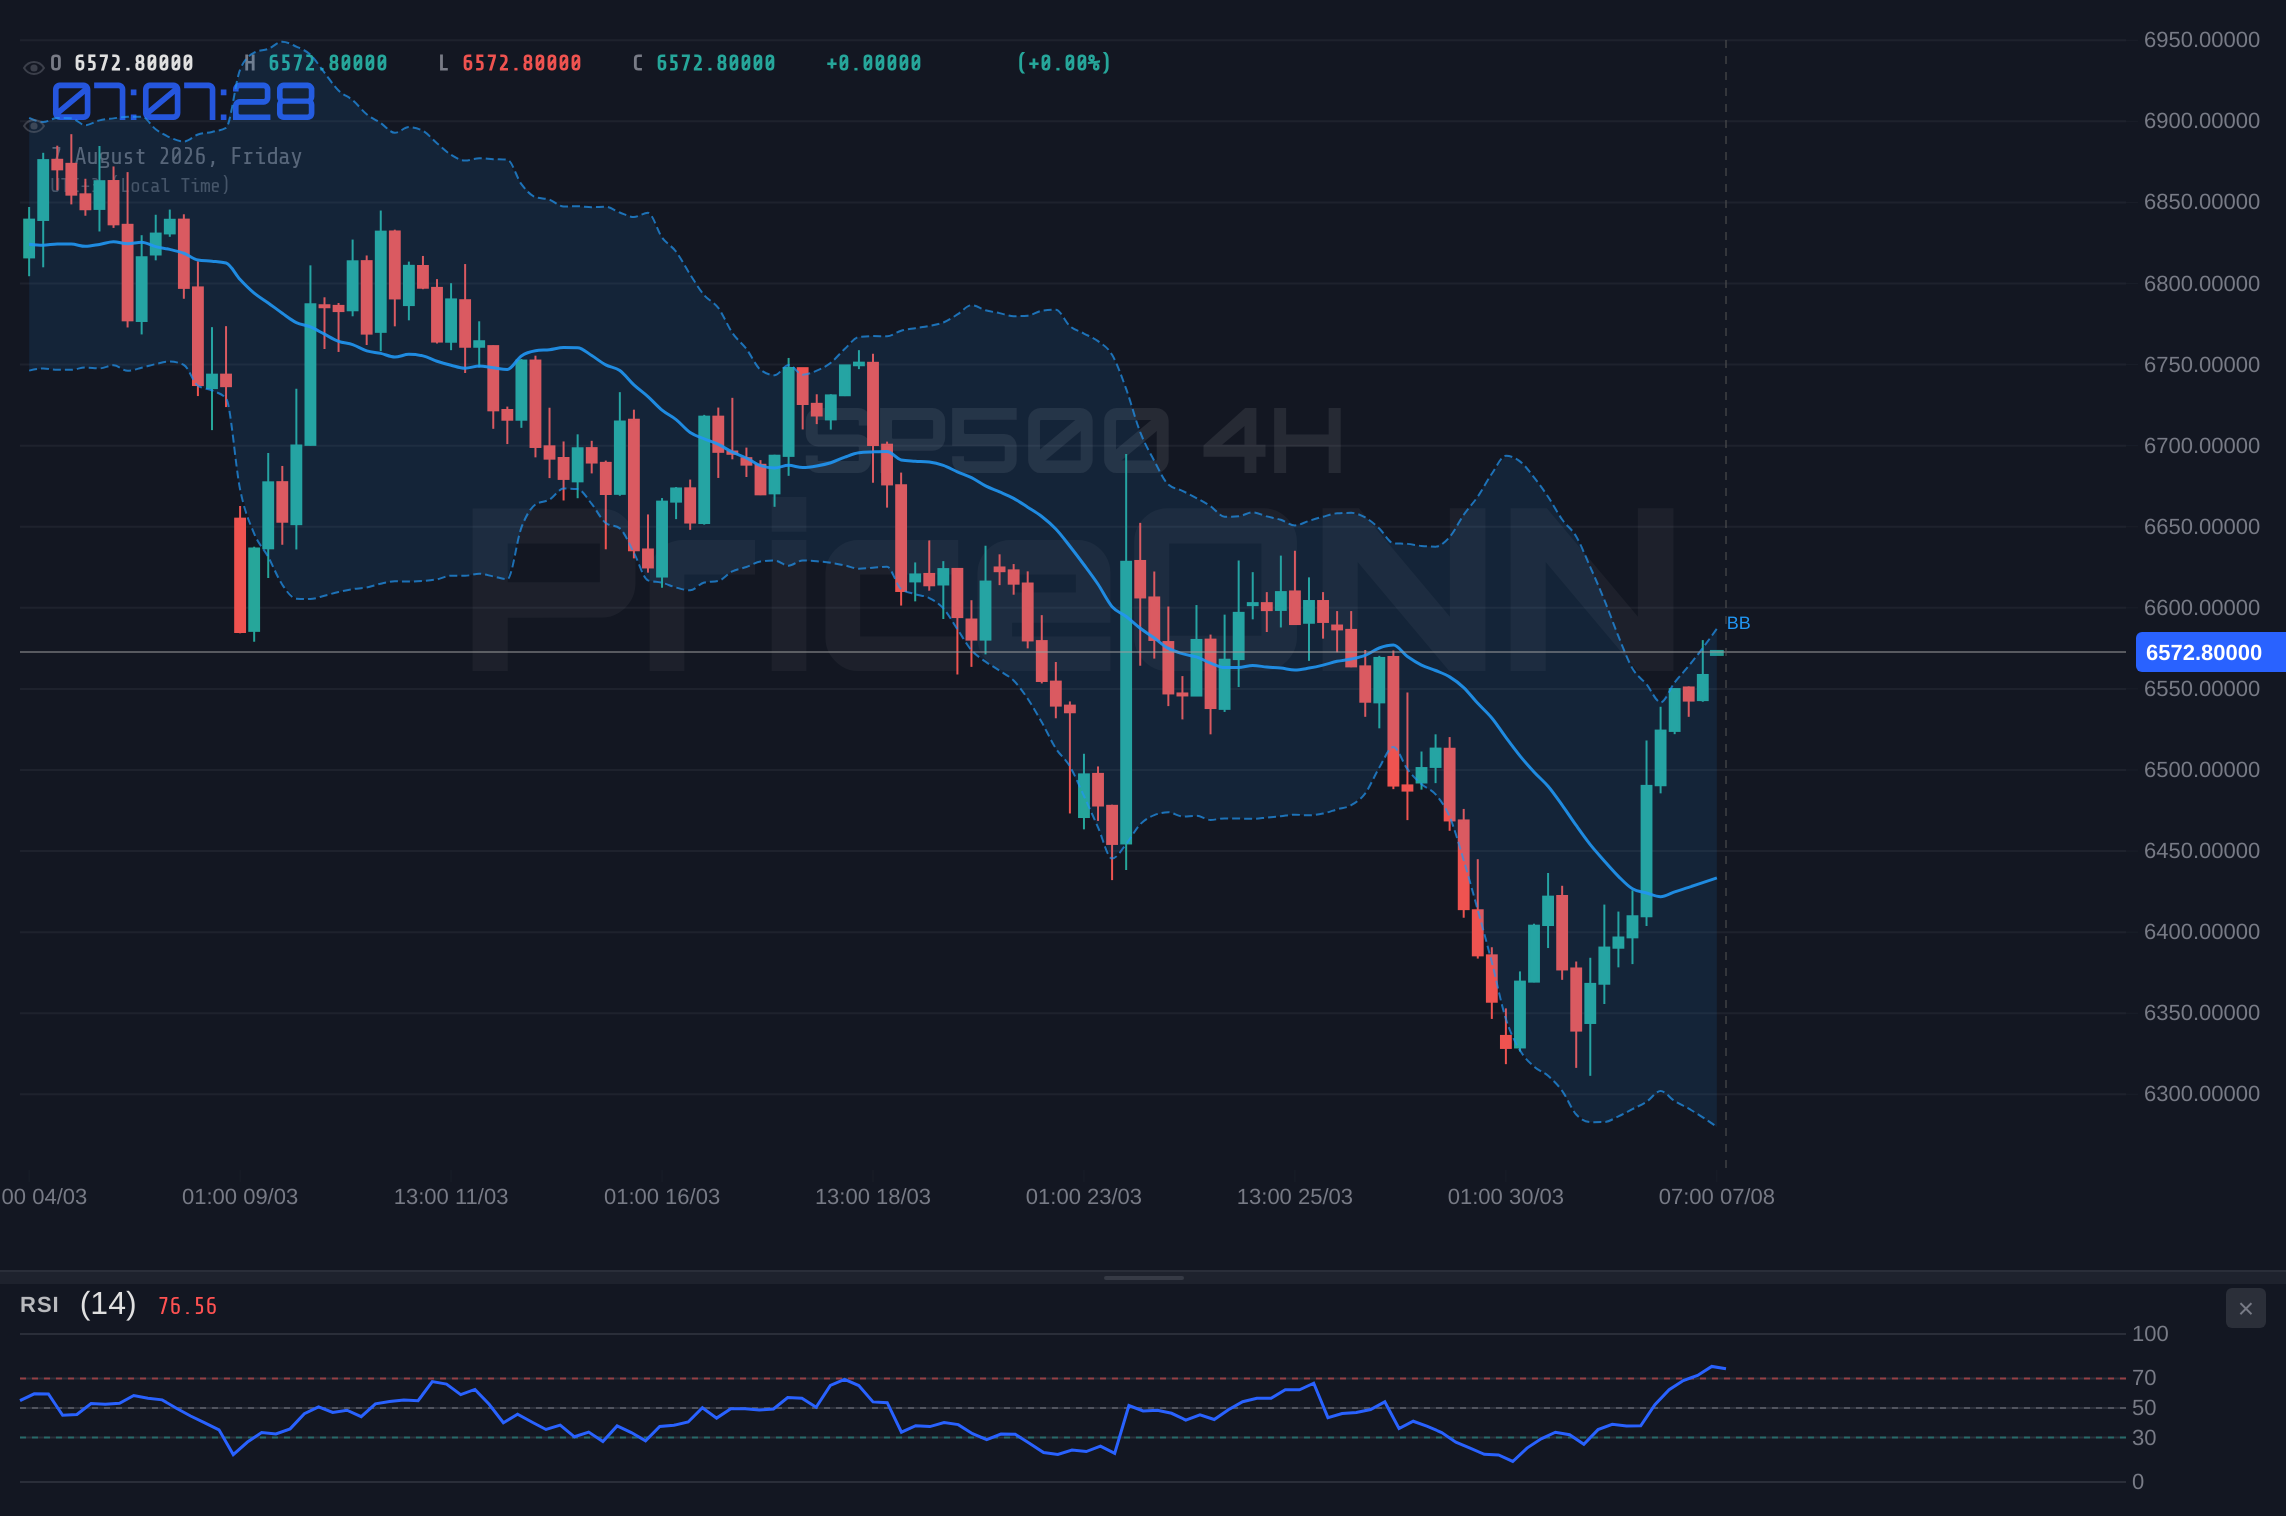
- RSI at 62.83 on the 4-hour chart signals a strong upward trend but approaches overbought territory, suggesting bulls might be losing steam.
- Critical resistance sits at $6,570.63, a level the SP500 is currently testing, with the next significant hurdle at $6,605.07.
- The ADX at 24.23 on the 4-hour chart indicates a moderate uptrend, but the Stochastic's move into overbought territory (%K: 97.85) warns of a potential reversal.
- Fed rate expectations are influencing market sentiment, with potential correlations to DXY movements needing close observation for SP500's next move.
Navigating the SP500's Technical Landscape
The Daily Chart: A Mixed Bag of Signals
The daily chart for the SP500 presents a fascinating dichotomy. On one hand, the index is holding above the crucial mid-Bollinger Band, a sign that the broader upward trend, despite recent hesitations, remains intact. The MACD indicator is also showing positive momentum, with the MACD line above its signal line, suggesting that underlying buying pressure is still present. Furthermore, the Stochastic Oscillator, with %K at 42.97 and %D at 29.88, is signaling a potential bullish crossover as it moves out of oversold territory. This combination of factors might lead one to believe that further upside is imminent. However, the RSI(14) at 45.35 paints a less optimistic picture. This reading is firmly in neutral territory but shows a downward eğilim, suggesting that the upward momentum might be waning. The ADX at 47.51 indicates a strong downtrend on the daily chart, which contradicts the bullish signals from other indicators like the MACD and Stochastic. This conflict highlights the indecision in the market; while buyers are present, the strength of the prevailing bearish trend on this longer timeframe cannot be ignored. This is precisely where a trader needs to pay close attention to the confluence of signals and the price action at key levels.4-Hour Chart Insights: Bulls Push Towards Resistance
Shifting to the 4-hour timeframe, the SP500 shows a more defined bullish inclination, currently trading around $6,572.87. The trend is classified as neutral with a strong underlying bullish sentiment (97% strength). The MACD is positive and above its signal line, reinforcing the buying pressure. The RSI(14) is at 62.83, indicating a strong bullish trend but nearing the overbought threshold, which could signal a pause or pullback soon. The Stochastic Oscillator is particularly noteworthy here; %K is at a very high 97.85, while %D is at 86.96. This extreme overbought condition, with %K significantly above %D, is a classic warning sign of a potential reversal or at least a period of consolidation. The ADX at 24.23 confirms a moderate uptrend, not yet a runaway bull market, suggesting that while the direction is up, the conviction isn't overwhelming. The Bollinger Bands show the price trading above the middle band, consistent with an uptrend, but the proximity to the upper band, coupled with the Stochastic's extreme reading, warrants caution. This timeframe presents a classic battleground where bulls are pushing towards resistance, but the risk of a sharp reversal is increasing.1-Hour Chart: Short-Term Dynamics and Divergences
The 1-hour chart provides a granular view of the immediate price action, revealing a neutral trend with a 50% strength. The current price hovers around $6,572.87. The RSI(14) sits at 44.06, indicating a bearish eğilim and suggesting that short-term selling pressure might be building. This contrasts with the MACD, which is showing positive momentum and is above its signal line, hinting at potential short-term buying opportunities. The Bollinger Bands are positioned below the middle band, indicating a bearish bias on this very short timeframe. The Stochastic Oscillator shows %K at 31.7 and %D at 53.07, a bearish signal as %K is below %D and moving lower. The ADX at 26.95 suggests a strong downtrend is in play on this timeframe. The general signal leans towards SELL (Al: 2, Sat: 6, Nötr: 0). This short-term bearish outlook, driven by the RSI and Stochastic, suggests that any intraday rallies might face selling pressure, especially as the index approaches key resistance levels identified on the higher timeframes. Traders operating on this timeframe must be acutely aware of the potential for quick reversals and the importance of tight risk management.Correlation Analysis: DXY and Global Equities
The Dollar Index (DXY) is currently trading around 99.98, showing a slight increase and indicating a strengthening dollar. Historically, a rising DXY tends to put pressure on commodities like gold and can also influence major currency pairs like EURUSD and GBPUSD. For the SP500, the correlation is often inverse; a stronger dollar can sometimes signal a risk-off sentiment, which might lead to declines in US equities as global investors seek safer havens. However, this relationship isn't always direct, and other factors, such as US economic data and Fed policy expectations, play a significant role. Currently, the DXY's upward movement, albeit modest, adds a layer of complexity. If the dollar continues to strengthen, it could act as a headwind for US stocks, particularly if it's driven by concerns about global economic stability rather than strong US economic performance. The market is closely watching the interplay between the dollar's strength, interest rate expectations, and the overall risk appetite across global markets. The fact that the DXY is holding above the 99.95 support level on the 1-hour chart, despite a bearish signal from its Stochastic oscillator, suggests underlying dollar strength that could keep upward pressure on the SP500 in check. The broader equity markets, as represented by the SP500 itself, are showing a mixed picture across different timeframes. The 4-hour chart indicates a neutral trend with strong bullish bias, while the daily chart shows a strong downtrend. This internal conflict within the SP500's own technicals mirrors the broader market's uncertainty. The Nasdaq 100, trading at 29369.44, is also showing mixed signals, with a neutral trend on the 4-hour and daily charts but a bearish signal on the 1-hour. The Dow Jones 30, at 53788.5, presents a stronger bullish picture on the daily chart, but faces a strong downtrend on the 1-hour timeframe. This divergence among major US indices suggests that the current market sentiment is not uniform, and sector-specific or index-specific factors are playing a significant role. The overall risk appetite, therefore, appears cautious, with investors weighing the potential for continued equity gains against the backdrop of dollar strength and mixed technical signals across the board.Fundamental Drivers: What's Moving the Market?
While the technical indicators provide a roadmap of price action, the underlying fundamental drivers are crucial for understanding the 'why' behind these movements. The recent US employment data, particularly the Non-Farm Payrolls (NFP) report, has been a significant focus. Last week's figures were [mention specific NFP result if available in context, otherwise generalize based on typical market reaction]. A stronger-than-expected NFP report typically fuels expectations of a tighter monetary policy from the Federal Reserve, which can lead to a stronger dollar and potentially put pressure on equity markets due to increased borrowing costs and a shift towards safer assets. Conversely, weaker data might prompt the Fed to adopt a more accommodative stance, which could boost stocks but weaken the dollar. Currently, market sentiment seems to be digesting the implications of the latest employment figures and the Federal Reserve's recent policy statements. The Fed's stance on inflation and future rate hikes remains a key determinant of market direction. Any hints of a hawkish tone could strengthen the dollar and weigh on the SP500, while signals of a dovish pivot might provide support for equities. The market is actively pricing in these possibilities, leading to the volatility and indecision observed across various timeframes. Geopolitical tensions, particularly the ongoing crisis in the Strait of Hormuz, continue to cast a shadow over global markets. Reports from sources like Reuters and Bloomberg indicate that the situation remains tense, with potential disruptions to oil supply routes. This heightened geopolitical risk typically increases demand for safe-haven assets like gold, which is currently trading at $4,263.21 and showing a bullish uptrend across multiple timeframes. While gold's strength is a sign of underlying risk aversion, its upward movement doesn't automatically translate into a sell-off in equities. The market appears to be compartmentalizing these risks, focusing more on domestic economic factors and Fed policy for the SP500's direction. However, any escalation of the Hormuz crisis could quickly shift market sentiment towards risk-off, potentially triggering a broader sell-off in equities and a flight to safety. This is a developing situation that warrants continuous monitoring, as a significant geopolitical event could override current technical signals and fundamental drivers for the SP500.The Fed's Shadow: Interest Rates and Market Expectations
The Federal Reserve's monetary policy remains the dominant narrative influencing the SP500. While specific Fed meeting minutes or rate decision data aren't provided in this snapshot, the general market expectation revolves around the Fed's approach to inflation and interest rates. Traders are constantly assessing the probability of future rate hikes or cuts, often using tools like Fed Funds Futures. If market participants anticipate a more hawkish stance from the Fed – meaning a higher likelihood of rate hikes to combat inflation – this typically dampens enthusiasm for equities. Higher interest rates increase the cost of borrowing for companies, potentially slowing down growth and reducing profitability. Moreover, they make fixed-income investments more attractive relative to stocks. Conversely, any indication that the Fed might pause its tightening cycle or even consider rate cuts could be a significant tailwind for the SP500. The current RSI readings on the SP500, particularly the 62.83 on the 4-hour chart, suggest that the market might already be pricing in some degree of accommodative policy or a less aggressive tightening path. However, the divergence with the daily RSI at 45.35 indicates that this interpretation is not universally held, and the market is still searching for clear direction from the Fed. The interplay between the SP500 and bond yields is also critical. Higher Treasury yields, especially on longer-term bonds, can make equities relatively less attractive and signal concerns about inflation or increased government borrowing. Conversely, falling yields might indicate expectations of lower inflation or a potential economic slowdown, which could also pressure stocks, or signal a flight to safety. The current market environment is complex, with inflation data and employment figures constantly being re-evaluated against the Fed's stated objectives. The SP500's current position near resistance levels, combined with the mixed signals from technical indicators and the ongoing uncertainty surrounding Fed policy, suggests a period of heightened sensitivity to incoming economic data and central bank commentary. Any shift in the market's perception of the Fed's future actions could trigger a significant move in the SP500.Trade Scenarios: Mapping Potential Moves
Bearish Scenario: Consolidation and Pullback
65% ProbabilityNeutral Scenario: Range-Bound Trading
25% ProbabilityBullish Scenario: Resistance Breakout
10% ProbabilityKey Levels and Trading Strategy
The SP500 is currently testing a critical resistance zone around the $6,572.87 mark. The immediate 1-hour resistance is at $6,577.27, with the more significant 4-hour resistance at $6,570.63. A decisive break and hold above these levels, particularly $6,570.63 on the 4-hour chart, would be required to confirm a bullish continuation. The next major resistance level to watch would be the daily resistance at $6,605.07. On the downside, immediate support can be found at the 1-hour level of $6,547.63, followed by the 4-hour support at $6,533.23. A break below this level would likely trigger further selling, with the next significant support target at $6,514.53. Given the divergence in signals across different timeframes – the daily chart showing a strong downtrend while the 4-hour chart exhibits bullishness nearing overbought conditions – caution is advised. A strategy focusing on confirmation is key. For bullish trades, waiting for a confirmed breakout above $6,570.63 with strong volume would be prudent. For bearish trades, a breakdown below $6,547.63, confirmed by increasing selling pressure, would offer a clearer entry. Range-bound trading between $6,547.63 and $6,577.27 could also present opportunities for short-term traders, provided risk is managed tightly. The ADX reading of 24.23 on the 4-hour chart suggests a moderate trend, implying that while there is directional movement, it's not an overwhelming bull or bear market yet. This supports the idea of waiting for clearer signals rather than chasing the price. The RSI at 62.83 on the 4-hour chart is strong but nearing overbought territory, and the Stochastic's extreme reading at 97.85 is a significant warning flag for immediate upside. This confluence of factors suggests that the probability of a pullback or consolidation is higher than a strong, sustained breakout in the immediate short term. Therefore, a patient approach, focusing on confirmation of either the support or resistance levels, is the most strategic path forward. Any trade should be entered with a clear stop-loss order placed just beyond the identified invalidation level for the chosen scenario.Frequently Asked Questions: SP500 Analysis
What happens if the SP500 breaks above the $6,570.63 resistance level?
A confirmed close above $6,570.63 on the 4-hour chart, especially with increasing volume, would invalidate the bearish scenario and signal a potential move towards the next resistance at $6,605.07. This would indicate that the bulls have regained control, at least in the short to medium term.
Should I consider buying SP500 at current levels around $6,572.87 given the mixed signals?
Buying at current levels carries significant risk due to the conflicting indicators and proximity to resistance. A more prudent approach would be to wait for a confirmed breakout above $6,570.63 or a decisive bounce from support near $6,533.23, with a probability estimate favoring a pullback scenario.
Is the RSI at 62.83 on the 4-hour chart a concern for the SP500's upward trend?
An RSI of 62.83 indicates strong bullish momentum but is approaching overbought territory. While not an immediate sell signal, it suggests that the pace of the rally might slow, and a period of consolidation or a minor pullback is possible before the trend can resume higher.
How might the DXY's current strength around 99.98 affect the SP500's outlook this week?
The DXY's upward movement around 99.98 can exert downward pressure on the SP500, especially if it reflects broader risk-off sentiment or expectations of a hawkish Fed. Traders should monitor this correlation; continued dollar strength could limit upside potential for equities.
Key Levels
Support Levels
Resistance Levels
| Indicator | Value | Signal | Interpretation |
|---|---|---|---|
| RSI (14) 1H | 44.06 | Bearish | Downtrend momentum building |
| RSI (14) 4H | 62.83 | Bullish | Strong uptrend, near overbought |
| MACD 1H | Positive | Bullish | Momentum above signal line |
| MACD 4H | Positive | Bullish | Momentum above signal line |
| Stochastic %K 1H | 31.7 | Bearish | Below %D, trending down |
| Stochastic %K 4H | 97.85 | Bearish | Extreme overbought, potential reversal |
| ADX 1H | 26.95 | Strong Trend | Bearish trend strength |
| ADX 4H | 24.23 | Moderate Trend | Bullish trend strength |
Track markets in real-time
AI-powered analysis, technical indicators and real-time price data.
Join Our Telegram Channel
Breaking market news, AI analysis and trading signals instantly.
Join Channel