

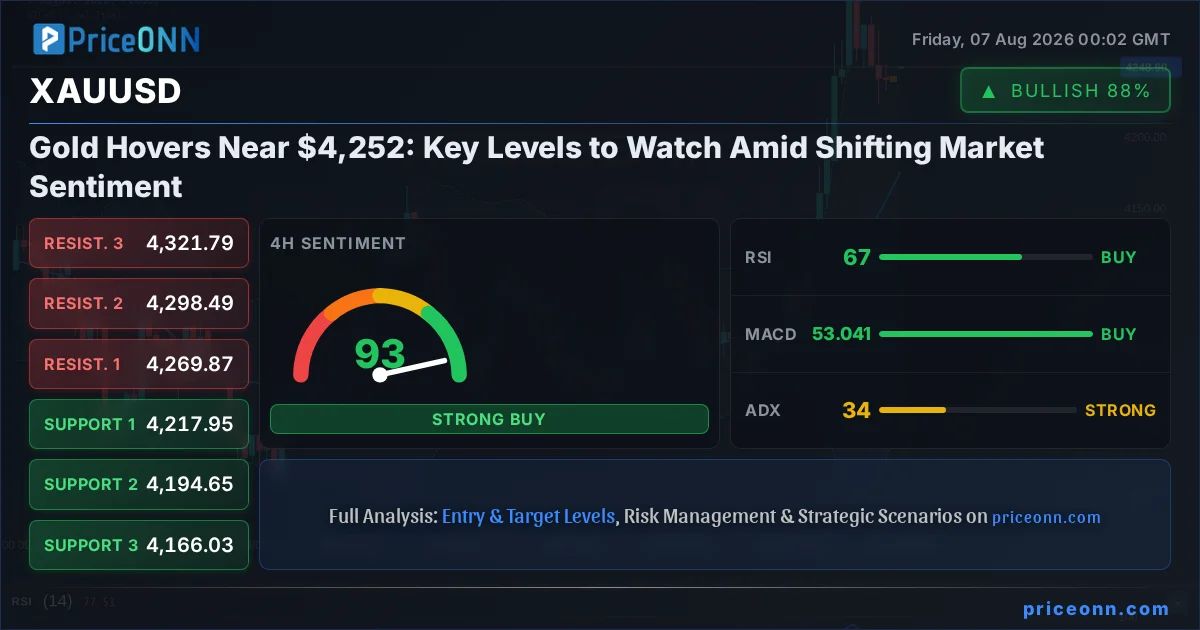
The global financial stage is set for a crucial juncture as gold prices consolidate near the pivotal $4,252.68 mark. This delicate balance comes amidst a complex interplay of geopolitical undercurrents, shifting central bank expectations, and a fluctuating dollar index (DXY). As traders and investors dissect the latest market signals, understanding the key technical levels and the underlying macro drivers becomes paramount. The recent surge in Brent crude oil, climbing to $82.13, injects an inflationary narrative into the market, potentially bolstering gold's appeal as a hedge, yet the stronger DXY at 99.97 presents a counteracting headwind.
- Gold is currently trading near $4,252.68, showing a slight upward bias on the 1-hour chart (RSI 53.81) but facing mixed signals across timeframes.
- Critical support for XAUUSD is identified at $4,236.42, with further levels at $4,232.25 and $4,228.86.
- Key resistance lies at $4,243.98, followed by $4,247.37 and $4,251.54, with a more significant hurdle at $4,269.87 on the 4-hour chart.
- The Dollar Index (DXY) at 99.97 is strengthening, creating headwinds for gold, while rising oil prices ($82.13 for Brent) add an inflationary bid.
- Multi-timeframe analysis suggests a cautious approach, with the 4-hour trend showing strong bullish momentum (ADX 33.96) and the daily chart indicating a neutral stance (ADX 26.27).
The economic calendar remains a critical, albeit quiet, backdrop for gold's immediate price action. While no high-impact events are scheduled for today, the lingering implications of last week's economic data and the anticipation of future central bank commentary continue to shape market sentiment. The recent surprise in New Zealand's employment report, which showed stronger hiring despite a rise in unemployment, highlights the nuanced economic landscape. While not directly impacting gold, such data points contribute to the broader understanding of global economic health and potential policy shifts, which indirectly influence safe-haven assets like gold. Traders are closely watching for any signs of divergence or confluence between inflation expectations and central bank rhetoric, as this often dictates gold's direction.
Navigating the Gold Market: A Tale of Two Trends
The Bullish Undercurrents on Shorter Timeframes
Delving into the technical tapestry of XAUUSD, the 1-hour chart presents a cautiously optimistic picture. The current price of $4,252.68 is finding itself just below the immediate resistance at $4,243.98. However, the Relative Strength Index (RSI) at 53.81, while in neutral territory, shows a subtle upward inclination, hinting that buyers are not entirely absent. The Stochastic Oscillator, with K at 40.98 and D at 36.99, also favors a bullish continuation, suggesting that any pullback might be short-lived. The ADX reading of 32.13, despite its strength, is associated with a *falling* trend on this timeframe, a point of caution that suggests the underlying momentum might not be as robust as the bullish signals imply. This divergence between momentum indicators and trend strength warrants a watchful eye, as it could signal a potential shift or consolidation rather than a sustained rally.
The MACD indicator on the 1-hour chart, however, paints a less rosy picture, showing negative momentum with the MACD line below its signal line. This suggests that while some oscillators are hinting at potential upside, the underlying momentum is currently favoring sellers. This conflict between indicators is a classic sign of a market in transition, where short-term traders might find opportunities but long-term trend followers should exercise restraint. The Bollinger Bands also add to this nuance, sitting below the middle band, indicating a slight bearish bias on this very short-term view. The proximity of immediate support at $4,236.42 means that any slip could quickly test these lower levels, making risk management crucial for intraday traders.
The Stronger Bullish Momentum on the 4-Hour Chart
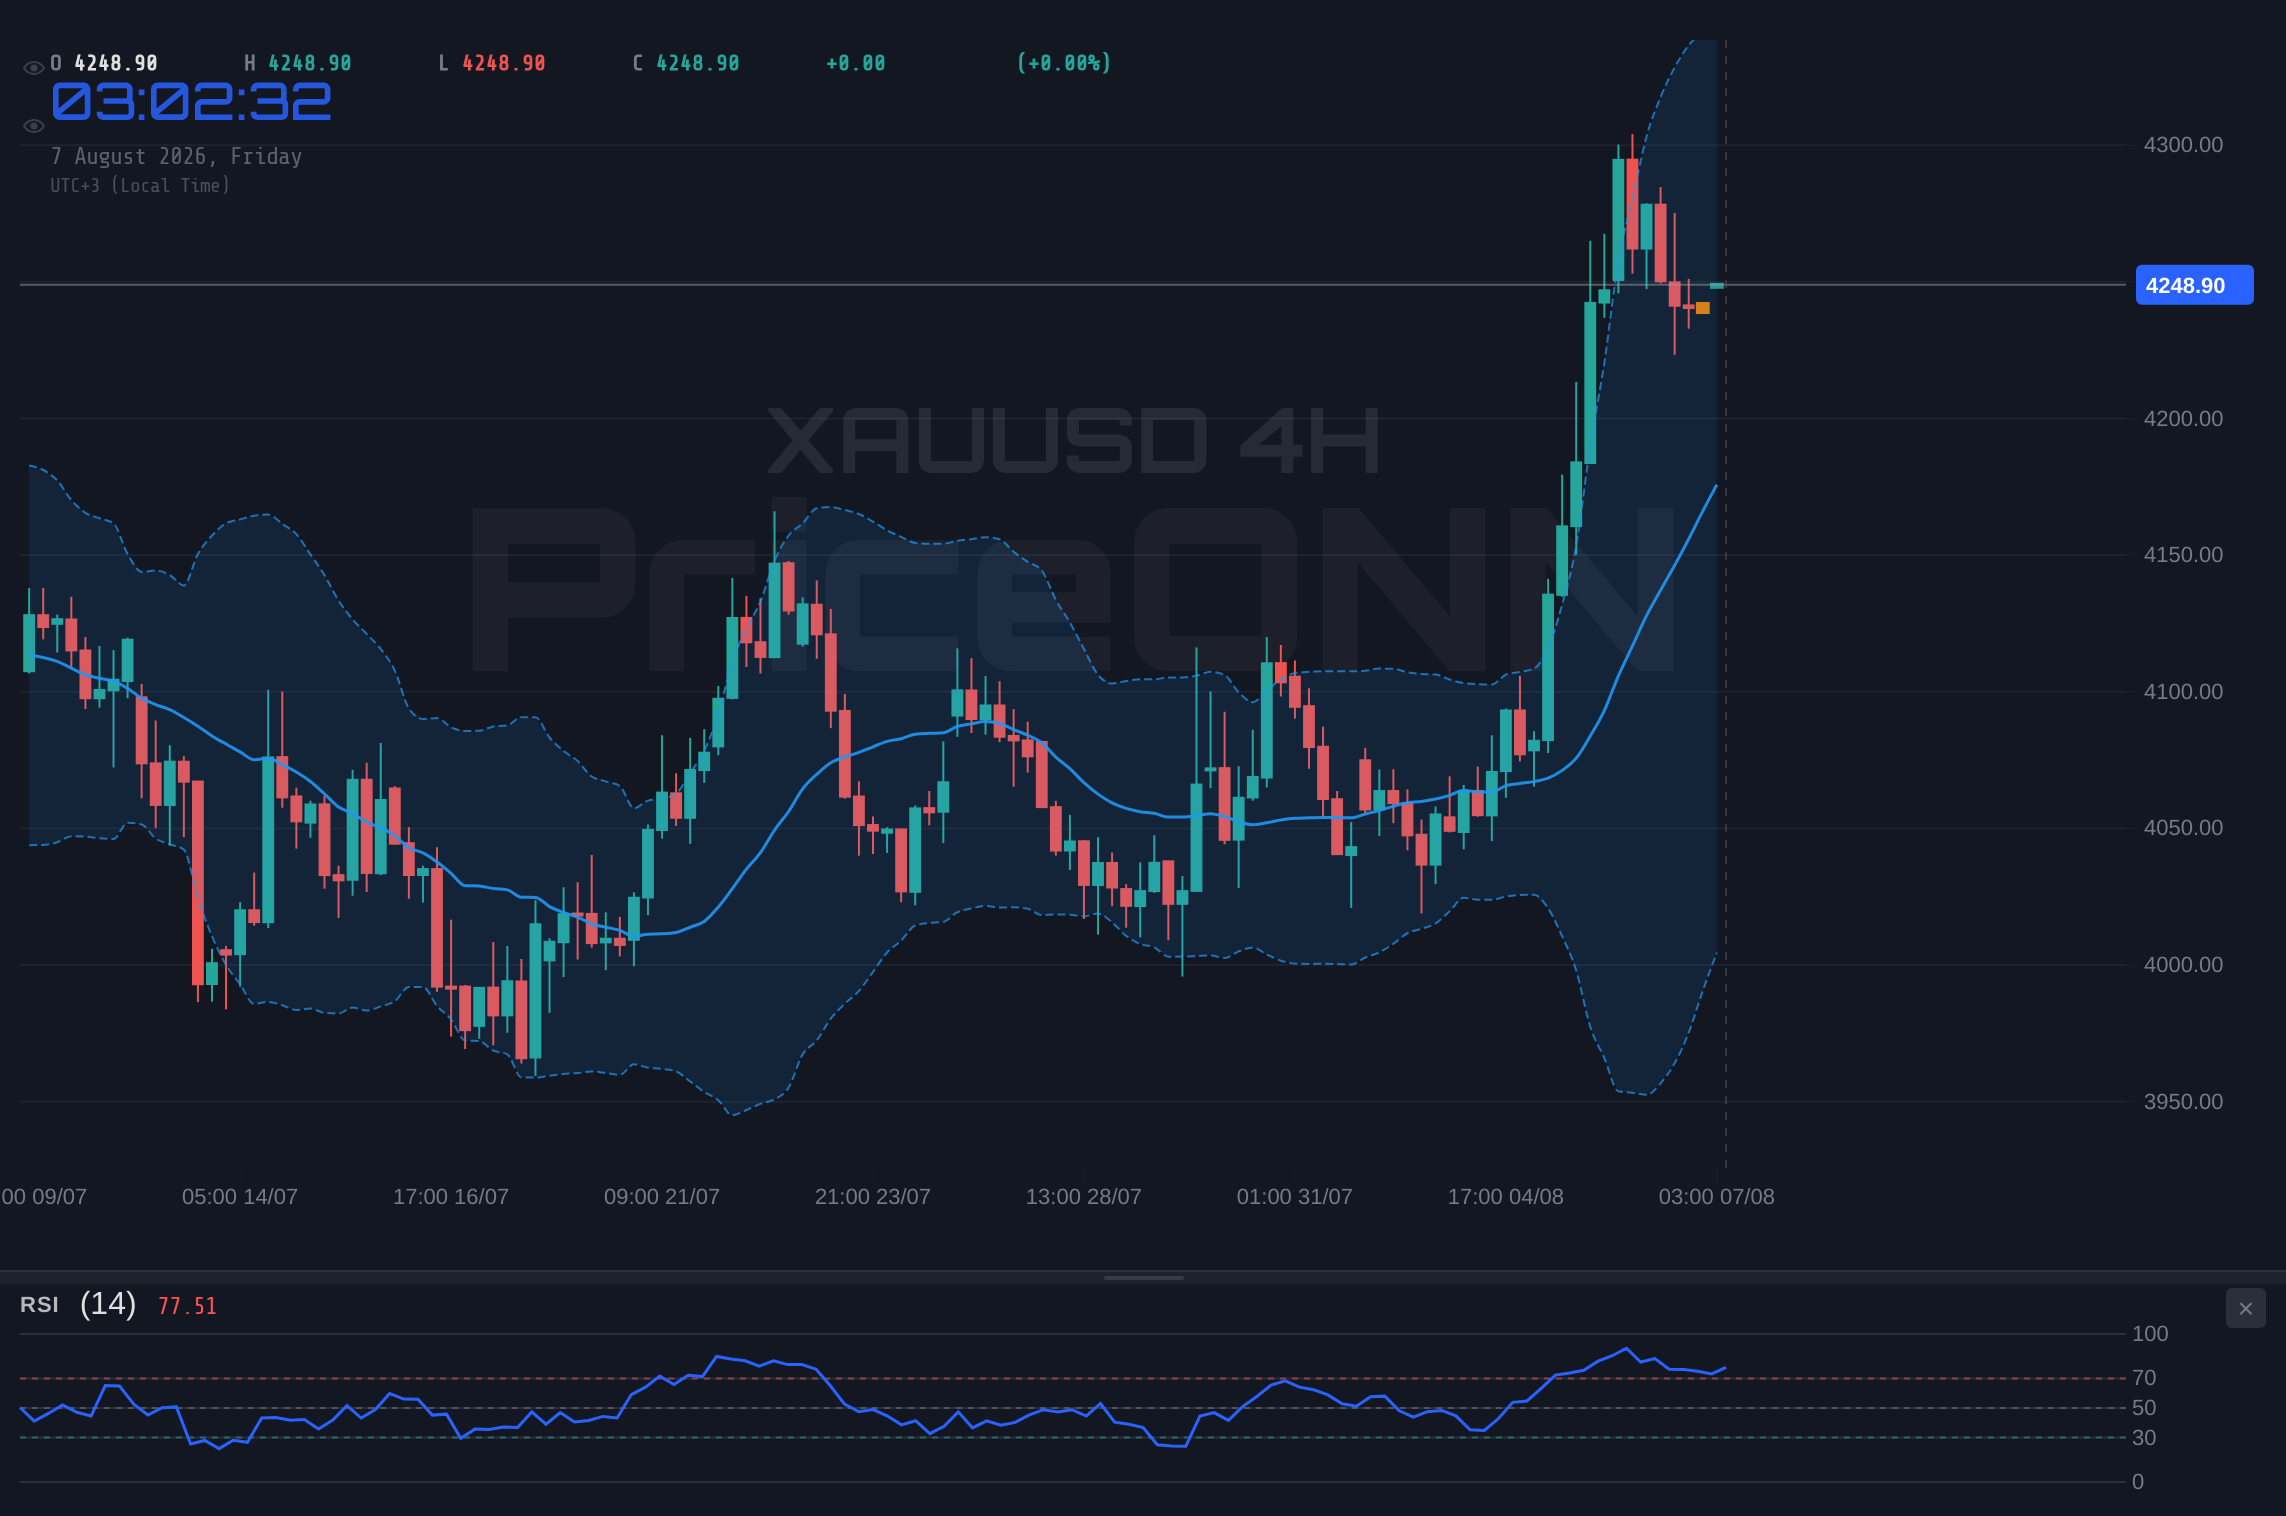
Stepping back to the 4-hour timeframe, the narrative for gold becomes significantly more bullish. The trend strength is robust at 97%, with the ADX standing firm at 33.96, clearly indicating a strong upward trend is in play. The current price of $4,252.68 is now comfortably above the middle Bollinger Band, and the MACD is showing positive momentum with the MACD line above its signal line. This confluence of bullish indicators suggests that the medium-term outlook is leaning towards higher prices. The RSI at 67.36 is approaching overbought territory but has not yet reached extreme levels, leaving room for further upward movement before sellers might step in to take profits.
The Stochastic Oscillator on this timeframe, however, presents a slight divergence with K at 68.59 and D at 83.34, indicating a potential pullback or consolidation as %K crosses below %D. This is a common occurrence even within strong uptrends and doesn't necessarily negate the bullish picture painted by other indicators. The key resistance level to watch on this chart is $4,269.87. A decisive break and hold above this level would likely confirm the bullish trend and could pave the way for a move towards the next resistance at $4,298.49. The support levels at $4,217.95 and $4,194.65 remain important floors, acting as potential turning points should the bullish momentum falter. The overall signal on the 4-hour chart is overwhelmingly bullish, aligning with the recent increase in Brent crude oil prices and potentially a weakening US dollar in this timeframe.
Daily Chart: A Neutral Stance with Underlying Strength
The daily timeframe for XAUUSD presents a more neutral picture, yet one that still holds underlying bullish potential. The trend strength is at 50%, reflecting a market that is consolidating or waiting for a clearer directional catalyst. The ADX at 26.27, while indicating a strong trend, doesn't specify the direction on this longer timeframe, suggesting sideways movement is possible. The RSI at 60.88 is in the neutral zone, leaning towards bullish, and the MACD shows positive momentum with the MACD line above its signal line. This suggests that while the immediate direction might be unclear, the longer-term trend remains fundamentally supportive of prices.
Bollinger Bands on the daily chart are trading above the middle band, indicating upward pressure, and the Stochastic Oscillator (K=77.29, D=53.59) is showing a strong bullish signal, moving upwards. The immediate resistance at $4,321.22 is a significant psychological and technical barrier. A sustained move above this level would be a strong bullish confirmation for the daily chart. However, the significant support at $4,118.95 cannot be ignored; a break below this level would invalidate the bullish outlook and signal a more substantial downturn. The overall signals lean towards 'AL' (Buy), but the neutral trend strength on this timeframe suggests that patience is key. Investors might be waiting for a clearer signal from macroeconomic factors or a definitive break of key levels before committing to larger positions.
The Dollar's Shadow: DXY and its Impact on Gold
The Dollar Index (DXY), currently trading at 99.97, casts a long shadow over the gold market. Historically, a stronger dollar often correlates with weaker gold prices, as gold becomes more expensive for holders of other currencies. On the 1-hour chart, the DXY shows a bullish trend (ADX 26.73) and positive MACD momentum, suggesting upward pressure. This aligns with the short-term bearish signals observed in gold's MACD. However, the DXY's daily chart paints a different story, showing a neutral trend and negative momentum, which could provide some relief for gold bulls if the dollar begins to weaken on longer timeframes. This dynamic creates a tug-of-war effect, where the immediate dollar strength acts as a drag on gold, but the longer-term neutral stance allows for potential upside if other factors, like inflation fears, take precedence.
The current strength of the dollar is a significant factor to consider. With the DXY hovering just below the 100 mark, a psychological level of importance, any move above it could signal increased global demand for the dollar, potentially pressuring gold further. Conversely, if the DXY fails to break decisively above 100 and begins to retreat, especially with the daily chart showing negative momentum, it could provide a significant tailwind for XAUUSD. This inverse relationship is a cornerstone of gold trading strategy, and understanding the DXY's trajectory is as crucial as analyzing gold's own technicals. The market is watching closely to see if the current dollar strength is sustainable or a temporary consolidation before a potential downtrend, which would likely benefit gold.
Geopolitical Currents and Inflationary Whispers
The geopolitical landscape remains a key, albeit volatile, driver for gold prices. The ongoing crisis in the Strait of Hormuz, as reported by forex news outlets, has disrupted energy markets, with Brent crude oil prices surging to $82.13. This spike in oil prices often fuels inflation expectations, making gold an attractive safe-haven asset and inflation hedge. The news indicates that Iranian attacks on vessels continue, effectively closing the strait. This supply disruption in a critical energy chokepoint not only impacts oil prices but also contributes to broader market uncertainty, which typically benefits gold. The fact that WTI crude oil has also seen a significant rise, closing at $79.09, reinforces this inflationary narrative.
However, recent reports suggest that gains across equities, yields, gold, and FX have stalled as the promised Hormuz breakthrough failed to materialize, indicating a market pause for confirmation. This suggests that while the geopolitical tensions provide a baseline support for gold, traders are waiting for more concrete developments or clearer signals before making large bets. The market's reaction to the Hormuz situation highlights the complex interplay between risk-off sentiment and the need for tangible catalysts. If tensions escalate further, gold could see a significant boost. Conversely, any de-escalation, even without a full resolution, could lead to profit-taking and a temporary pullback in gold prices, especially if the DXY continues its ascent.
The current geopolitical situation and the sharp rise in oil prices create a volatile environment. Traders should exercise increased caution and implement strict risk management strategies. The conflicting signals from technical indicators and the uncertainty surrounding the DXY's next move necessitate a disciplined approach.
Trade Scenarios: Mapping the Path Forward for Gold
Bearish Scenario: Testing the Lower Supports
35% ProbabilityNeutral Scenario: Consolidation Around Current Levels
40% ProbabilityBullish Scenario: Pushing Towards Higher Resistance
25% ProbabilityFrequently Asked Questions: XAUUSD Analysis
What happens if XAUUSD breaks below $4,236.42 support?
A break below $4,236.42 on the 1-hour chart would trigger the bearish scenario, targeting $4,232.25 and potentially $4,228.86. This would indicate short-term selling pressure, likely influenced by a strengthening DXY or waning risk appetite.
Is the RSI at 67.36 on the 4H chart a sell signal for XAUUSD?
An RSI of 67.36 is approaching overbought territory but is not yet an extreme sell signal, especially within a strong uptrend indicated by the ADX at 33.96. It suggests some buying exhaustion may be near, but further confirmation like a MACD bearish crossover or a break of key support would be needed for a definitive sell signal.
How will the rising Brent crude oil price affect XAUUSD trading?
The surge in Brent crude to $82.13 fuels inflation expectations, which typically benefits gold as an inflation hedge. This could provide underlying support for XAUUSD, potentially overriding some of the headwinds from a stronger dollar, especially if this inflationary pressure persists.
Should I buy XAUUSD at current levels around $4,252.68 given the mixed signals?
Buying at current levels requires careful risk management due to mixed signals across timeframes. A more prudent approach might be to wait for a clear break above $4,251.54 with confirmation from other indicators, or a confirmed bounce from the $4,236.42 support, aligning with the bullish scenario probabilities.
The path forward for gold remains intricate, balancing bullish technical momentum on medium-term charts against short-term headwinds from dollar strength and conflicting indicator signals. Geopolitical tensions and inflation concerns provide a baseline support, but the immediate direction will likely hinge on key price levels. Traders must remain vigilant, respecting the $4,236.42 support and $4,251.54 resistance on the 1-hour chart, while keeping an eye on the crucial $4,269.87 level on the 4-hour chart. Patience and disciplined risk management will be the cornerstones for navigating this dynamic market landscape, as the price action consolidates and potentially prepares for its next significant move.
Track markets in real-time
AI-powered analysis, technical indicators and real-time price data.
Join Our Telegram Channel
Breaking market news, AI analysis and trading signals instantly.
Join Channel