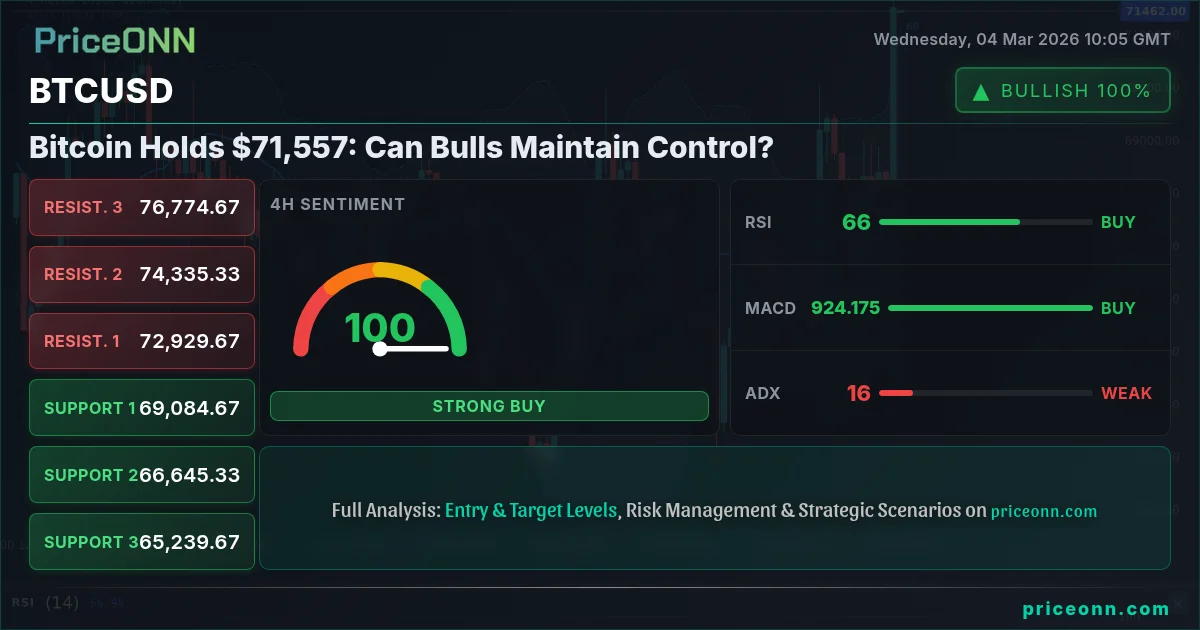
Bitcoin's surge continues, currently holding at $71,557. The question now is: can the bulls maintain control at these elevated levels, or are we poised for a correction? This article delves into a comprehensive technical analysis of BTCUSD, examining key indicators, support and resistance levels, and potential scenarios for traders.
- RSI at 75.87 on the 1H chart signals overbought conditions, suggesting potential for a short-term pullback.
- Critical support sits at $69,716.67, tested multiple times intraday. A break below this level could trigger a deeper correction.
- MACD histogram on the 1D chart shows positive momentum, supporting the overall bullish trend despite short-term overbought signals.
- Fed rate expectations and DXY strength are key factors influencing BTCUSD, with a potential inverse correlation if risk appetite declines.
The recent price action in BTCUSD has been nothing short of remarkable. The cryptocurrency has surged past previous highs, reaching levels that many analysts deemed improbable just weeks ago. However, with the current price hovering around $71,557, it's crucial to assess the underlying technicals and identify potential turning points. The focus of this analysis is to provide a clear understanding of the current market structure and offer insights into potential future movements.
Technical Analysis: A Multi-Timeframe Perspective
A comprehensive technical analysis of bitcoin involves examining multiple timeframes to gain a holistic view of the market. Let's start with the hourly (1H) chart. The RSI (14) is currently positioned at 75.87, indicating that BTCUSD is in overbought territory. This suggests that the bullish momentum may be waning, and a short-term pullback could be imminent. However, it's important to note that an overbought RSI does not automatically trigger a reversal; it simply indicates that price is extended and vulnerable to profit-taking.
On the other hand, the MACD on the 1H chart shows positive momentum, with the MACD line above the signal line. This suggests that the underlying trend remains bullish, despite the overbought RSI. The Stochastic oscillator, with K=94.1 and D=61.94, further confirms the overbought condition, suggesting that a period of consolidation or a minor correction may be healthy for the market to digest recent gains. However, the ADX, at 21.21, indicates a moderate uptrend, suggesting that the bullish momentum is not overwhelmingly strong.
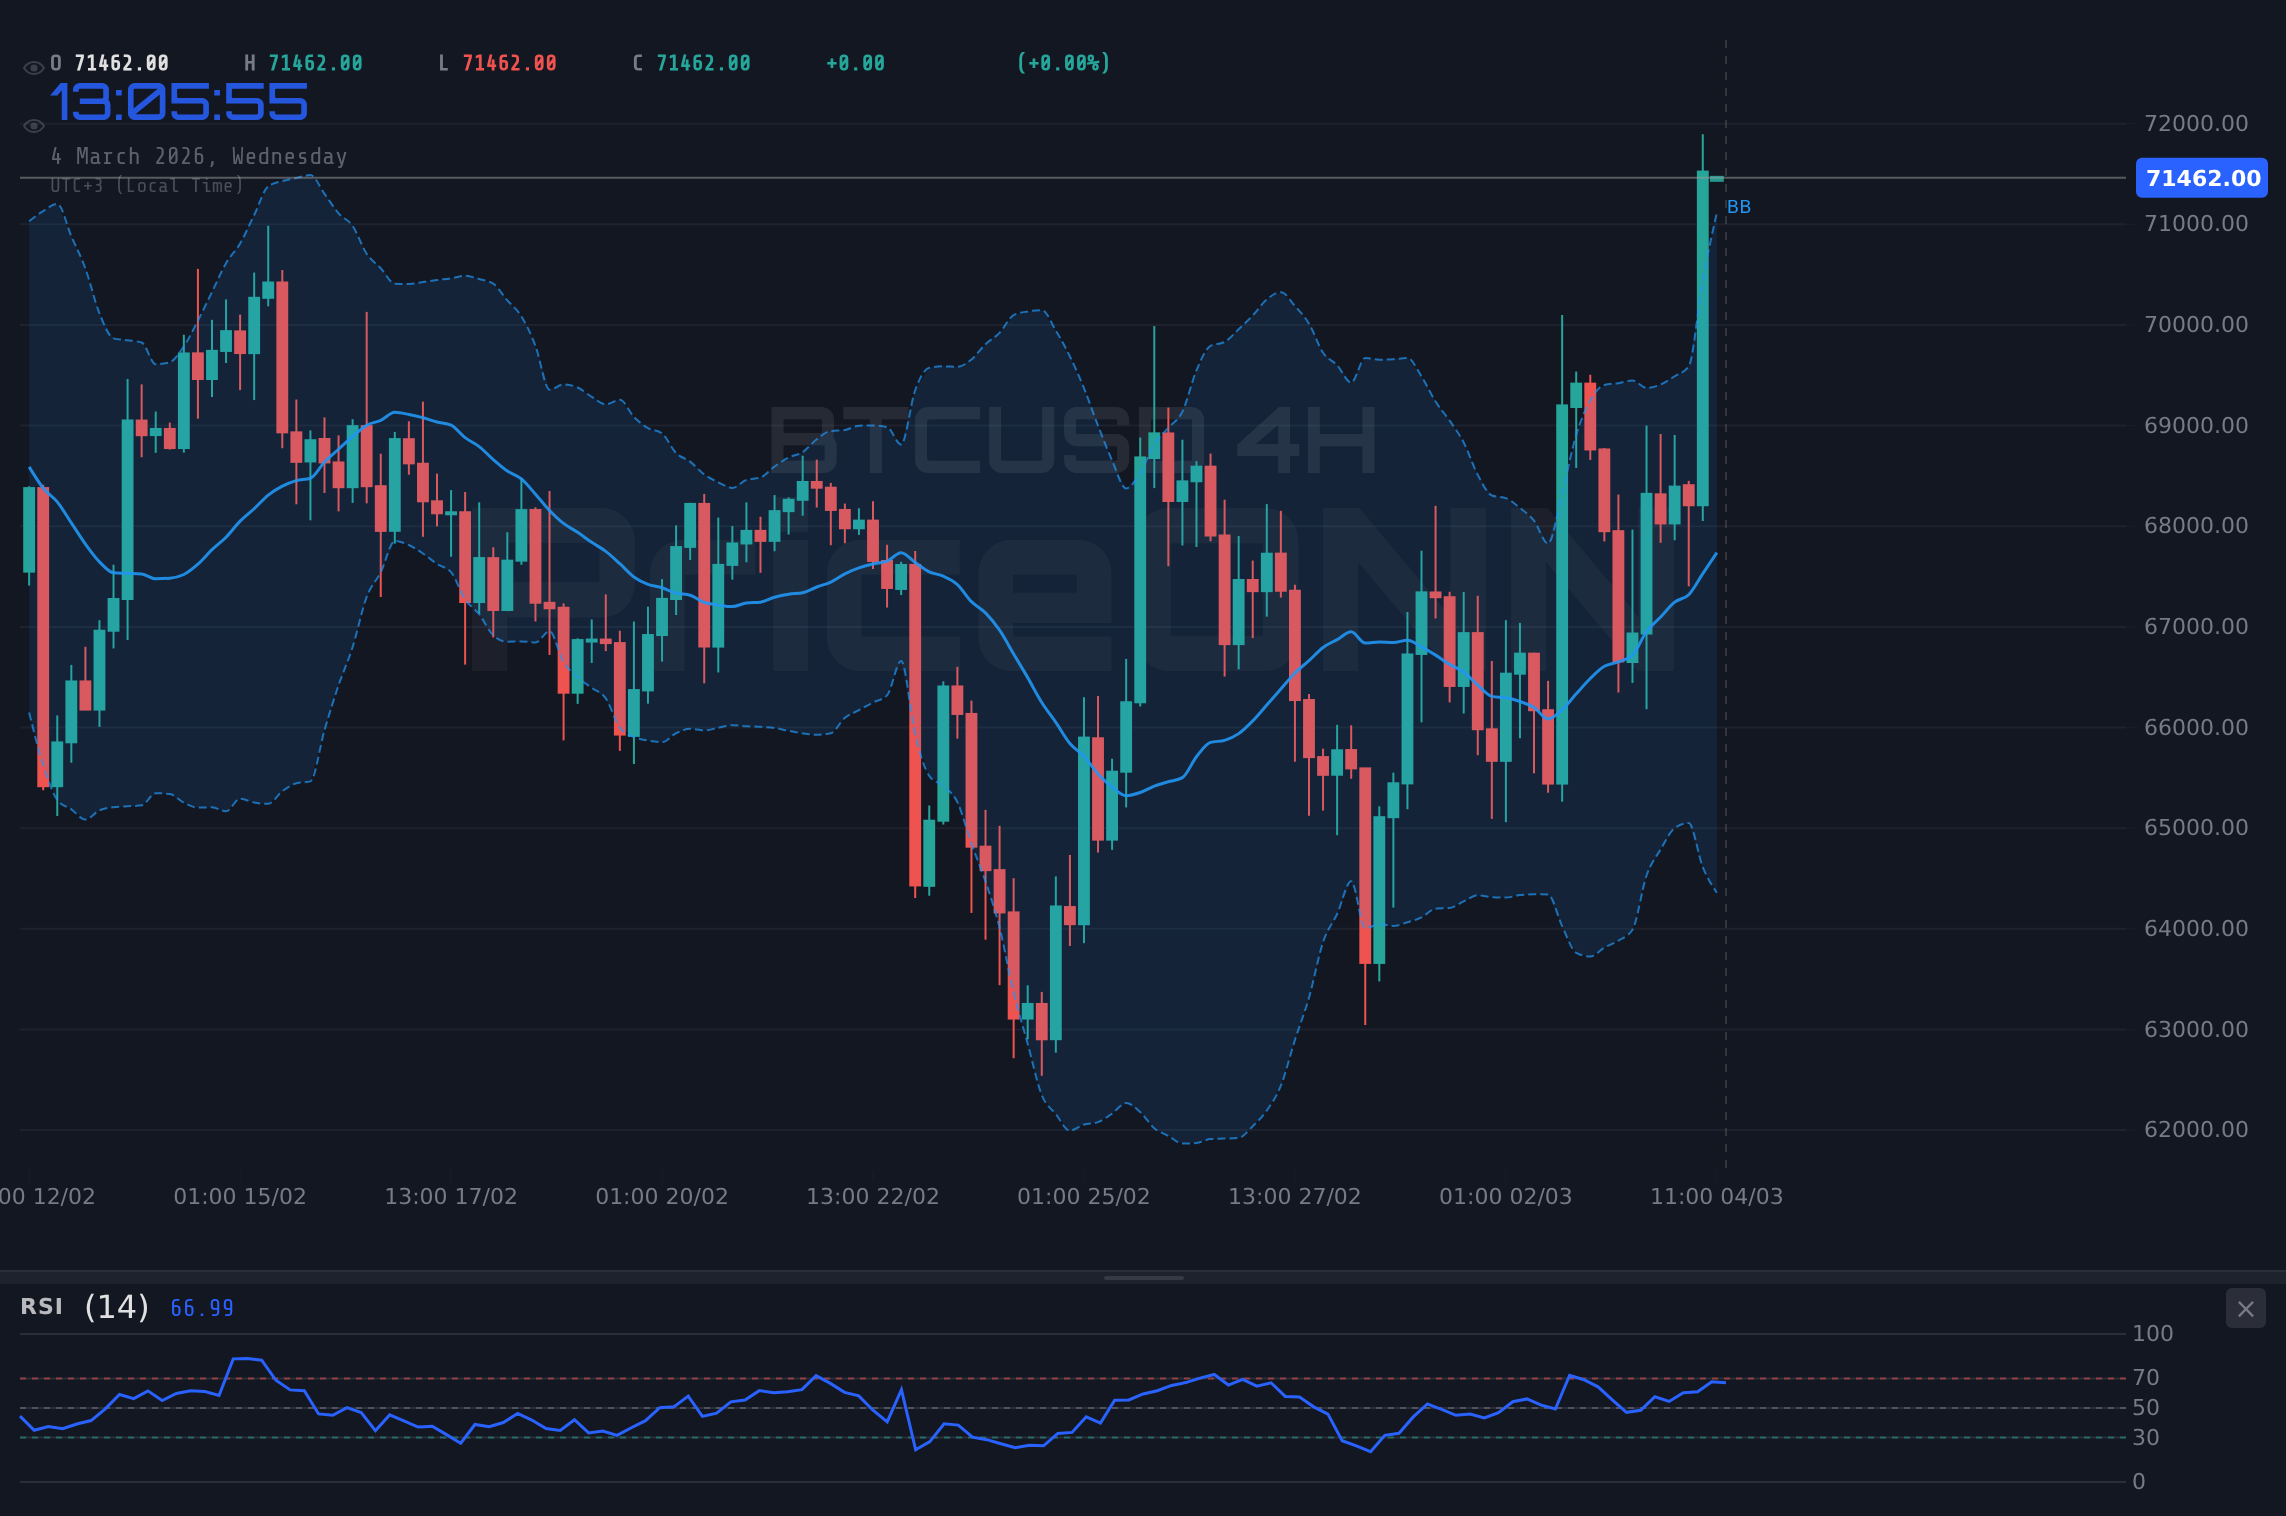
Moving to the 4-hour timeframe, the RSI (14) is at a more moderate 66.66, indicating that there is still room for further upside before reaching overbought conditions. The MACD continues to show positive momentum, supporting the bullish outlook. The Stochastic oscillator, with K=73.08 and D=55.28, also suggests further upside potential, although a pullback is possible. The ADX, at 14.83, indicates a weak trend, which suggests that BTCUSD may be range-bound or exhibiting choppy price action. This could make trade entry more challenging, as the lack of a strong trend can lead to false breakouts and increased volatility.
Finally, on the daily timeframe, the RSI (14) is at 53.09, indicating that BTCUSD is neither overbought nor oversold. The MACD shows positive momentum, supporting the overall bullish trend. The Stochastic oscillator, with K=86.65 and D=63.75, also suggests further upside potential. However, the ADX, at 42.14, indicates a strong downtrend, which is contradictory to the other indicators. This divergence between indicators suggests that the daily timeframe may be undergoing a period of consolidation or trend reversal.
Key Support and Resistance Levels: Navigating Potential Scenarios
Identifying key support and resistance levels is crucial for understanding potential price movements. On the 1H chart, immediate support can be found at 69716.67, followed by 68423.33 and 67699.67. These levels represent areas where buyers may step in to defend against further price declines. On the upside, immediate resistance is at 71733.67, followed by 72457.33 and 73750.67. A breakout above these levels could signal a continuation of the bullish trend. It's worth noting that the current support and resistance levels are quite close together, which suggests that the market may be consolidating in a tight range.
On the 4H chart, support levels are at 67591, 66973, and 66543. Resistance levels are at 68639, 69069, and 69687. These levels provide a broader perspective on potential price targets and areas of congestion. The 4H chart also reveals a potential ascending triangle pattern, which is typically a bullish continuation pattern. However, it's important to wait for a confirmed breakout above resistance before taking a long position.
On the daily chart, support levels are at 66305, 64582, and 62982. Resistance levels are at 69628, 71228, and 72951. These levels represent significant areas of historical price action and can act as strong magnets for future price movements. The daily chart also reveals a potential double top pattern, which is a bearish reversal pattern. However, it's important to wait for a confirmed breakdown below support before taking a short position.
News Impact and Market Sentiment
Recent news events and market sentiment can also have a significant impact on BTCUSD. As noted by Reuters, geopolitical tensions in the Middle East are fueling safe-haven demand, which could indirectly support bitcoin as an alternative store of value. However, concerns about Federal Reserve policy outweigh safe-haven demand according to another report. This divergence in sentiment creates uncertainty and can lead to increased volatility. Furthermore, the strength of the DXY (Dollar Index) can also influence BTCUSD. A stronger dollar typically puts pressure on bitcoin, while a weaker dollar can provide support. The DXY is currently trading at 98.69, showing a slight uptrend, which could exert some downward pressure on BTCUSD. The SP500 is currently at 6815.6, indicating a risk-on environment. A decline in the SP500 could lead to increased safe-haven demand and potentially support BTCUSD.
Navigating Divergent Signals: A Balanced Approach
The technical analysis reveals a mixed picture, with some indicators suggesting overbought conditions and potential for a pullback, while others support the overall bullish trend. The key is to adopt a balanced approach and consider multiple factors before making any trading decisions. It's also crucial to manage risk effectively and use stop-loss orders to protect against unexpected price movements. Given the current market conditions, patience may be rewarded. Waiting for confirmation signals, such as a breakout above resistance or a breakdown below support, can increase the probability of success.
Frequently Asked Questions: BTCUSD Analysis
Is BTCUSD a good buy right now?
BTCUSD is currently trading at $71,557 and is in overbought territory on the 1H chart. While the overall trend is bullish, waiting for a pullback to support around $69,716.67 may offer a better entry point.
What is the BTCUSD price forecast for this week?
The BTCUSD price forecast for this week is mixed. A breakout above resistance at $71,733.67 could lead to further upside towards $72,457.33, while a breakdown below support at $69,716.67 could trigger a correction towards $68,423.33.
What are the key support and resistance levels for BTCUSD?
Key support levels for BTCUSD are at $69,716.67, $68,423.33, and $67,699.67. Key resistance levels are at $71,733.67, $72,457.33, and $73,750.67. These levels are based on the 1H chart and should be monitored for potential breakouts or breakdowns.
Why is BTCUSD moving today?
BTCUSD is moving today due to a combination of factors, including positive momentum from the MACD, overbought conditions on the 1H chart, and uncertainty surrounding Federal Reserve policy and geopolitical tensions.
Volatility creates opportunity - those prepared will be rewarded.
Technical Outlook Summary
| Indicator | Value | Signal |
|---|---|---|
| RSI (14) | 53.09 | Neutral |
| MACD Histogram | Positive | Bullish |
| Stochastic | 86.65/63.75 | Bullish |
| ADX | 42.14 | Strong downtrend |
| Bollinger | Upper Band | Watch |
Track markets in real-time
AI-powered analysis, technical indicators and real-time price data.
Join Our Telegram Channel
Breaking market news, AI analysis and trading signals instantly.
Join Channel