

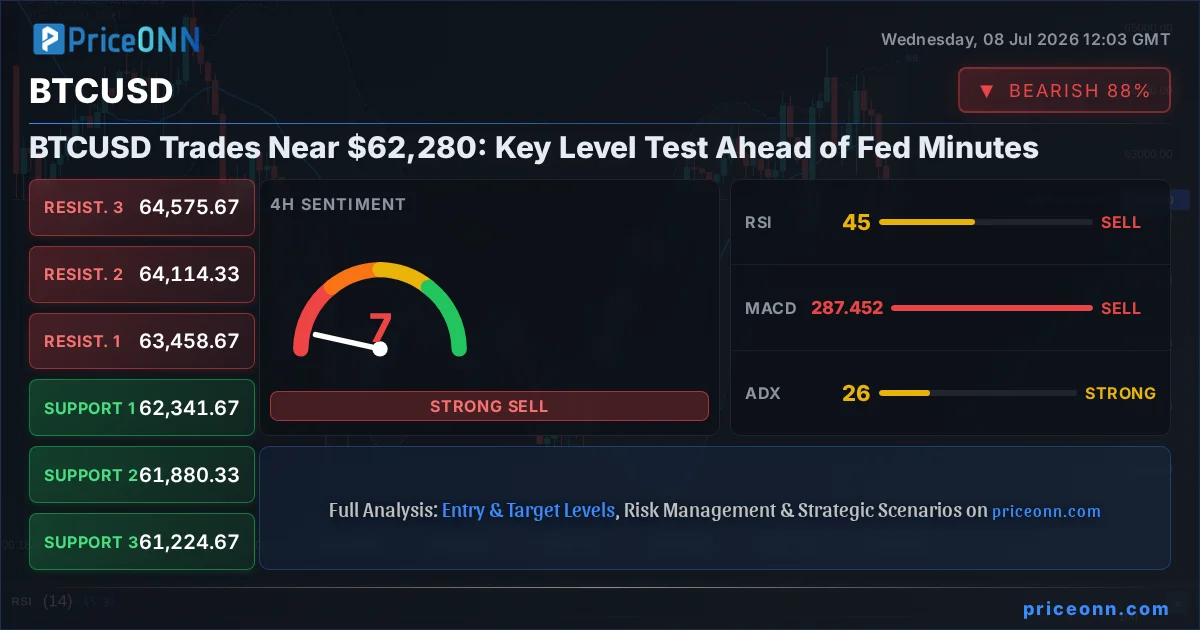
The market is holding its breath as BTCUSD finds itself teetering near a crucial support level around $62,280. This pivotal moment comes at a critical juncture, with the highly anticipated Federal Reserve minutes on the horizon. Traders are scrutinizing every tick, trying to decipher whether this consolidation marks a pause before a renewed ascent or a precursor to a deeper pullback. The interplay between technical indicators, macro-economic sentiment, and the ever-present risk appetite will dictate the next significant move.
- BTCUSD is currently trading at $62,280, hovering near key support levels.
- The 1-hour RSI at 38.13 suggests a bearish trend, while the 1-day RSI at 46.44 indicates neutral momentum with a slight downward lean.
- Critical support is identified at $61,993.67, with a break below potentially targeting $61,801.33.
- Resistance is observed around $62,290.67 and $62,395.33, with a decisive breach needed to shift sentiment.
- The upcoming Fed minutes are a major catalyst, potentially introducing significant volatility and directional clarity.
The Tightrope Walk at $62,280: BTCUSD's Current Predicament
Bitcoin (BTCUSD) is currently trading at $62,280, a price point that has become a focal point for market participants. After a recent pullback from higher levels, the digital asset is now testing a significant confluence of support. The daily change shows a decrease of -2.23%, translating to a $1,420 drop, highlighting the immediate selling pressure observed. The daily range has been between $61,746 and $63,865, indicating a degree of choppiness but with a clear downward bias in the short term. The prevailing trend across multiple timeframes is currently neutral to bearish, with the 1-hour chart showing a strong downward trend (82% strength) and the 4-hour and daily charts exhibiting a 50% neutral trend strength, suggesting indecision or a potential shift.
The technical indicators paint a mixed, yet predominantly cautious, picture. On the 1-hour timeframe, the RSI (14) sits at 38.13, firmly in neutral territory but leaning towards bearish sentiment, indicating room for further downside before reaching oversold conditions. The MACD is showing negative momentum, with the MACD line below its signal line, reinforcing the bearish short-term outlook. Bollinger Bands on this timeframe are also trading below the middle band, a classic sign of bearish pressure. Stochastic oscillators show a K value of 29.52 and a D value of 19.62, suggesting a potential upward cross but still within a predominantly bearish zone. The ADX at 28.38 indicates a strong downtrend on this shorter timeframe, a signal that bears are currently in a dominant position.
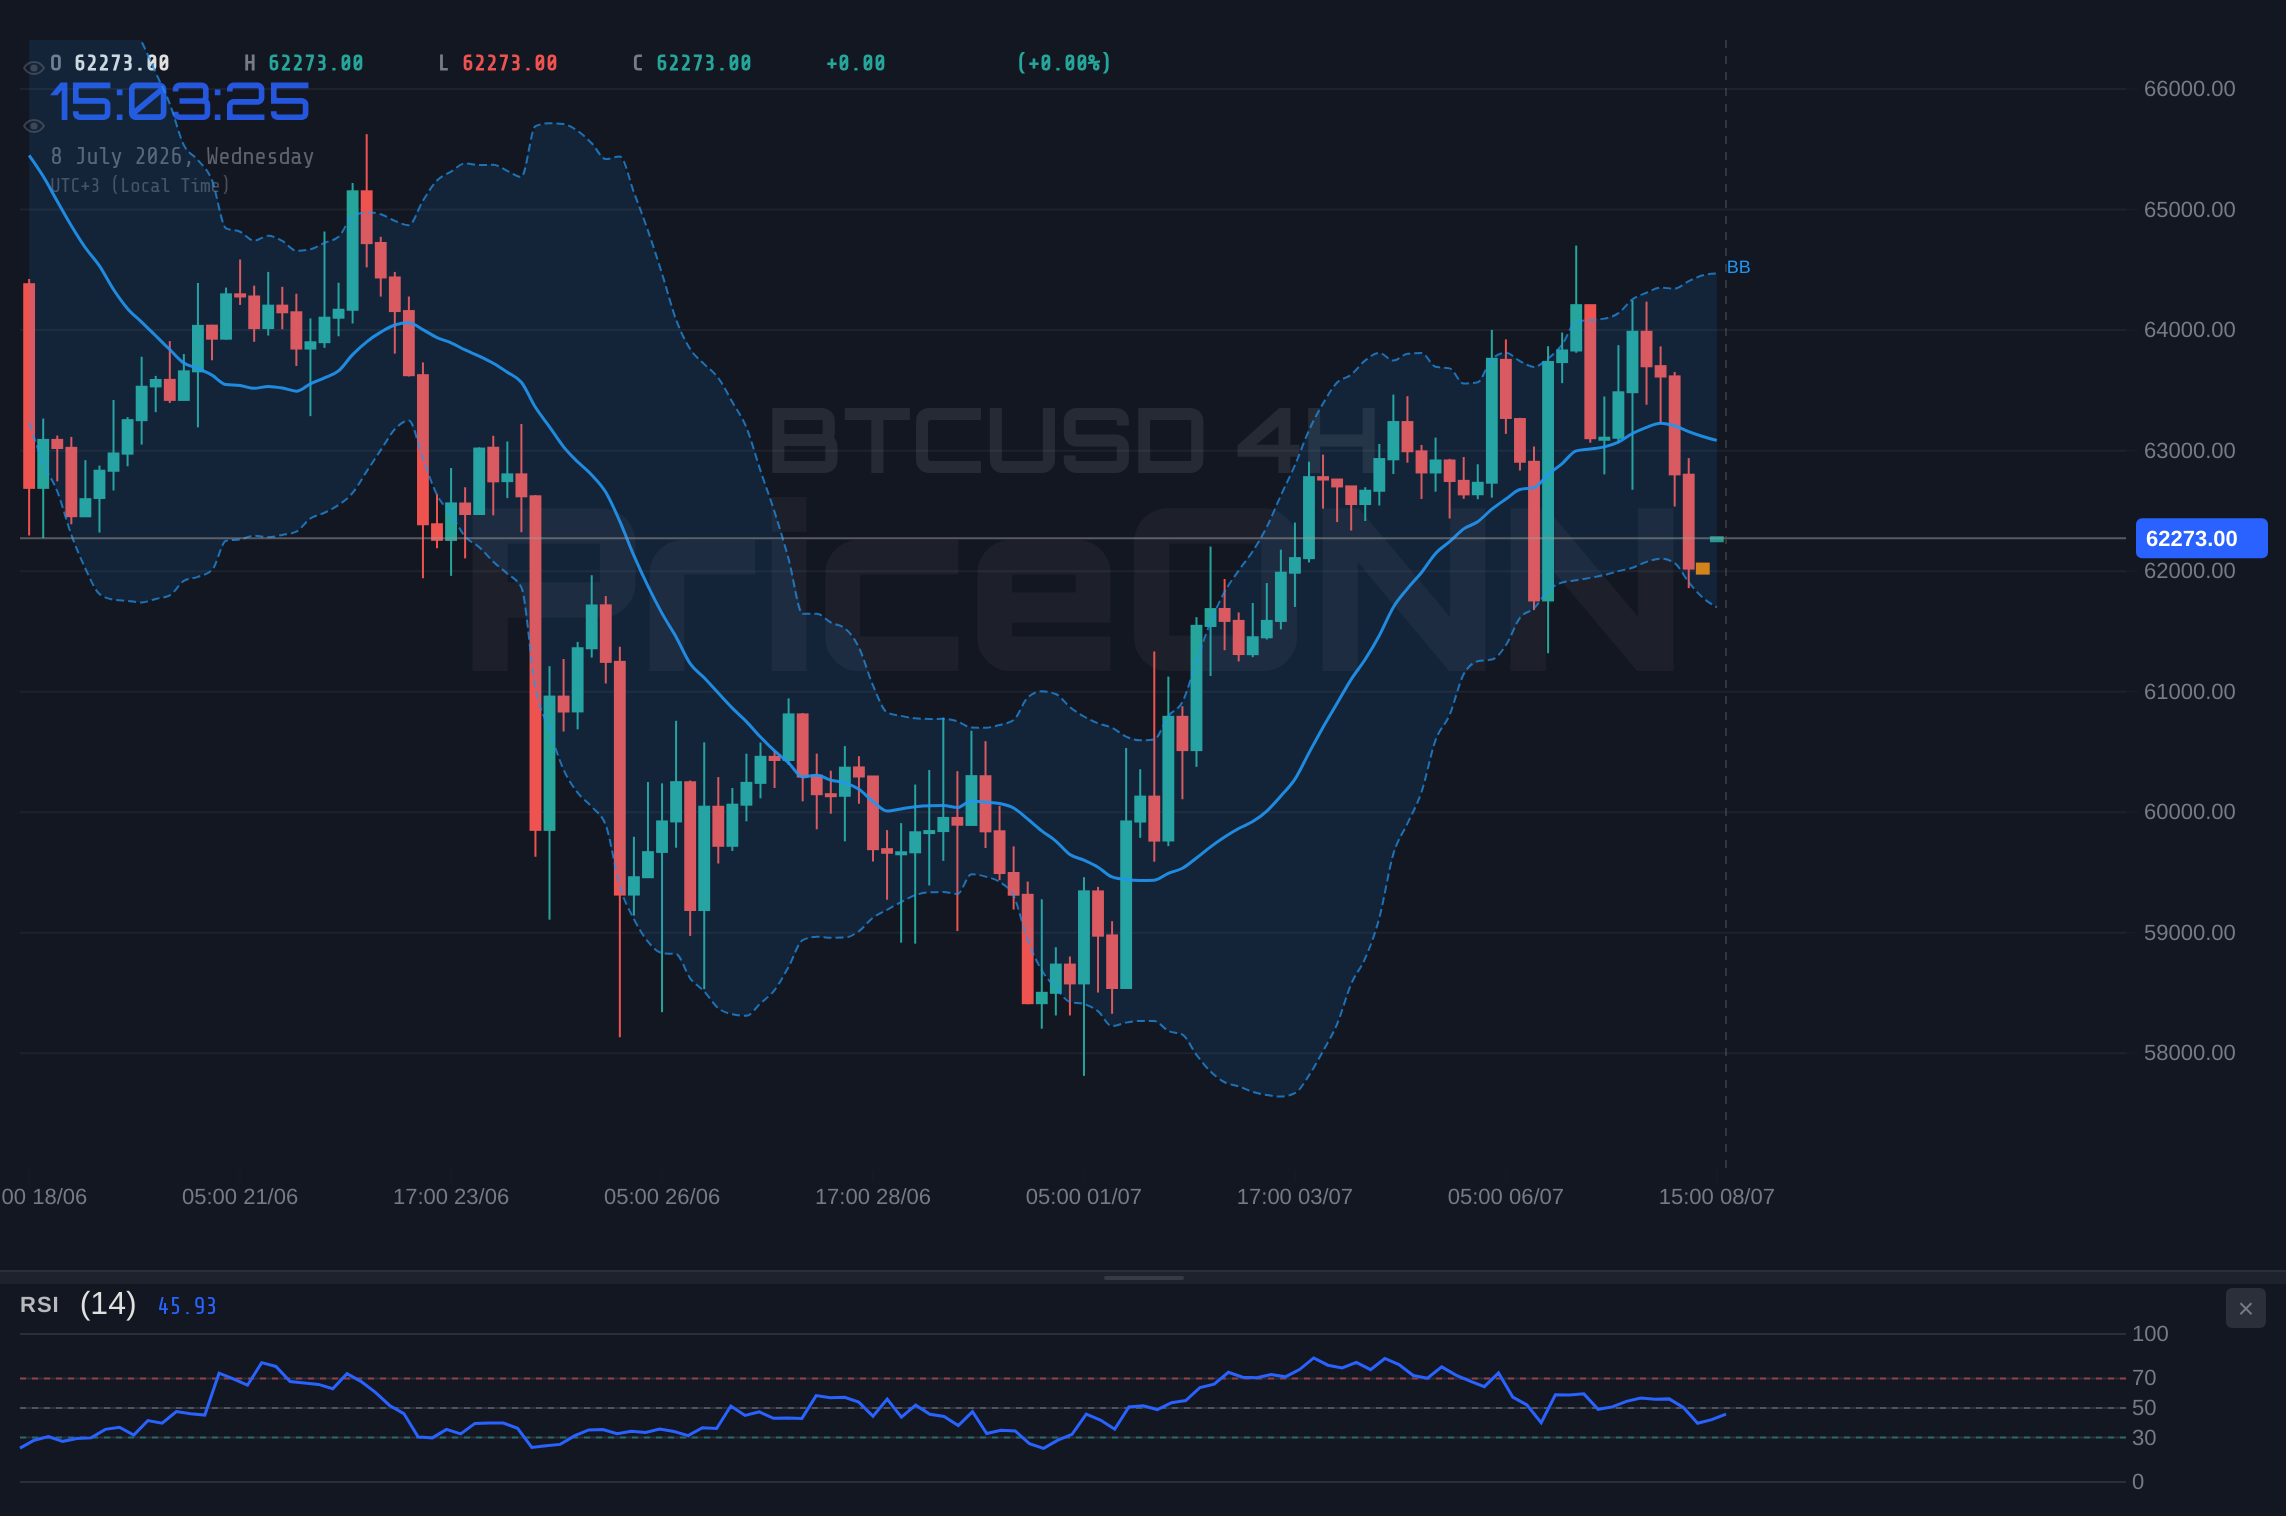
However, as we broaden our view to the daily chart, the picture becomes more nuanced. The RSI (14) is at 46.44, still in neutral territory but showing less bearish conviction than its 1-hour counterpart. The MACD, while showing negative momentum on the 1-hour, actually displays positive momentum on the daily chart, with the MACD line above its signal line. This divergence between short-term and daily indicators is crucial, suggesting that while immediate pressure exists, the underlying daily trend might be less committed to a sharp downturn. Bollinger Bands on the daily chart are trading above the middle band, hinting at a potential upward bias in the longer term, though current price action is below it. The Stochastic on the daily shows K=82.51 and D=85.74, indicating an overbought condition, which could be a precursor to a pullback or consolidation if buying pressure doesn't re-emerge strongly.
The ADX on the daily chart is 28.99, still indicating a strong downtrend, but this conflicts with the daily MACD's positive momentum and Bollinger Band position. This conflict is precisely why traders are watching the $62,280 level so intently. It represents a battleground where short-term bearish pressures meet potential longer-term support and a mixed daily technical setup. The overall signal for BTCUSD on the 1-hour and 4-hour charts leans towards 'SELL' (7 out of 8 indicators on 1H, 7 out of 8 on 4H), but the daily chart presents a more balanced, albeit still cautious, picture with a 'SELL' signal (6 out of 8 indicators). This divergence necessitates a scenario-based approach rather than a definitive directional bet.
The Bull's Roadmap: Navigating Towards Higher Ground
The Bullish Scenario: A Rebound from Support
25% ProbabilityFor the bulls to regain control, several conditions must be met. The immediate trigger would be a sustained move above the $62,395.33 resistance level. This isn't just about breaching the price; it needs to be accompanied by robust volume, signaling genuine buying interest stepping in. Furthermore, we'd want to see the technical indicators align with this bullish move. On the 4-hour chart, this means the RSI needs to climb decisively above the 50 level, breaking out of its current neutral-to-bearish lean. Simultaneously, the MACD histogram should turn positive, indicating that momentum is shifting firmly in favor of buyers. A break above the $62,395.33 level, especially if it can hold, would then open the door for a test of the $62,587.67 resistance. A more ambitious target within this bullish scenario would be the $63,458.67 level, which represents a significant psychological barrier and a potential retest of recent highs, signaling a stronger recovery.
The invalidation for this bullish thesis is clear: failure to hold the current support at $61,993.67. If BTCUSD breaks below this level and stays there, it would suggest that the selling pressure is too strong to overcome, and the path of least resistance would be downwards. This would nullify any immediate hopes of a rebound and likely lead to further downside exploration.
Where Bears Take Control: The Downside Risk
The Bearish Scenario: Breaking Down Support
65% ProbabilityThe bearish scenario appears to have a higher probability (65%) given the current technical setup, particularly the strong downtrend signals on the 1-hour chart and the overall 'SELL' signals across shorter timeframes. The primary trigger for this scenario is a clear break below the immediate support at $61,993.67. This break should ideally be confirmed by increasing selling volume and a continued decline in the RSI, pushing it below the 40 level, which would solidify the bearish momentum. If this trigger occurs, the immediate downside target would be the next support level at $61,801.33. A failure to find buyers there could quickly lead to a test of $61,696.67.
The invalidation of this bearish outlook would hinge on the market holding the $61,993.67 support level and then staging a significant rebound. If BTCUSD manages to bounce strongly from this area and reclaim the $62,395.33 resistance level, it would suggest that the support held firm and the bearish thesis is invalidated. In such a case, the market might then pivot back towards the bullish scenario, albeit with renewed caution.
The influence of broader market sentiment cannot be overstated here. The DXY (Dollar Index) is currently showing a rising trend (1H: 80% strength, 4H: 80% strength, 1D: 70% strength), trading at 101.22. A strong dollar typically puts pressure on risk assets like Bitcoin. If the DXY continues its ascent, especially ahead of or following the Fed minutes, it could exacerbate any downward pressure on BTCUSD. Conversely, a weakening dollar could provide some much-needed relief, even if technicals are bearish. The S&P 500 is showing a mixed picture: a strong 1-hour and 4-hour uptrend (100% and 50% strength respectively) but a bearish daily trend (100% strength) at 6572.87. This suggests that while equities are showing short-term resilience, the longer-term outlook is more cautious, which could spill over into the crypto market if risk aversion increases.
The Waiting Game: Consolidation and Uncertainty
The Neutral Scenario: Range-Bound Consolidation
10% ProbabilityWhile the current technical signals lean towards a bearish outcome, a neutral, range-bound scenario cannot be entirely dismissed, especially in the immediate hours leading up to the Fed minutes. This scenario (10% probability) would involve BTCUSD largely trading sideways between the immediate support at $61,993.67 and resistance at $62,395.33. Such a period would likely be characterized by low trading volumes and indecisive technical indicators, as market participants adopt a wait-and-see approach. The absence of a strong directional trigger from either the bulls or the bears would keep the price confined. This consolidation could be a prelude to a larger move, but the lack of conviction would make it a period of heightened tension rather than clear direction.
The invalidation for this neutral scenario is straightforward: any decisive move beyond either the support or resistance levels, especially with increased volume or significant news flow, would signal the end of the consolidation phase and the initiation of a new trend. Until then, traders might look for short-term opportunities within the range, but the primary focus remains on what catalyst will break this potential stalemate.
What I'm Watching: Key Triggers and the Fed's Shadow
The immediate future for BTCUSD hinges on two primary factors: technical support and the upcoming Fed minutes. My attention is firmly fixed on the $61,993.67 support level. A decisive break below this on increasing volume would strongly favor the bearish scenario, potentially initiating a cascade towards $61,801.33 and $61,696.67. Conversely, a strong rebound from this level, coupled with a confirmed break above $62,395.33, would signal a bullish reversal, targeting $62,587.67 and potentially higher.
The Fed minutes, due shortly, represent the wildcard. Their tone - whether hawkish, dovish, or neutral - will significantly influence risk asset sentiment. If the minutes suggest a higher-for-longer interest rate environment, it could pressure BTCUSD downwards, reinforcing the bearish technicals. If they hint at a pause or future easing, it could provide the catalyst for a bullish breakout, even if short-term technicals are currently weak. The market's reaction to the minutes, rather than the minutes themselves, will be the true signal. Traders should be prepared for increased volatility around this event.
Furthermore, the correlation with the DXY and equity markets will be crucial. A continued rise in the dollar and a dip in the S&P 500 would add weight to the bearish case for BTCUSD. Any signs of stabilization or recovery in equities, coupled with a weaker dollar, could support a bullish move. The ADX values across timeframes (1H: 28.38, 4H: 26.1, 1D: 28.99) suggest a strong underlying downtrend is present, making any bullish reversal require significant conviction and clear confirmation.
| Indicator | Value | Signal (1H) | Signal (4H) | Signal (1D) | Interpretation |
|---|---|---|---|---|---|
| RSI (14) | 38.13 | Bearish | Bearish | Neutral | Momentum is waning; caution advised. |
| MACD Histogram | -1.42 | Bearish | Bearish | Bullish | Short-term momentum negative; daily shows positive shift. |
| Stochastic %K | 29.52 | Bullish | Bearish | Bullish | Mixed signals across timeframes; daily overbought. |
| ADX | 28.99 | Strong Trend | Strong Trend | Strong Trend | Confirms significant trend strength, currently bearish bias on shorter timeframes. |
Bullish Scenario: The Rebound Path
25% ProbabilityBearish Scenario: Downside Acceleration
65% ProbabilityNeutral Scenario: The Waiting Game
10% ProbabilityFrequently Asked Questions: BTCUSD Analysis
What happens if BTCUSD breaks below the $61,993.67 support level?
A break below $61,993.67 would invalidate the immediate bullish thesis and likely trigger further downside. The next targets would be $61,801.33 and potentially $61,696.67, indicating a higher probability for the bearish scenario.
Should I buy BTCUSD at current levels around $62,280 given the mixed signals?
Caution is advised. While the daily chart shows some positive momentum, the short-term technicals lean bearish. A confirmed break above $62,395.33 with strong volume would be a more convincing buy signal, targeting $62,587.67. Otherwise, waiting for a clearer directional cue is prudent.
Is the RSI at 46.44 on the daily chart a sell signal for BTCUSD?
An RSI of 46.44 is in neutral territory, not a direct sell signal. It indicates a slight downward bias but suggests there's room before oversold conditions are met. The 1-hour RSI at 38.13 is more bearish, reinforcing the short-term caution.
How will the upcoming Fed minutes affect BTCUSD this week?
The Fed minutes are a significant event risk. Hawkish commentary could pressure BTCUSD lower, aligning with current bearish technicals, while dovish signals might fuel a bullish breakout. Expect increased volatility around the release as the market digests the implications for interest rates.
Track markets in real-time
AI-powered analysis, technical indicators and real-time price data.
Join Our Telegram Channel
Breaking market news, AI analysis and trading signals instantly.
Join Channel