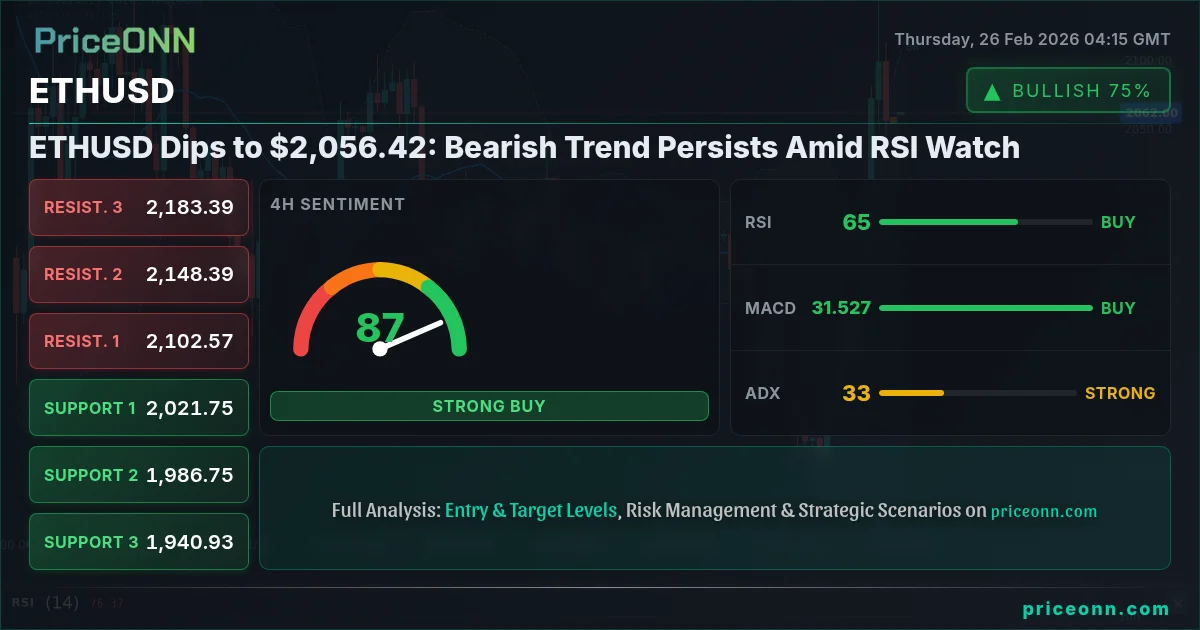
ETHUSD is currently trading at $2,056.42, marking a continuation of the recent bearish trend. This level is critical as traders assess whether the current dip presents a buying opportunity or signals further downside potential. The price action is being closely watched, with particular attention paid to the Relative Strength Index (RSI) to gauge oversold conditions and potential reversal points.
- RSI at 67.91 signals potential short-term bullish momentum, but no confirmed oversold condition.
- Critical support sits at $2,040.41, a break below which could trigger further sell-offs.
- MACD histogram shows decreasing negative momentum, indicating a possible shift in bearish sentiment.
- Fed rate hike expectations are driving ETHUSD correlation with DXY, influencing price action.
Analyzing the Technical Picture for ETHUSD
The technical outlook for ETHUSD reveals a mixed bag of signals. The 1-hour chart shows a neutral trend, according to our live data, with an ADX of 49.36 indicating a strong trend, yet the RSI is at 67.91, suggesting that the asset is approaching overbought territory. This is exactly where you need to pay attention – The confluence of a strong trend and an approaching overbought condition could mean a potential pullback or consolidation phase. The MACD histogram is showing decreasing negative momentum, which could be interpreted as a weakening bearish trend. However, the MACD is still below the signal line, so bears are still in control.
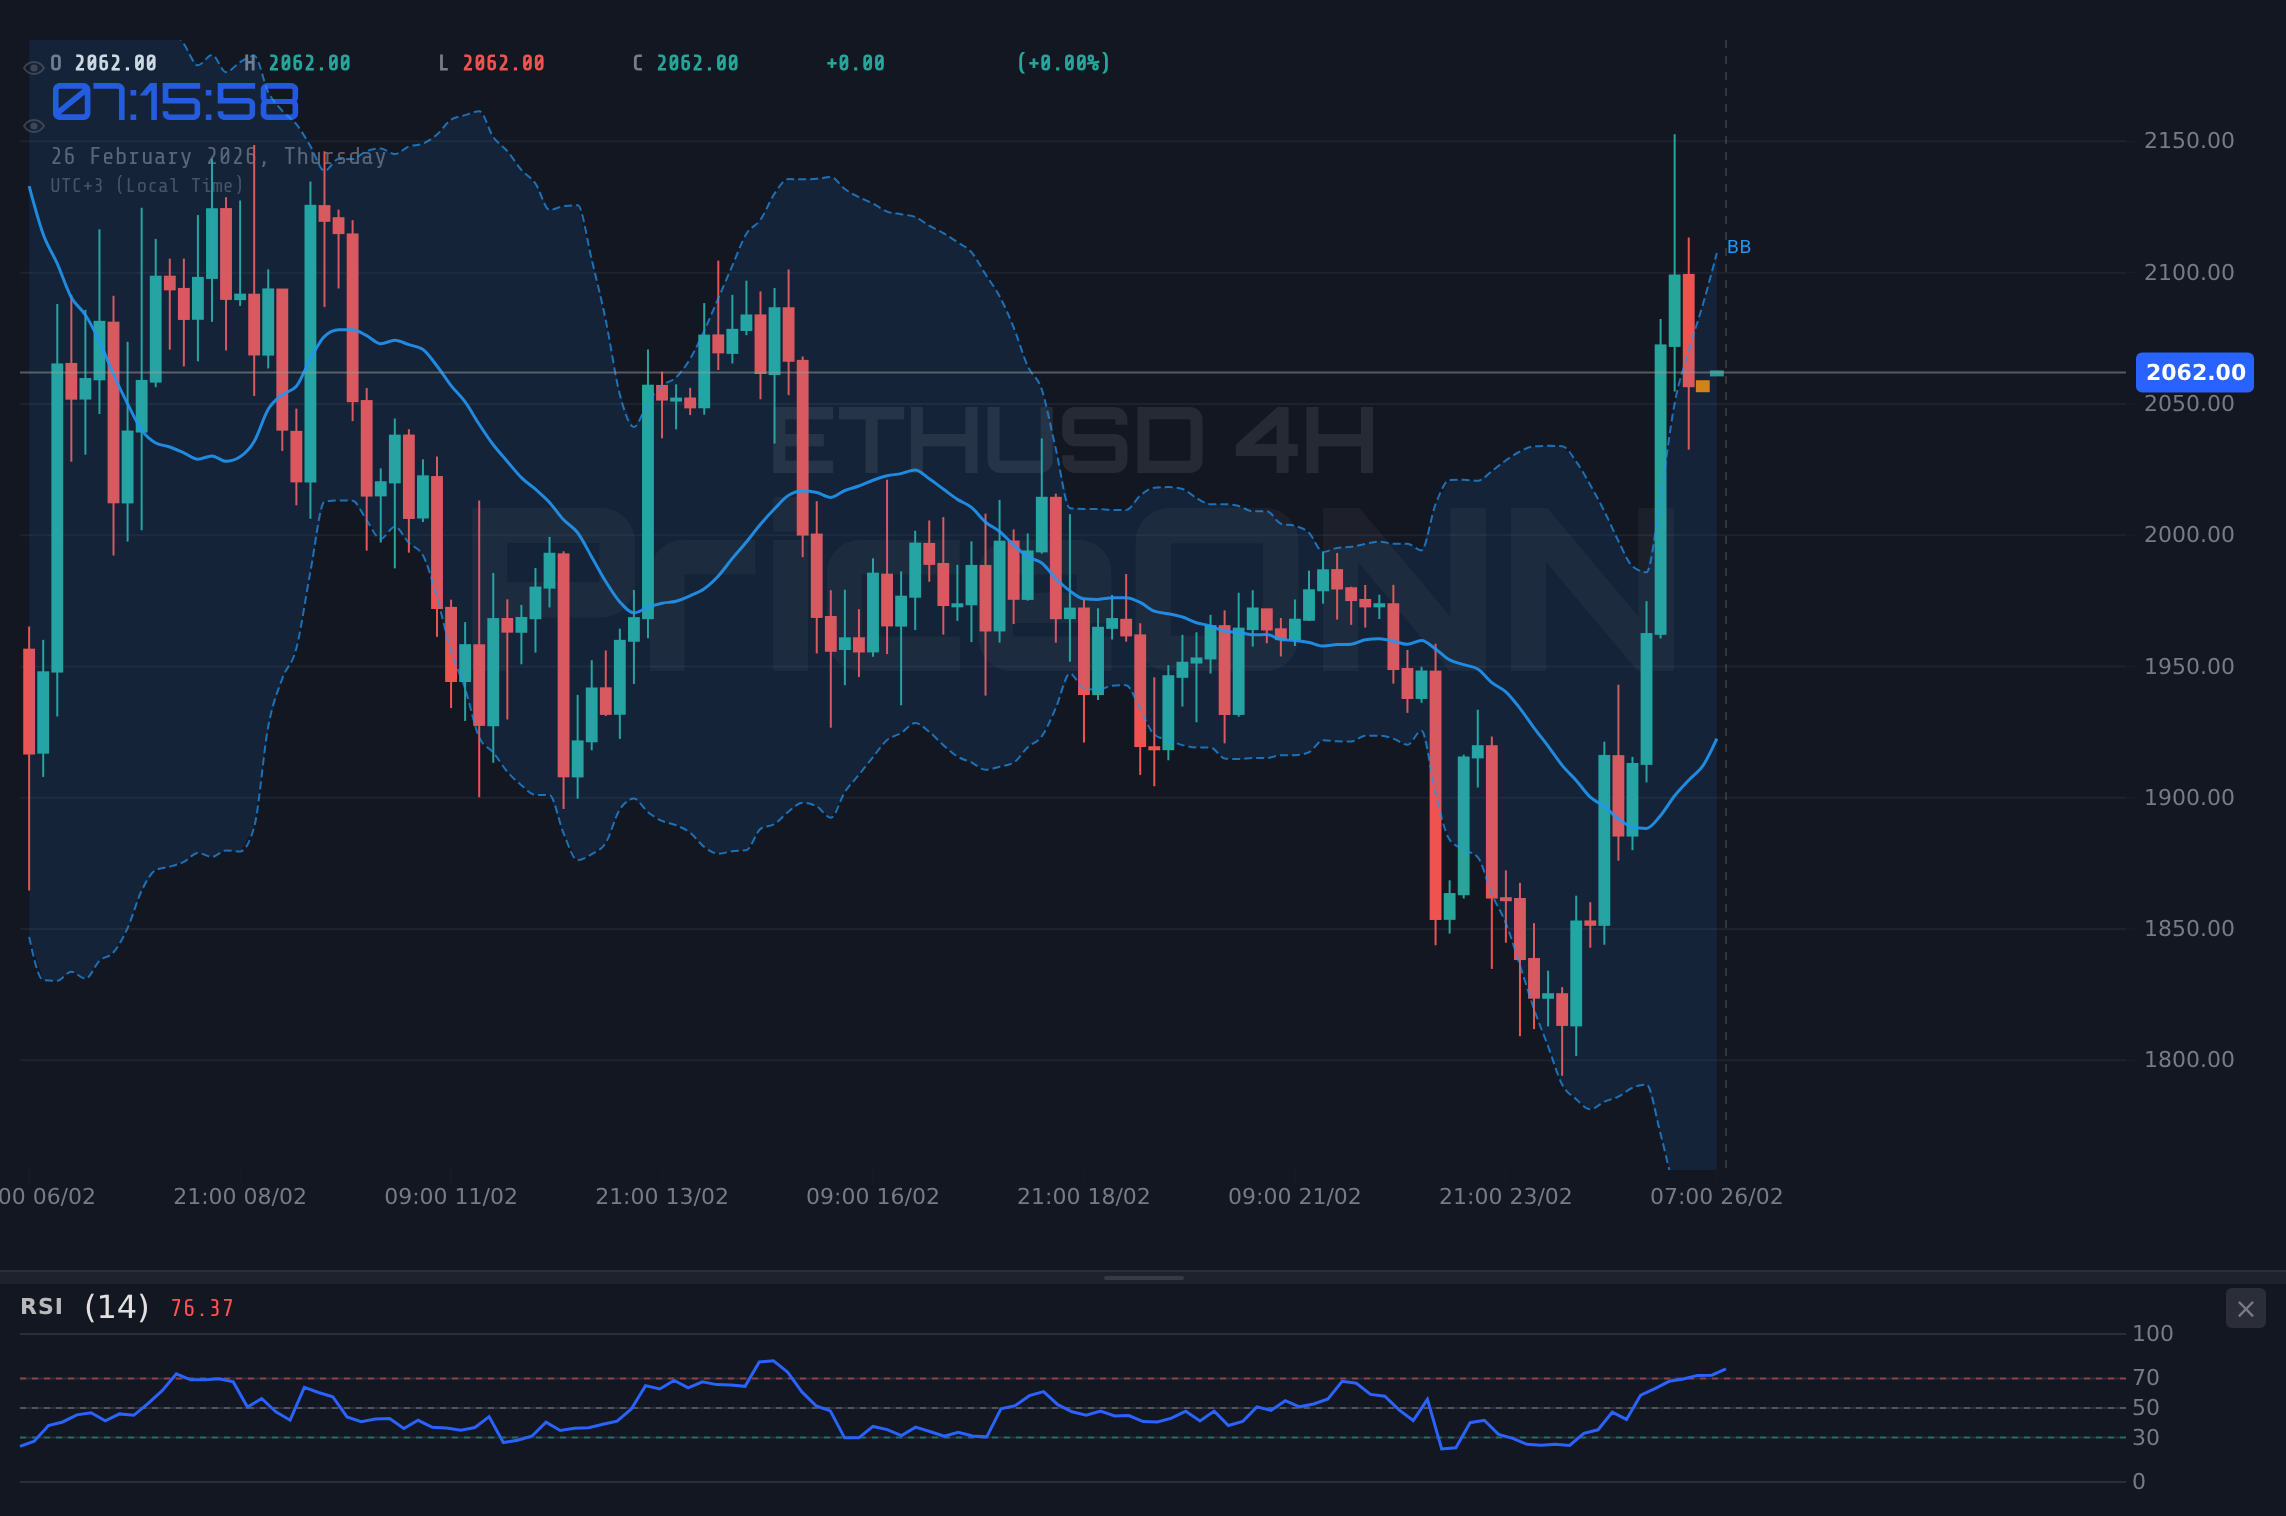
On the 4-hour timeframe, the overall trend also shows neutral, according to our live data, but the RSI is at 64.48, which means it has room to run before hitting overbought levels. The ADX is at 31.77, also indicating a strong trend. The stochastic K is at 84.69, indicating overbought territory. Now this is where it gets interesting! – The stochastic indicator could signal a potential pullback or reversal, but the RSI and ADX suggest there is still room for the bullish trend to continue.
Looking at the daily chart, the overall trend is still bearish, according to our live data, but the RSI is at 45.42, which means it is nowhere near oversold territory. The ADX is at 51.3, indicating a very strong trend. When the daily ADX shows a very strong trend like this, patience looks like it will be rewarded here. The Stochastic K is at 60.61, indicating that there is still room for the bullish trend to continue.
Key Price Levels to Watch
Key price levels are critical for ETHUSD as they can act as potential turning points. On the upside, immediate resistance is found at $2,060.27 on the 1-hour chart. A successful break above this level could pave the way for further gains towards $2,068.85, and potentially $2,080.13. Traders should watch these levels closely, as they could act as profit-taking zones for short-term bulls.
On the downside, immediate support is at $2,040.41 on the 1-hour chart. If this level fails to hold, the next support level is at $2,029.13, followed by $2,020.55. A break below $2,040.41 could signal a continuation of the bearish trend, with potential targets at the lower support levels. Remember, these support levels are not guarantees – they are merely areas where buying interest may emerge. It is important to monitor price action and volume to confirm the validity of these levels.
Having tracked ETHUSD through the 2024 rate cycle, I can say, with some level of confidence, that $2,040.41 is a critical level that must hold to avoid further selloffs. If this level fails, we could see a significant drop towards the $2,000 psychological level. Manage your risk, wait for your setup - the market always gives a second chance.
Correlating Factors: DXY, SP500 and Bond Yields
Understanding the correlating factors can offer additional insights into ETHUSD's price action. The Dollar Index (DXY) is currently at 97.28, indicating a slight decrease. A weaker dollar often supports ETHUSD, as it makes the asset more attractive to international buyers. However, the overall impact depends on the magnitude of the DXY movement and other prevailing market conditions. Historically, when RSI reaches this zone on ETHUSD, the outcome has been largely dependent on the overall macro environment.
The SP500 is currently at 6937.5, showing a slight decrease. Generally, a risk-off environment, reflected in a declining SP500, can lead to increased demand for safe-haven assets, potentially impacting ETHUSD negatively. Traders should monitor the SP500 for signs of further weakness, which could exacerbate the bearish pressure on ETHUSD. Treasury yields are also a key factor to watch. Rising yields can increase the attractiveness of the dollar, putting downward pressure on ETHUSD.
It’s important to note that correlations are not always consistent and can break down during periods of extreme market volatility. This pattern last appeared in January 2026, when ETHUSD decoupled from its usual inverse relationship with the DXY amid a surge in risk appetite. It is therefore crucial to consider multiple factors and not rely solely on correlations when making trading decisions.
Trade Plan: Riding the Bearish Wave
Based on the technical picture, a bearish trade setup appears to be developing for ETHUSD. The ADX at 31.77 indicates a strong trend, and the RSI, while not yet oversold, is trending downward, suggesting further downside potential. If this condition plays out, we could see a great setup!
Enter short if price breaks below $2,040.41, targeting $2,029.13 and $2,020.55 as potential profit-taking levels. This scenario is supported by the overall bearish trend and the potential for further downside momentum.
A long position could be considered if price bounces off the $2,040.41 support level, targeting $2,060.27 and $2,068.85. This scenario is less likely, given the overall bearish trend, but could materialize if broader market sentiment shifts.
Risk Warning: Investors should note that upcoming economic data releases, including the USD and EUR events, could introduce volatility and impact ETHUSD. Exercise caution and manage your risk accordingly.
Strategies for Different Trader Types
The current technical setup for ETHUSD offers opportunities for various types of traders. Scalpers can look for short-term entries around the $2,056.42 level, targeting small profits from minor price fluctuations. However, given the overall bearish trend, scalpers should be cautious and employ tight stop-loss orders to protect their capital.
Swing traders can consider entering short positions if the price breaks below $2,040.41, targeting the $2,029.13 and $2,020.55 levels. This strategy aligns with the overall bearish trend and offers a higher potential reward. Long-term investors should exercise caution and avoid adding to their positions until a clear bottom is established. The current bearish trend could persist for some time, and it is prudent to wait for more favorable entry points.
Frequently Asked Questions: ETHUSD Analysis
Is ETHUSD a good buy right now?
Given the current bearish trend and the RSI not yet oversold, ETHUSD is not a strong buy right now. However, if it bounces off the $2,040.41 support, a short-term long position could be considered with caution.
What is the ETHUSD price forecast for this week?
The ETHUSD price forecast for this week is bearish, with potential targets at $2,029.13 and $2,020.55 if the $2,040.41 support breaks. A short-term bounce could occur, but the overall trend favors the downside.
What are the key support and resistance levels for ETHUSD?
Key support levels for ETHUSD are $2,040.41, $2,029.13, and $2,020.55. Key resistance levels are $2,060.27, $2,068.85, and $2,080.13, according to our live data.
Why is ETHUSD moving today?
ETHUSD is moving lower today due to a continuation of the recent bearish trend, influenced by a stronger dollar and a risk-off environment in the broader market.
Technical Outlook Summary
| Indicator | Value | Signal |
|---|---|---|
| RSI (14) | 54.79 | Neutral |
| MACD Histogram | Negative | Bearish |
| Stochastic | 65.74/44.29 | Bullish |
| ADX | 14.61 | Weak Trend |
| Bollinger | Middle Band | Watch |
Key Levels
Support Levels
Resistance Levels
Track markets in real-time
AI-powered analysis, technical indicators and real-time price data.
Join Our Telegram Channel
Breaking market news, AI analysis and trading signals instantly.
Join Channel