WTI Bull Run: Eyes $92.19 Amid Iran Tensions?
WTI crude oil is eyeing the $90 mark as geopolitical tensions escalate, currently trading at $92.19. Will tensions in Iran fuel further gains?
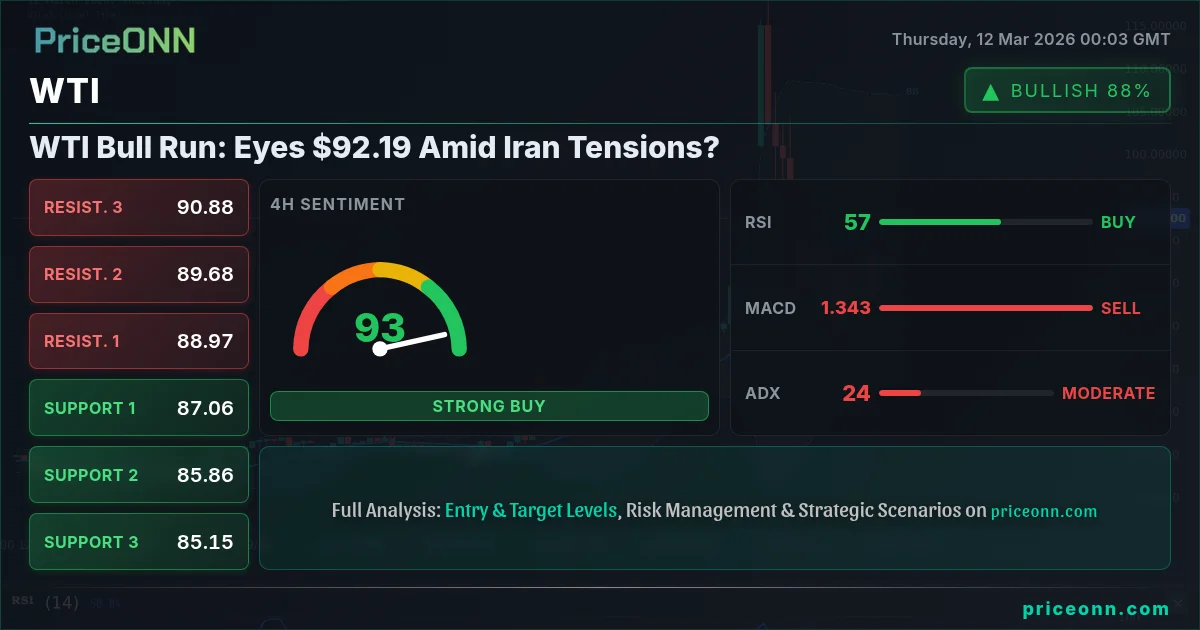
The energy market is on high alert as WTI crude oil flirts with the $90 threshold, currently priced at $92.19. Escalating geopolitical tensions involving Iran are casting a shadow over Eurozone stability, fueling concerns about potential supply disruptions and price spikes. The tug-of-war between bullish and bearish forces is palpable, with traders closely monitoring developments that could sway the market's direction.
- WTI crude oil is currently trading at $92.19, fueled by geopolitical tensions in the Middle East.
- Strong resistance is observed at $92.75 on the 1-hour chart, potentially limiting immediate upside.
- ADX at 45.39 on the daily timeframe indicates a strong upward trend, suggesting further gains are possible.
- Traders should monitor upcoming economic data, particularly inflation figures, which could influence the Fed's policy decisions and impact oil prices.
The Bullish Case: Geopolitical Risks and Supply Concerns
The primary driver behind WTI's recent rally is the escalating geopolitical risk in the Middle East, particularly involving Iran. News reports indicate heightened tensions that could potentially disrupt oil supplies from the region. According to a recent Reuters report, "Concerns mount that energy price shocks will destabilize the Eurozone economy, already reeling from high inflation.". The market is pricing in a premium for the potential disruption of supply chains. The spike in Brent crude to $93.83 further underscores the market's sensitivity to these tensions. While the IEA has released record reserves, the market seems to be defying this, suggesting a deep-seated concern for future supply.
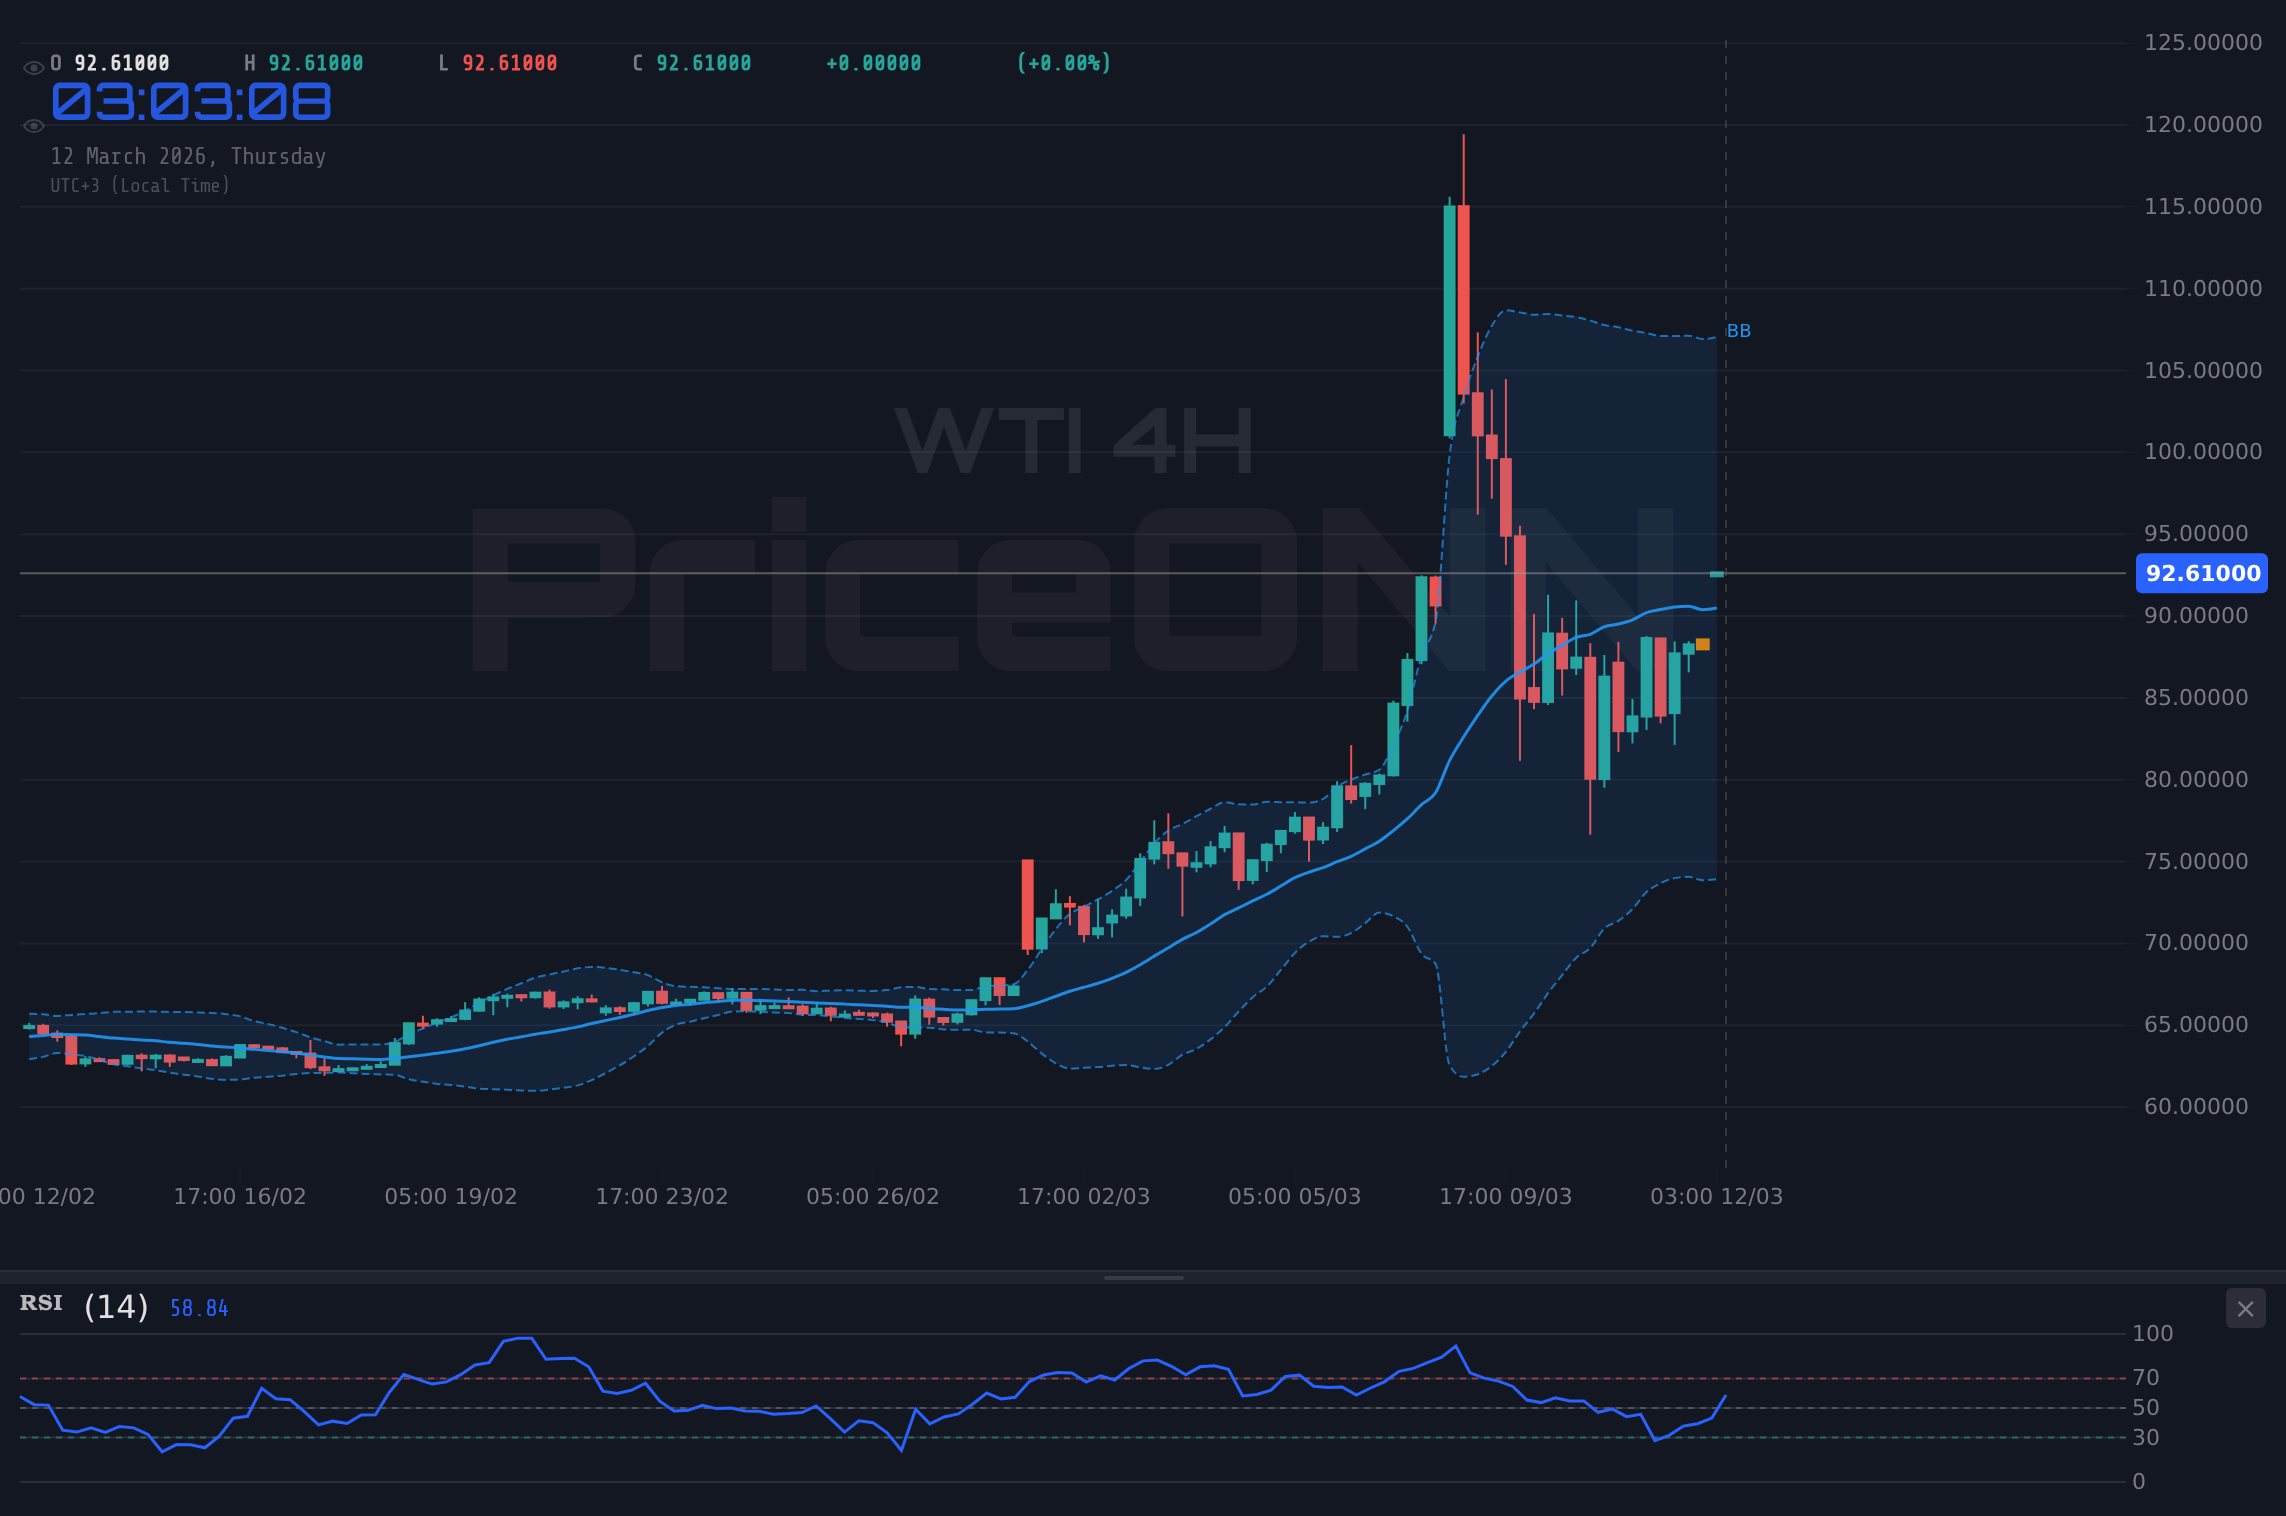
From a technical perspective, the daily chart paints a bullish picture. The ADX indicator sits at 45.39, signaling a strong upward trend. Furthermore, the RSI, although in overbought territory at 79.07, suggests that the bullish momentum is still intact. The WTI price is trading above its medium Bollinger band, indicating bullish momentum. The Stochastic oscillator, although showing a sell signal, needs to be viewed in conjunction with the strong ADX reading, suggesting that the uptrend may persist despite short-term pullbacks. The positive MACD histogram further bolsters the bullish outlook, indicating strong momentum.
The Bearish Case: Economic Headwinds and Overbought Conditions
Despite the bullish factors, several headwinds could stall WTI's ascent. The strength of the dollar, as reflected by the DXY's rise to 99.2, typically exerts downward pressure on commodity prices. A stronger dollar makes oil more expensive for holders of other currencies, potentially dampening demand. Furthermore, there are concerns about a potential slowdown in global economic growth, which could reduce demand for oil. The recent decline in the SP500 and Nasdaq100, currently trading at 6725.2 and 24769.26 respectively, reflects concerns about economic growth.
Technically, the overbought RSI on the daily chart at 79.07 suggests that WTI may be due for a correction. The Stochastic oscillator is also showing a sell signal, indicating that the upward momentum may be waning. The 1-hour chart shows an RSI of 62.86, suggesting some cooling off, but the Stochastic in overbought territory at 86.69 indicates a potential pullback. The MACD on the 1-hour chart is positive, but momentum is waning. The 4H chart shows an RSI of 55.96, which is neutral, but the Stochastic at 75.7 suggests overbought conditions.
Technical Analysis: A Battle at Key Levels
The technical picture for WTI presents a mixed bag. On the daily timeframe, the overall trend is bullish, supported by a strong ADX reading. However, the overbought RSI and bearish Stochastic suggest that a pullback may be imminent. Key support levels to watch are $88.66 (1H support), $83.75 (4H support), and $78.19 (1D support). A break below these levels could signal a deeper correction. On the upside, immediate resistance lies at $92.75 (1H resistance), followed by $94.44 (4H resistance) and $97.48 (1D resistance). A sustained break above these levels could pave the way for further gains.
The 1-hour chart shows that WTI is struggling to break above the $92.75 resistance level. The RSI at 62.86 is neutral, but the Stochastic is in overbought territory, suggesting that a pullback is likely. The MACD is positive, but momentum is waning. The 4-hour chart shows a similar picture, with the RSI at 55.96 and the Stochastic at 75.7. The daily chart, however, is more bullish, with a strong ADX and a positive MACD. This suggests that the overall trend is still upward, but a short-term correction is possible.
Trade Plan: Balancing Risk and Reward
Given the mixed technical signals and the geopolitical risks, a cautious approach is warranted. Traders should consider waiting for a pullback to support before initiating long positions. Alternatively, a breakout above the $92.75 resistance level could provide a buying opportunity, but risk management is crucial.
WTI breaks above $92.75 resistance and sustains momentum, targeting $94.44 and $97.48 resistance levels. Continued geopolitical tensions and positive economic data could fuel this scenario.
WTI fails to break above $92.75 and pulls back to $88.66 support, potentially extending to $83.75 if selling pressure intensifies. A stronger dollar and easing geopolitical tensions could trigger this scenario.
Frequently Asked Questions: WTI Analysis
What happens if WTI breaks above $92.75 resistance?
If WTI decisively breaks above the $92.75 resistance level, it could signal a continuation of the upward trend. The next targets would be the $94.44 and $97.48 resistance levels, driven by sustained bullish momentum and geopolitical concerns.
Should I buy WTI at current $92.19 levels given the RSI at 79.07?
While the RSI at 79.07 indicates overbought conditions, suggesting a potential pullback, the strong ADX reading supports the overall bullish trend. A cautious approach would be to wait for a pullback to support around $88.66 before initiating a long position, managing risk effectively.
Is the Stochastic oscillator's sell signal a reliable indicator for WTI?
The Stochastic oscillator's sell signal should be viewed in conjunction with other indicators. While it suggests a potential short-term pullback, the strong ADX on the daily chart indicates that the overall uptrend remains intact. Confirmation from other indicators is needed before acting solely on the Stochastic signal.
How will upcoming USD data affect WTI this week?
Upcoming USD data, particularly inflation figures and employment data, could significantly impact WTI. Strong USD data could strengthen the dollar, exerting downward pressure on oil prices. Conversely, weak USD data could weaken the dollar, providing support for WTI.
Looking Ahead: Navigating Uncertainty
The outlook for WTI remains uncertain, with bullish and bearish factors vying for dominance. Geopolitical tensions and supply concerns are providing strong support, while a strong dollar and economic headwinds are exerting downward pressure. Traders should closely monitor these factors and adjust their positions accordingly. The key will be to watch for confirmation signals and manage risk effectively.
Technical Outlook Summary
| Indicator | Value | Signal |
|---|---|---|
| RSI (14) | 79.07 | Overbought |
| MACD Histogram | Positive | Bullish |
| Stochastic | 42.87 | Sell |
| ADX | 45.39 | Strong Trend |
| Bollinger | Upper Band | Watch |
Key Levels
Support Levels
Resistance Levels
Track markets in real-time
AI-powered analysis, technical indicators and real-time price data.
Join Our Telegram Channel
Breaking market news, AI analysis and trading signals instantly.
Join Channel