WTI Eyes $79.53: Hormuz Threat Fuels Bull Run, But Can It Last?
WTI crude oil surges to $79.53 amid geopolitical tensions in the Strait of Hormuz. Is this a sustainable breakout or a short-term spike?
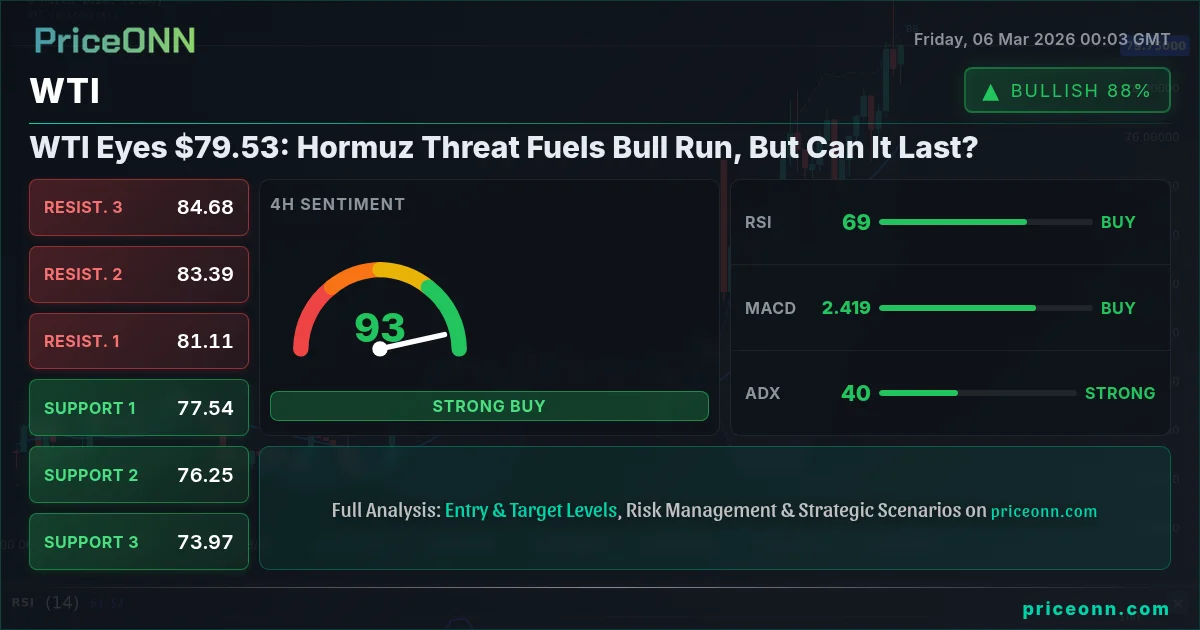
WTI crude oil is caught in a tug-of-war, with bulls emboldened by escalating tensions in the Strait of Hormuz and bears pointing to potential overbought conditions. The price currently hovers around $79.53, a level that could dictate the short-term trajectory of the energy market. The question now is: can WTI sustain this momentum, or is it poised for a correction?
- WTI surges to $79.53 amid escalating geopolitical risks in the Middle East.
- RSI at 59.59 signals increasing buying pressure, but not yet in overbought territory.
- Key resistance lies at $79.63, a breakout above which could trigger further gains.
- DXY at 98.77 suggests dollar strength is not currently impeding oil's ascent.
The bull case for WTI is primarily anchored in the rising geopolitical risks in the Middle East. Recent news highlights Japan's refiners requesting strategic oil releases, indicating a perceived threat to global energy supply. According to recent reports, crude oil markets are experiencing heightened volatility as disruptions in the Strait of Hormuz threaten global energy supplies. This critical chokepoint for oil tankers has become a focal point, with any disruption potentially leading to a significant supply squeeze. The market is pricing in this risk, driving WTI upwards. From a technical perspective, the 1-hour chart shows a bullish trend, with the price trading above the middle Bollinger Band. However, the ADX at 21.02 indicates only a moderate trend strength, suggesting that the bulls need to gather more momentum to solidify their position. For scalpers, a break above $79.63 could provide a quick long opportunity, while swing traders might wait for a confirmed close above this level before entering.
Adding fuel to the bullish fire, the WTI daily chart shows the ADX at 33.87, confirming a strong bullish trend. The RSI at 82.41, however, flashes a warning sign, with WTI entering overbought territory. This suggests that the rally might be overextended in the short term, and a period of consolidation or a pullback could be in the cards. Long-term investors need to weigh these factors: the geopolitical risk premium versus the potential for a technical correction. Historically, WTI has been sensitive to Middle East tensions, with prices spiking during periods of heightened uncertainty. However, these rallies have often been followed by corrections as supply concerns ease or economic realities set in. Therefore, it's not just the headlines, but the underlying fundamental drivers of supply and demand that need to be assessed.
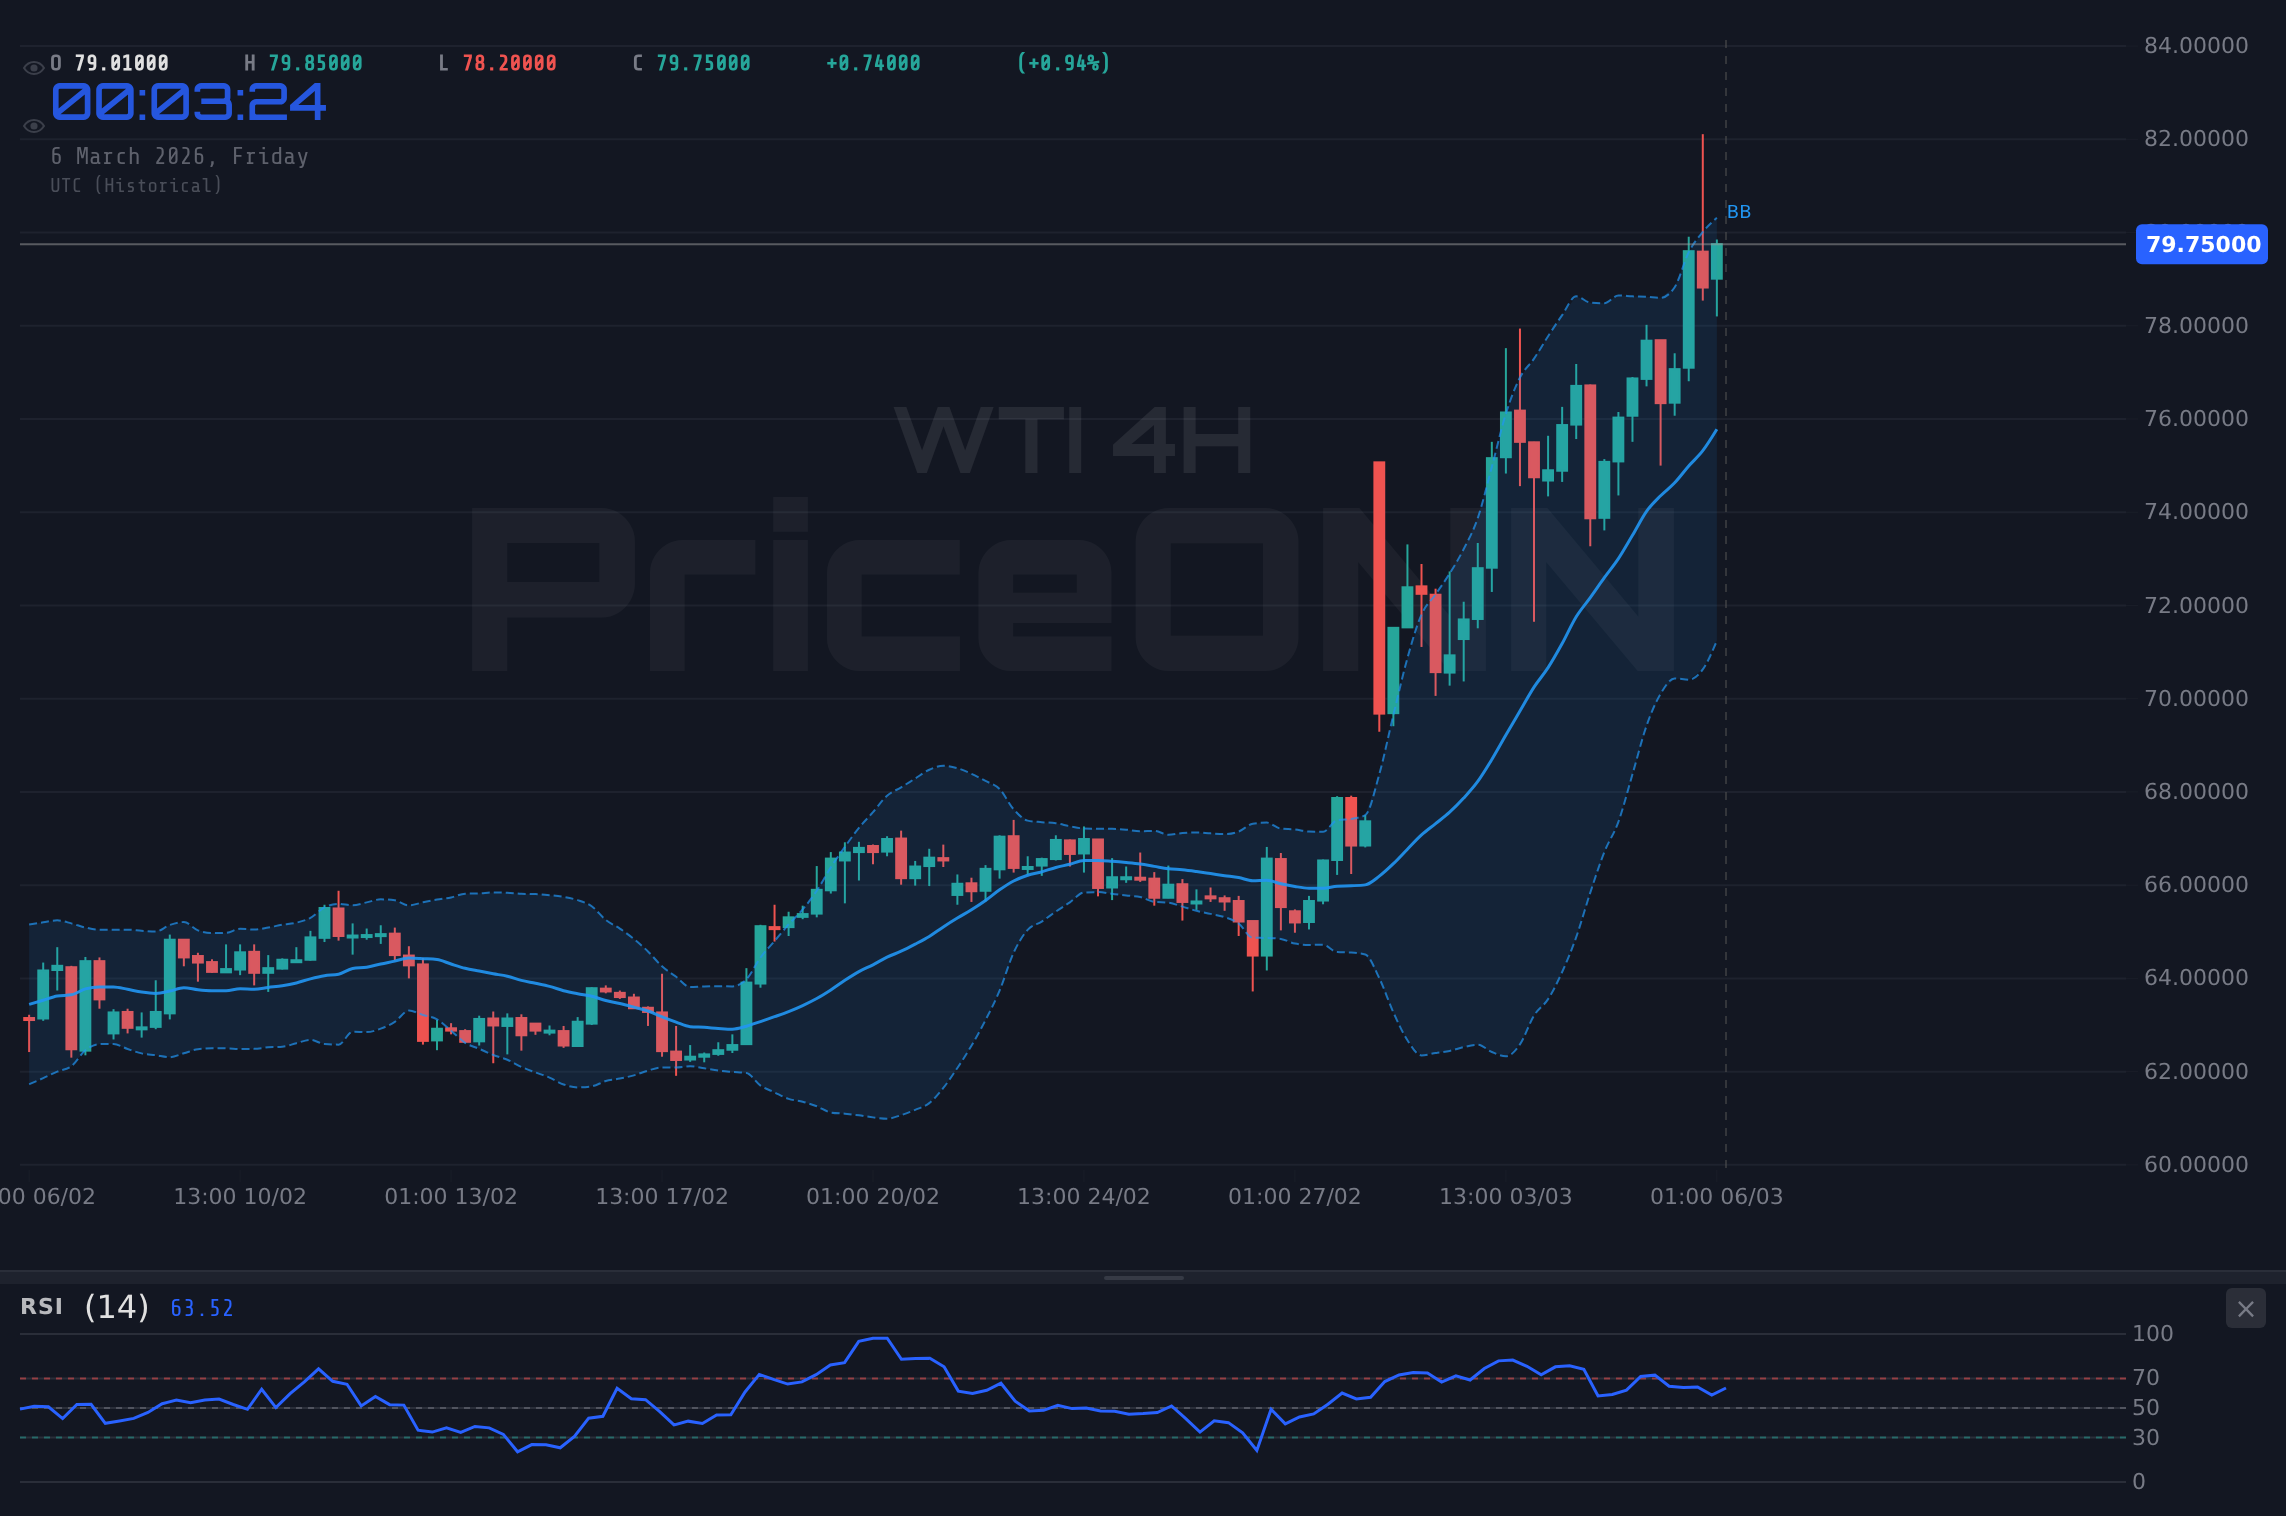
The bear case, on the other hand, rests on the potential for oversupply and a cooling global economy. While geopolitical risks are undeniable, increased production from other regions could offset any disruptions in the Middle East. Furthermore, a slowdown in global economic growth could dampen demand for oil, putting downward pressure on prices. Technically, the 1-day Stochastic indicator shows a bearish signal with K=50.08 and D=79.17, indicating that the recent upward momentum might be waning. The Dow Jones is down -1.53% and SP500 is down -0.54%, which could indicate a risk-off environment, in which case investors might consider selling their long positions. The near term support is at 78.27, and a break below this level could signal the start of a bearish move. On the 4-hour chart, the MACD indicator shows positive momentum, but it is starting to flatten, which could be an early sign of a trend reversal.
Looking at the broader market context, the DXY (Dollar Index) is currently at 98.77, showing a slight upward trend. A stronger dollar typically puts downward pressure on commodities like oil, as it makes them more expensive for international buyers. However, in this instance, the geopolitical risk premium seems to be overriding the dollar's influence. It is worth noting that the rising oil prices due to geopolitical tensions contribute to the USD strength. The EURUSD is reacting to ECB minutes amid the Middle East tensions, and the forex market is reacting to a mix of geopolitical developments, including the US Senate's decision regarding military action. The CAD/JPY news is closely related to oil prices, and we can see a spike in the price of WTI.
The technical picture presents a mixed bag. On the 1-hour chart, the RSI is at 59.59, indicating that there is still room for the price to move higher before reaching overbought territory. However, the Stochastic indicator shows a bearish signal, suggesting that the upward momentum might be losing steam. The 4-hour chart paints a more bullish picture, with the RSI at 69.97 and the MACD showing positive momentum. The daily chart, however, is more neutral, with the RSI at 82.41 and the Stochastic indicator showing a bearish signal. This divergence in signals across different timeframes highlights the uncertainty in the market and the need for caution.
For scalpers, the key level to watch is $79.63. A break above this level could provide a quick long opportunity, with a target of $80.45. However, it is important to be mindful of the overbought conditions and to set a tight stop-loss. Swing traders might wait for a confirmed close above $79.63 before entering a long position, with a target of $80.74. The stop-loss should be placed below the $78.27 support level. Long-term investors should focus on the fundamental drivers of supply and demand and be prepared to weather short-term volatility. The key support level to watch is $73.81, and a break below this level could signal a more significant correction.
Having tracked WTI through various geopolitical crises and economic cycles, it's clear that these events often create short-term trading opportunities but rarely alter the long-term trajectory of the market. Oil prices are ultimately determined by the balance of supply and demand, and while geopolitical risks can create temporary disruptions, they are unlikely to derail the underlying trend. Historically, when the RSI reaches similar levels on WTI, the outcome has been a period of consolidation or a pullback, followed by a resumption of the underlying trend. Therefore, it's crucial to avoid getting caught up in the hype and to focus on the long-term fundamentals.
What does this mean for traders? Patience looks like it will be rewarded here. Manage your risk, wait for your setup- the market always gives a second chance. According to Reuters, Fed officials have recently emphasized that inflation remains 'sticky,' which could have a significant impact on oil prices. A more hawkish Fed could lead to a stronger dollar and lower oil prices, while a more dovish Fed could have the opposite effect. As a trader, it's important to be aware of these factors and to adjust your strategy accordingly.
The surge in WTI is largely driven by geopolitical tensions, but the underlying technicals are also playing a role. The 1-hour chart shows a bullish trend, but the ADX indicates only moderate strength. The 4-hour chart is more bullish, with the RSI at 69.97 and the MACD showing positive momentum. The daily chart, however, is more neutral, with the RSI at 82.41 and the Stochastic indicator showing a bearish signal. This mixed picture suggests that the rally might be overextended in the short term, and a period of consolidation or a pullback could be in the cards. The key levels to watch are $79.63 (resistance) and $78.27 (support). A break above the resistance could trigger further gains, while a break below the support could signal a more significant correction.
WTI breaks above $79.63, fueled by continued geopolitical tensions, targeting $80.45 and potentially $80.74. Continuation depends on sustained buying pressure and a weakening dollar.
WTI fails to hold above $78.27, succumbing to overbought conditions and profit-taking, targeting $77.73 and potentially $76.91. Depends on easing geopolitical tensions and a stronger dollar.
Frequently Asked Questions: WTI Analysis
Is WTI a good buy right now?
WTI at $79.53 presents a mixed picture. The bullish momentum is strong, but overbought conditions suggest caution. A confirmed breakout above $79.63 could present a buying opportunity, but a break below $78.27 could signal a sell-off.
What is the WTI price forecast for this week?
The WTI price forecast for this week depends on geopolitical developments and technical factors. A sustained rally above $79.63 could target $80.74, with a probability of 60%. A break below $78.27 could lead to a test of $76.91, with a probability of 40%.
What are the key support and resistance levels for WTI?
Key support levels for WTI are $78.27, $77.73, and $76.91. Key resistance levels are $79.63, $80.45, and $80.74. These levels could act as potential entry or exit points for traders.
Why is WTI moving today?
WTI is moving today due to escalating geopolitical tensions in the Middle East, particularly in the Strait of Hormuz. The potential for supply disruptions is driving up prices, but overbought conditions are also creating some downward pressure.
Volatility creates opportunity - those prepared will be rewarded. With disciplined risk management, these choppy waters can be navigated safely. Pay close attention to the $79.63 level, as this is what will dictate the short term outlook of the commodity.
Technical Outlook Summary
| Indicator | Value | Signal |
|---|---|---|
| RSI (14) | 59.59 | Neutral |
| MACD Histogram | Positive | Bullish |
| Stochastic | K=50.08, D=79.17 | Bearish |
| ADX | 21.02 | Trending |
| Bollinger | Upper Band | Watch |
Key Levels
Support Levels
Resistance Levels
Track markets in real-time
AI-powered analysis, technical indicators and real-time price data.
Join Our Telegram Channel
Breaking market news, AI analysis and trading signals instantly.
Join Channel