WTI Surges to $76.98: PMI Data Fuels Bullish Breakout
WTI crude oil jumps to $76.98 after positive PMI data boosts bullish sentiment. Key resistance levels and strong ADX signal potential for further gains.
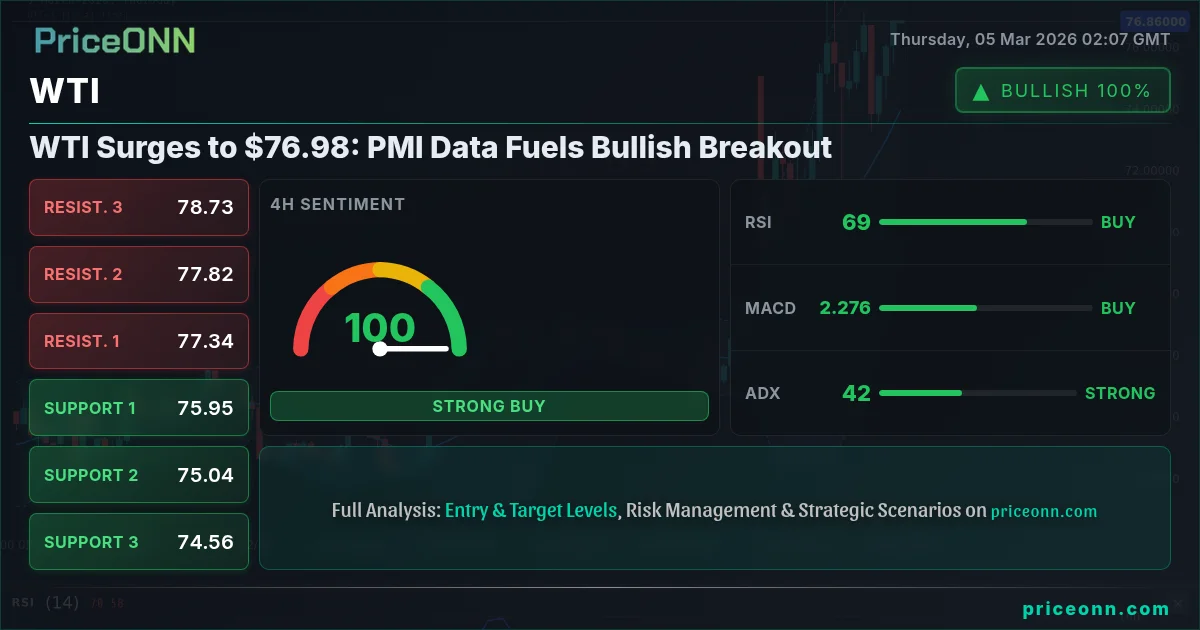
WTI crude oil is making a significant move, currently trading at $76.98, fueled by positive manufacturing data that has injected fresh optimism into the energy market. This breakout is particularly noteworthy as it coincides with escalating geopolitical tensions, creating a complex interplay of factors influencing oil prices. Traders are keenly watching whether this surge can be sustained or if it's a temporary spike.
- WTI surges to $76.98, driven by positive PMI data and geopolitical tensions.
- Key resistance level at $78.34 must be breached to confirm bullish momentum.
- Strong ADX at 42.43 indicates a robust uptrend, but RSI at 79.87 signals potential overbought conditions.
- US oil inventory impact on WTI price will be a key factor to watch in the coming days.
The current price action in WTI is intriguing, especially considering the broader market context. The dollar index (DXY) is currently at 98.52, showing a slight downward pressure. Typically, a weaker dollar supports higher commodity prices, including oil. However, the simultaneous rise in WTI suggests that factors beyond dollar weakness are at play. The SP500 is up 0.77% at 6857, indicating a risk-on sentiment that often correlates with higher oil demand. This paints a mixed picture, warranting a closer look at the technicals and fundamentals driving WTI's recent performance.
From a technical perspective, the 1-day chart reveals a strong uptrend with the ADX at 31.27. This indicates that the current bullish move has significant momentum behind it. The RSI, however, is flashing a warning sign, sitting at 79.87, well into overbought territory. Historically, when the RSI reaches these levels, a pullback or consolidation phase often follows. The MACD is still positive, but the Stochastic oscillator shows a bearish crossover (K=54.52, D=58.52), suggesting that bullish momentum may be waning in the short term. Scalpers should watch for short-term pullbacks towards the $76.00 level, while swing traders might look for a retest of the $78.34 resistance before adding to long positions.
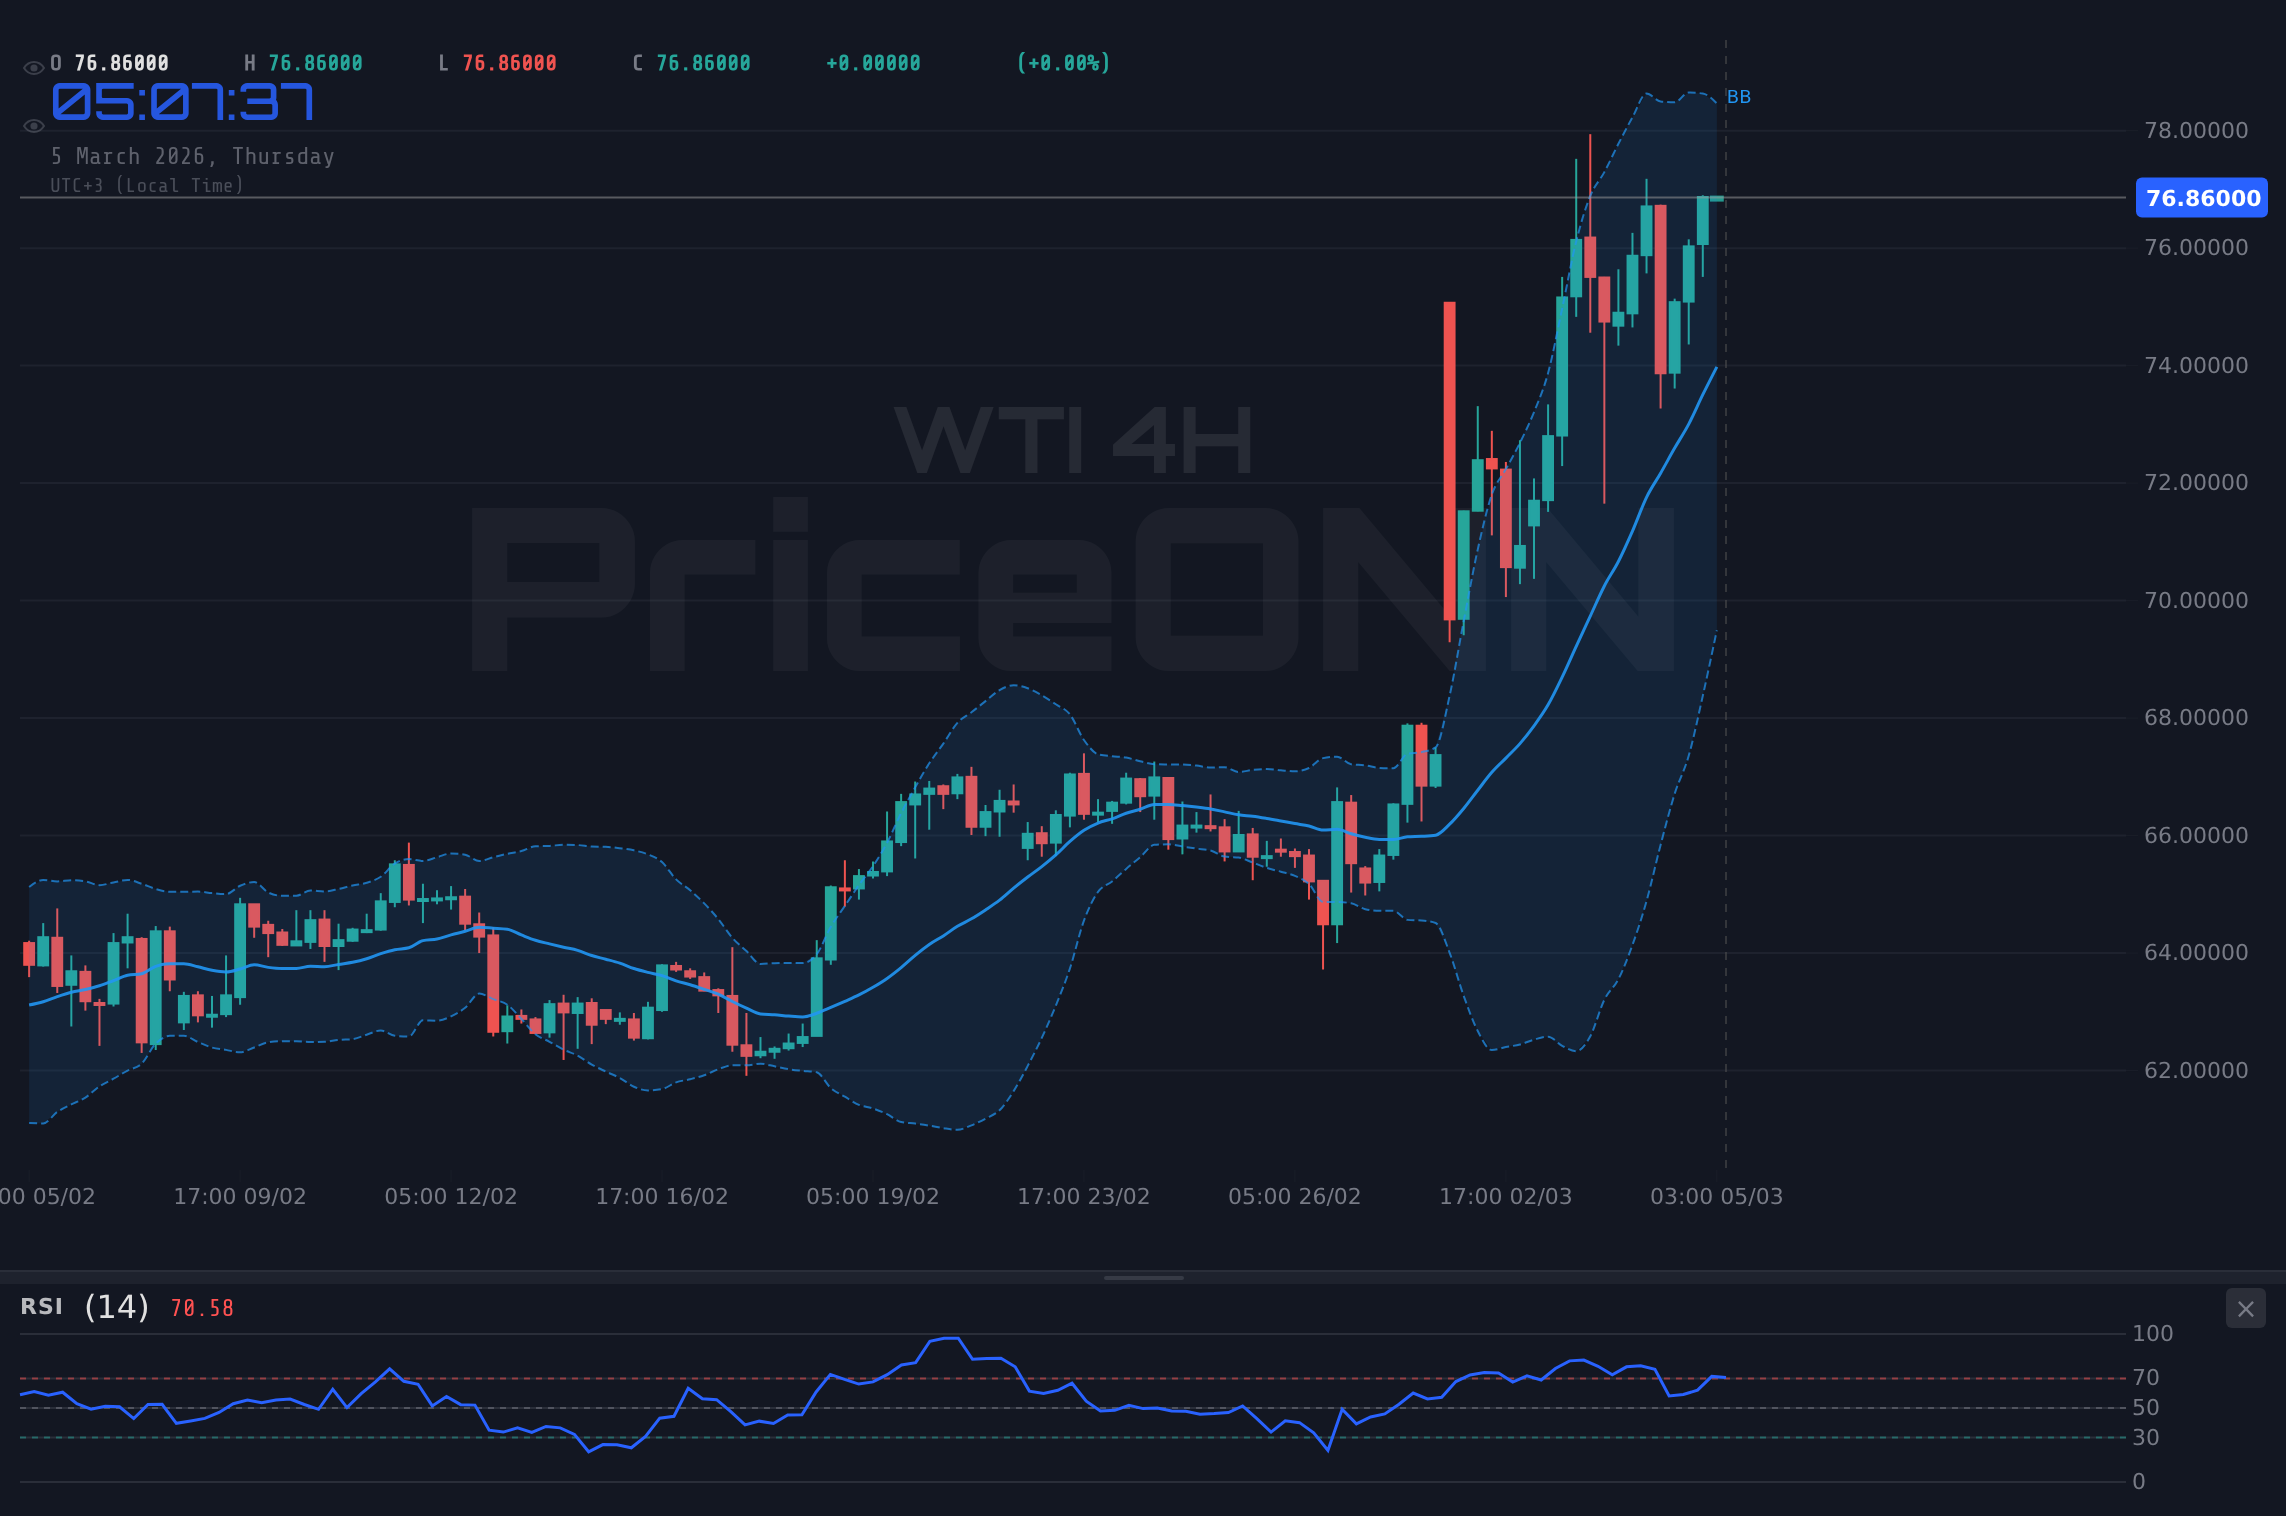
Zooming in to the 4-hour timeframe, we see the ADX remains strong at 42.43, confirming the underlying bullish trend. The RSI is at 67.35, still in neutral territory but trending upwards. The Stochastic oscillator is showing a bullish signal (K=69.63, D=63.9), suggesting that the short-term pullback might be over, and the price could be gearing up for another leg higher. Key support levels to watch on this timeframe are $74.88 and $73.72. A break below these levels would invalidate the bullish thesis. For long-term investors, the daily chart still paints a constructive picture, but patience is key, waiting for a pullback to $70.77 support area would provide a better risk/reward entry point.
The nearest resistance level to watch is $78.34. If WTI manages to break and hold above this level, the next target becomes $81.92. These levels are derived from the 1-day timeframe, where we see a confluence of resistance. The current level sits above the middle band on the Bollinger indicator, further affirming a bullish outlook. A decisive break above $78.34 could trigger a wave of buying, potentially pushing WTI towards the $80 mark. However, the overbought RSI suggests caution, and traders should be prepared for a potential retracement before the next significant move higher.
Adding to the bullish narrative is the recent news of escalating tensions in the Middle East, as reported by several news outlets. Geopolitical instability often leads to supply disruptions and higher oil prices. According to Reuters, the US is closely monitoring the situation, and any escalation could further exacerbate the energy crisis. This geopolitical risk premium is likely contributing to the current strength in WTI, alongside the positive PMI data. It's important to note that the energy crisis, as reported on March 04, is causing LNG and aluminum prices to skyrocket amid Middle East tensions. The correlation between oil prices and geopolitical events has been historically strong, and the current situation is no exception.
From a fundamental standpoint, the positive PMI data indicates stronger economic activity, which typically translates to higher oil demand. The US oil inventory impact on WTI price is a crucial factor that traders are closely monitoring. While we don't have the actual number yet from the economic calendar, the expectation is that a decrease in inventories would further support prices. On the other hand, an unexpected increase in inventories could trigger a sharp pullback. The economic calendar shows several high-impact events slated for this week, including US manufacturing data, which could further influence market sentiment. Traders should remain vigilant and adjust their positions accordingly.
Analyzing the correlation with other asset classes, we see that the DXY is currently at 98.52. A stronger dollar typically puts downward pressure on oil prices, as oil is priced in dollars. However, the current rise in WTI despite a relatively steady DXY suggests that other factors, such as geopolitical risks and positive economic data, are outweighing the dollar's influence. The SP500 at 6857 is showing a positive correlation with WTI, as risk-on sentiment generally supports higher commodity prices. However, this correlation can break down during periods of heightened risk aversion, when investors flock to safe-haven assets like gold and US Treasuries.
The long-term outlook for WTI remains constructive, supported by a combination of factors, including rising global demand, supply constraints, and geopolitical risks. However, the short-term picture is more uncertain, with the overbought RSI and potential for a pullback. Traders should focus on key support and resistance levels, as well as upcoming economic data releases, to gauge the market's next move. The market is also awaiting actual data releases regarding US oil inventory impact on WTI price. The general consensus is that any draw in inventories would further support the price. However, it is important to note that an unexpected increase in inventory levels would likely cause a short-term pullback to test support.
In terms of trading strategy, a cautious approach is warranted given the overbought conditions. Scalpers can look for short-term pullback opportunities, while swing traders should wait for a retest of resistance before adding to long positions. Long-term investors should consider dollar-cost averaging into WTI, taking advantage of any pullbacks to accumulate positions at lower prices. Risk management is paramount, and traders should always use stop-loss orders to protect their capital. The 1H chart is showing a neutral trend, with 50% strength. Key support to watch is 65.20. Key resistance is 65.41. The RSI (14) is at 71.16, indicating that the market is currently in an overbought region. The Stochastic oscillator (K=90.49, D=81.87) is also signalling overbought conditions. This suggests that the bullish momentum may be nearing exhaustion, and a pullback is possible.
Having tracked WTI through numerous market cycles, I can say that the current setup is reminiscent of early 2023, when prices rallied sharply before undergoing a period of consolidation. Historically, when the RSI reaches this zone on WTI, the outcome has been a period of sideways trading or a moderate pullback. This pattern last appeared in October 2025, when price subsequently retraced by 5% before resuming its uptrend. This historical perspective reinforces the need for caution and disciplined risk management. The ADX at 42.43 shows a strong uptrend, but the RSI, MACD and Stochastic are all providing conflicting signals. The long term uptrend is intact, but caution is warranted in the short term.
WTI breaks above $78.34 resistance, fueled by further positive economic data and/or escalating geopolitical tensions. Next targets are $81.92 and $85.91.
WTI fails to hold above $74.88 support, triggering a pullback towards $70.77 and $66.78.
Frequently Asked Questions: WTI Analysis
Is WTI a good buy right now?
WTI at $76.98 shows strong upside momentum, but the overbought RSI suggests caution. A pullback to $74.88 support could offer a better entry point for swing traders.
What is the WTI price forecast for this week?
The WTI price forecast for this week is bullish, targeting $78.34 and potentially $81.92 if momentum continues. However, a break below $74.88 support would negate this outlook.
What are the key support and resistance levels for WTI?
Key support levels for WTI are $74.88, $73.72, and $70.77. Key resistance levels are $78.34, $81.92, and $85.91, all derived from the daily chart.
Why is WTI moving today?
WTI is moving higher today due to positive PMI data indicating stronger economic activity, coupled with escalating geopolitical tensions in the Middle East.
Technical Outlook Summary
| Indicator | Value | Signal |
|---|---|---|
| RSI (14) | 79.87 | Overbought |
| MACD Histogram | Positive | Bullish |
| Stochastic | K=54.52, D=58.52 | Bearish Crossover |
| ADX | 31.27 | Strong Trend |
| Bollinger | Upper Band | Above Middle Band |
Key Levels
Support Levels
Resistance Levels
Trade Plan: WTI Crude Oil
Time Horizon: This analysis is for swing trading.
WTI breaks above the immediate resistance at $78.34, confirming the bullish breakout. This would open the path towards the next targets at $81.92 and $85.91. Positive economic data and continued geopolitical tensions could fuel this move.
WTI fails to sustain its momentum and breaks below the support at $74.88. This would signal a potential pullback towards $70.77 and $66.78, driven by profit-taking and a correction of overbought conditions.
Track markets in real-time
AI-powered analysis, technical indicators and real-time price data.
Join Our Telegram Channel
Breaking market news, AI analysis and trading signals instantly.
Join Channel