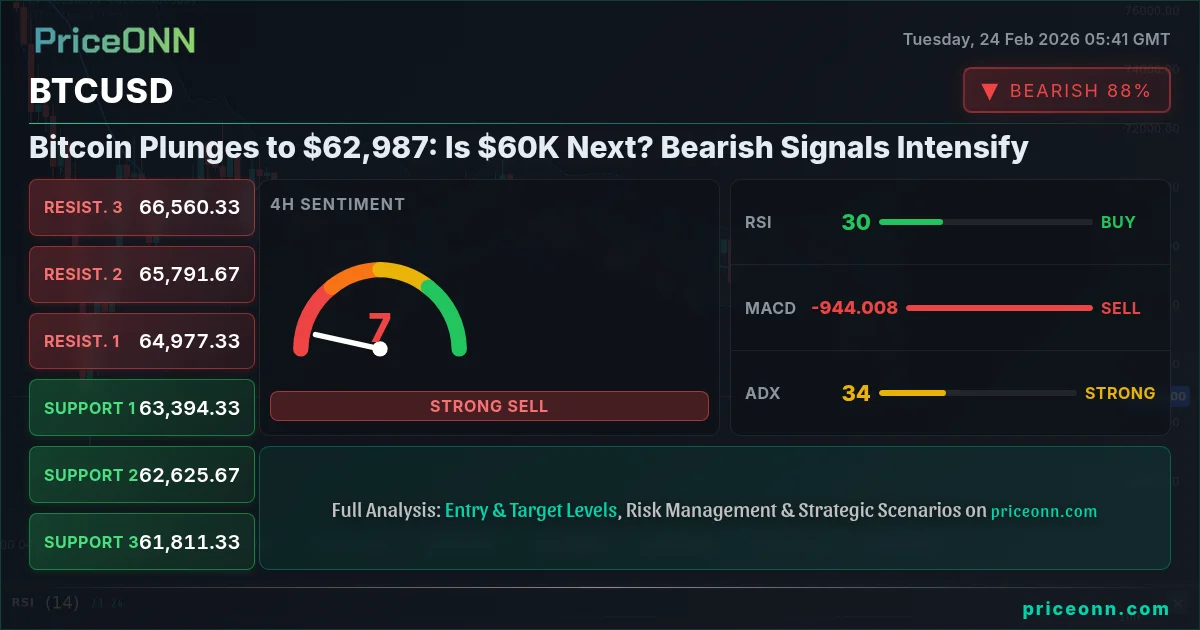
Bitcoin's battle at $62,987 is intensifying. Bulls and bears are locked in a fierce tug-of-war. The question now is: can the bulls defend this critical level, or will the bears push BTCUSD down to $60,000?
- RSI at 24.14 signals oversold conditions on the 1H chart, but strong downtrend persists.
- Key support level at $63,065.33 needs to hold to prevent further declines.
- ADX at 43.91 confirms a strong downtrend, increasing the likelihood of continued selling pressure.
- DXY's rise to 97.57 is adding further downward pressure on BTCUSD.
The Bull Case for BTCUSD: A Temporary Dip?
Despite the recent plunge to $62,987, there are arguments to be made for a potential bullish reversal. The most compelling is the oversold condition indicated by the Relative Strength Index (RSI) on shorter timeframes. On the 1H chart, the RSI sits at 24.14, a level that historically suggests a potential bounce. However, this signal must be viewed with caution. As any seasoned trader knows, oversold conditions can persist in a strong downtrend. The Stochastic on the 1H chart, with K=19.51 and D=34.74, confirms this bearish momentum, indicating that the oversold RSI alone isn't a reliable buy signal.
Furthermore, the 4H RSI at 29.46 reinforces the oversold territory, but the ADX on the 1D timeframe is at 57.07, signalling a very strong downtrend. This conflicting information warrants caution, and a long position should only be considered with strong confirmation signals. A potential trigger for a bullish reversal could be a break above the $64,020.67 resistance level on the 1H chart, coupled with a confirming bullish divergence on the MACD histogram.
The Bear Case for BTCUSD: $60K In Sight
The bearish case for BTCUSD is currently the more compelling one, driven by a confluence of technical indicators and macro factors. The daily chart shows a strong downtrend, with the ADX at 57.07 confirming the bearish momentum. The Stochastic oscillator on the daily chart, with K=16.8 and D=33.12, further supports this bearish outlook, suggesting that there is still room for further downside.
The immediate support level to watch is $63,065.33, which is the first support level on the 1D timeframe. A decisive break below this level could open the door for a test of the $61,547.67 support. The DXY's current strength at 97.57 is adding further downward pressure on BTCUSD. Traditionally, a rising dollar index puts pressure on Bitcoin, as it makes the cryptocurrency more expensive for international buyers. Traders should watch the DXY closely for any signs of reversal, which could provide some relief for BTCUSD.
Adding to the bearish sentiment is the overall risk-off environment in the broader market. The SP500 is showing signs of weakness, with the daily RSI at 46.96 and the ADX at 28.6, indicating a strengthening downtrend. This correlation suggests that if equities continue to sell off, BTCUSD is likely to follow suit.
Technical Analysis as the Tiebreaker: Which Way Will BTCUSD Break?
Given the conflicting signals, let's dive deeper into the technical picture. On the 1H chart, the Moving Average Convergence Divergence (MACD) shows negative momentum, with the MACD line below the signal line. This indicates that the bears are currently in control. However, the RSI's oversold reading suggests that the selling pressure may be exhausted in the short term.
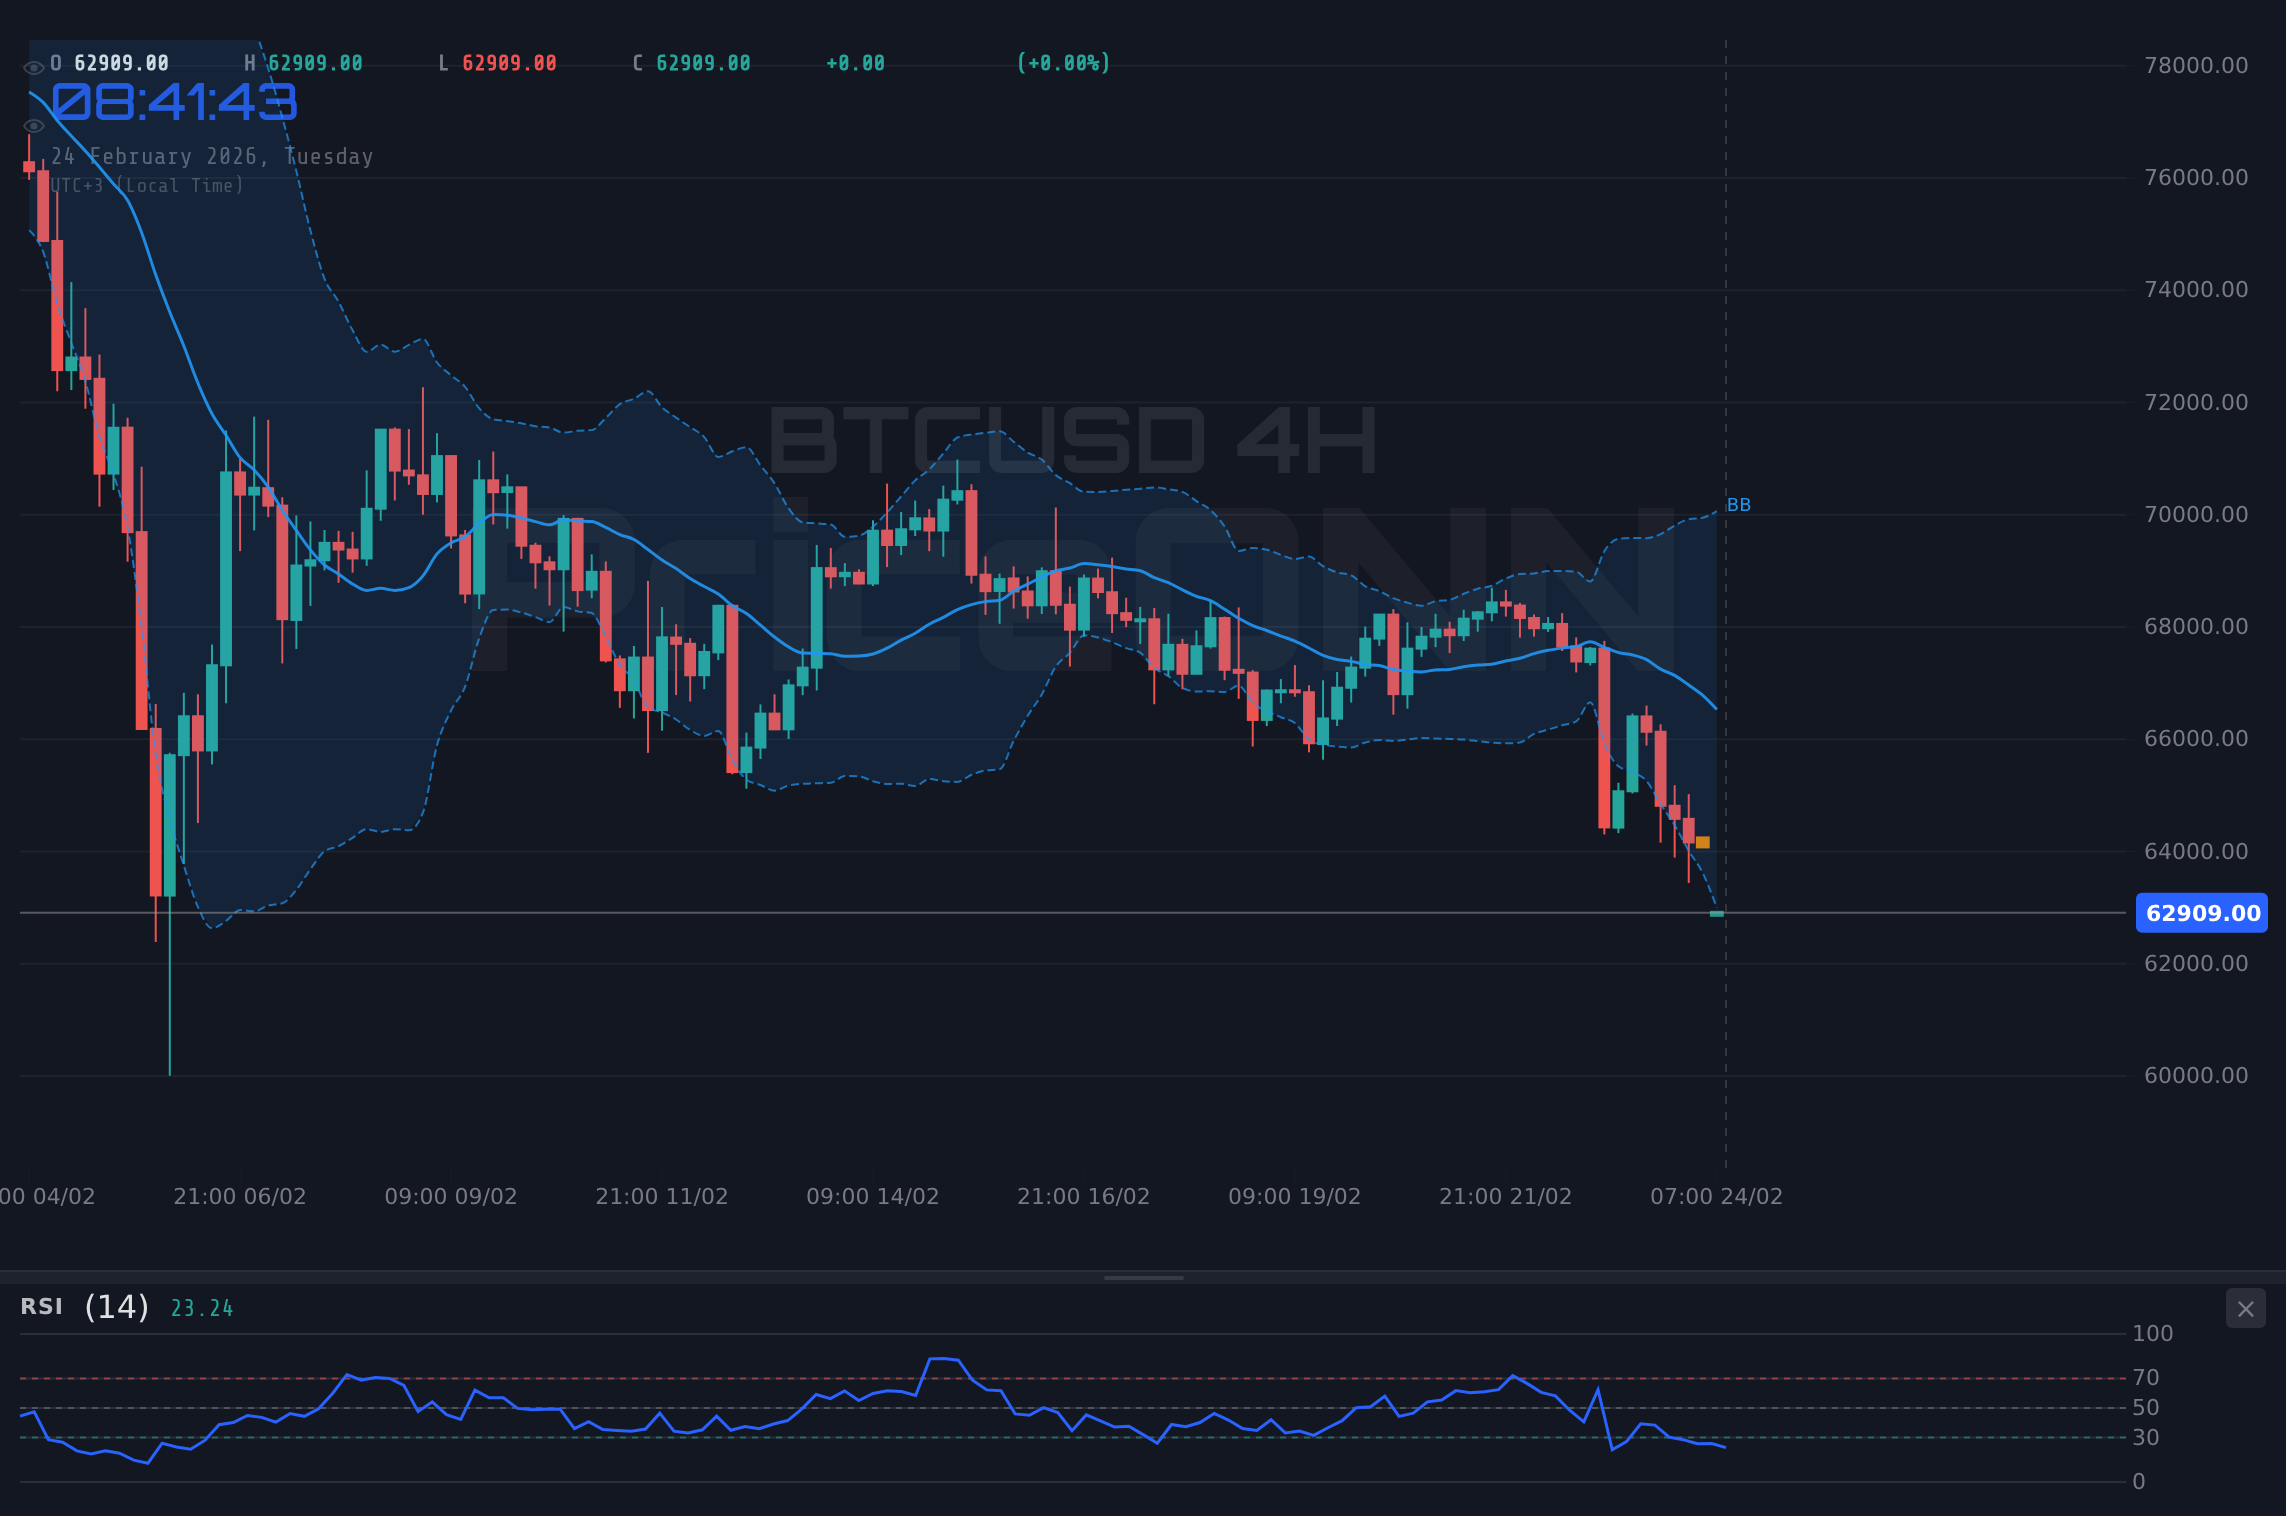
The 4H timeframe provides a clearer picture. The MACD histogram is also negative, further reinforcing the bearish momentum. The ADX on the 4H chart is at 32.01, which confirms a strong downtrend. This suggests that the bears are likely to remain in control in the medium term. The Stochastic oscillator on the 4H chart, with K=10.65 and D=25.48, is deeply oversold, but as mentioned earlier, oversold conditions can persist in a strong downtrend.
Multi-timeframe analysis reveals that the bearish momentum is stronger on the daily and 4H charts, while the 1H chart shows some signs of potential short-term oversold bounce. This suggests that any bullish rallies are likely to be short-lived and should be viewed with caution.
A bullish reversal requires a break above the $64,020.67 resistance on the 1H chart, followed by a sustained move above the $65,212.67 resistance on the 4H chart. The initial target would be $66,927.33.
A bearish continuation is more likely, with a break below the $63,065.33 support opening the door for a test of $61,547.67. A sustained move below this level could lead to a further decline towards $59,203.33.
Key Levels
Support Levels
Resistance Levels
Frequently Asked Questions: BTCUSD Analysis
Is BTCUSD a good buy right now?
Given the current bearish momentum and strong downtrend, BTCUSD is not a good buy right now. The price of $62,987 is trading below key resistance levels, and a break below the $63,065.33 support could trigger further declines.
What is the BTCUSD price forecast for this week?
The BTCUSD price forecast for this week is bearish, with a high probability of testing the $61,547.67 support level. A break below this level could lead to a further decline towards $59,203.33. The bullish scenario is less likely, with a 30% chance of a reversal.
What are the key support and resistance levels for BTCUSD?
Key support levels for BTCUSD are $63,065.33, $61,547.67, and $59,203.33. Key resistance levels are $64,020.67, $64,443.33, and $64,775.67. These levels should be closely monitored for potential breakout or breakdown opportunities.
Why is BTCUSD moving today?
BTCUSD is moving lower today due to a combination of factors, including a strong downtrend confirmed by the ADX, a rising DXY, and an overall risk-off environment in the broader market. Negative sentiment and profit-taking are also contributing to the decline.
Technical Outlook Summary
| Indicator | Value | Signal |
|---|---|---|
| RSI (14) | 24.14 | Oversold |
| MACD Histogram | Negative | Bearish |
| Stochastic | 19.51/34.74 | Oversold |
| ADX | 43.91 | Strong Downtrend |
| Bollinger | Lower Band | Breakout |
Track markets in real-time
AI-powered analysis, technical indicators and real-time price data.
Join Our Telegram Channel
Breaking market news, AI analysis and trading signals instantly.
Join Channel