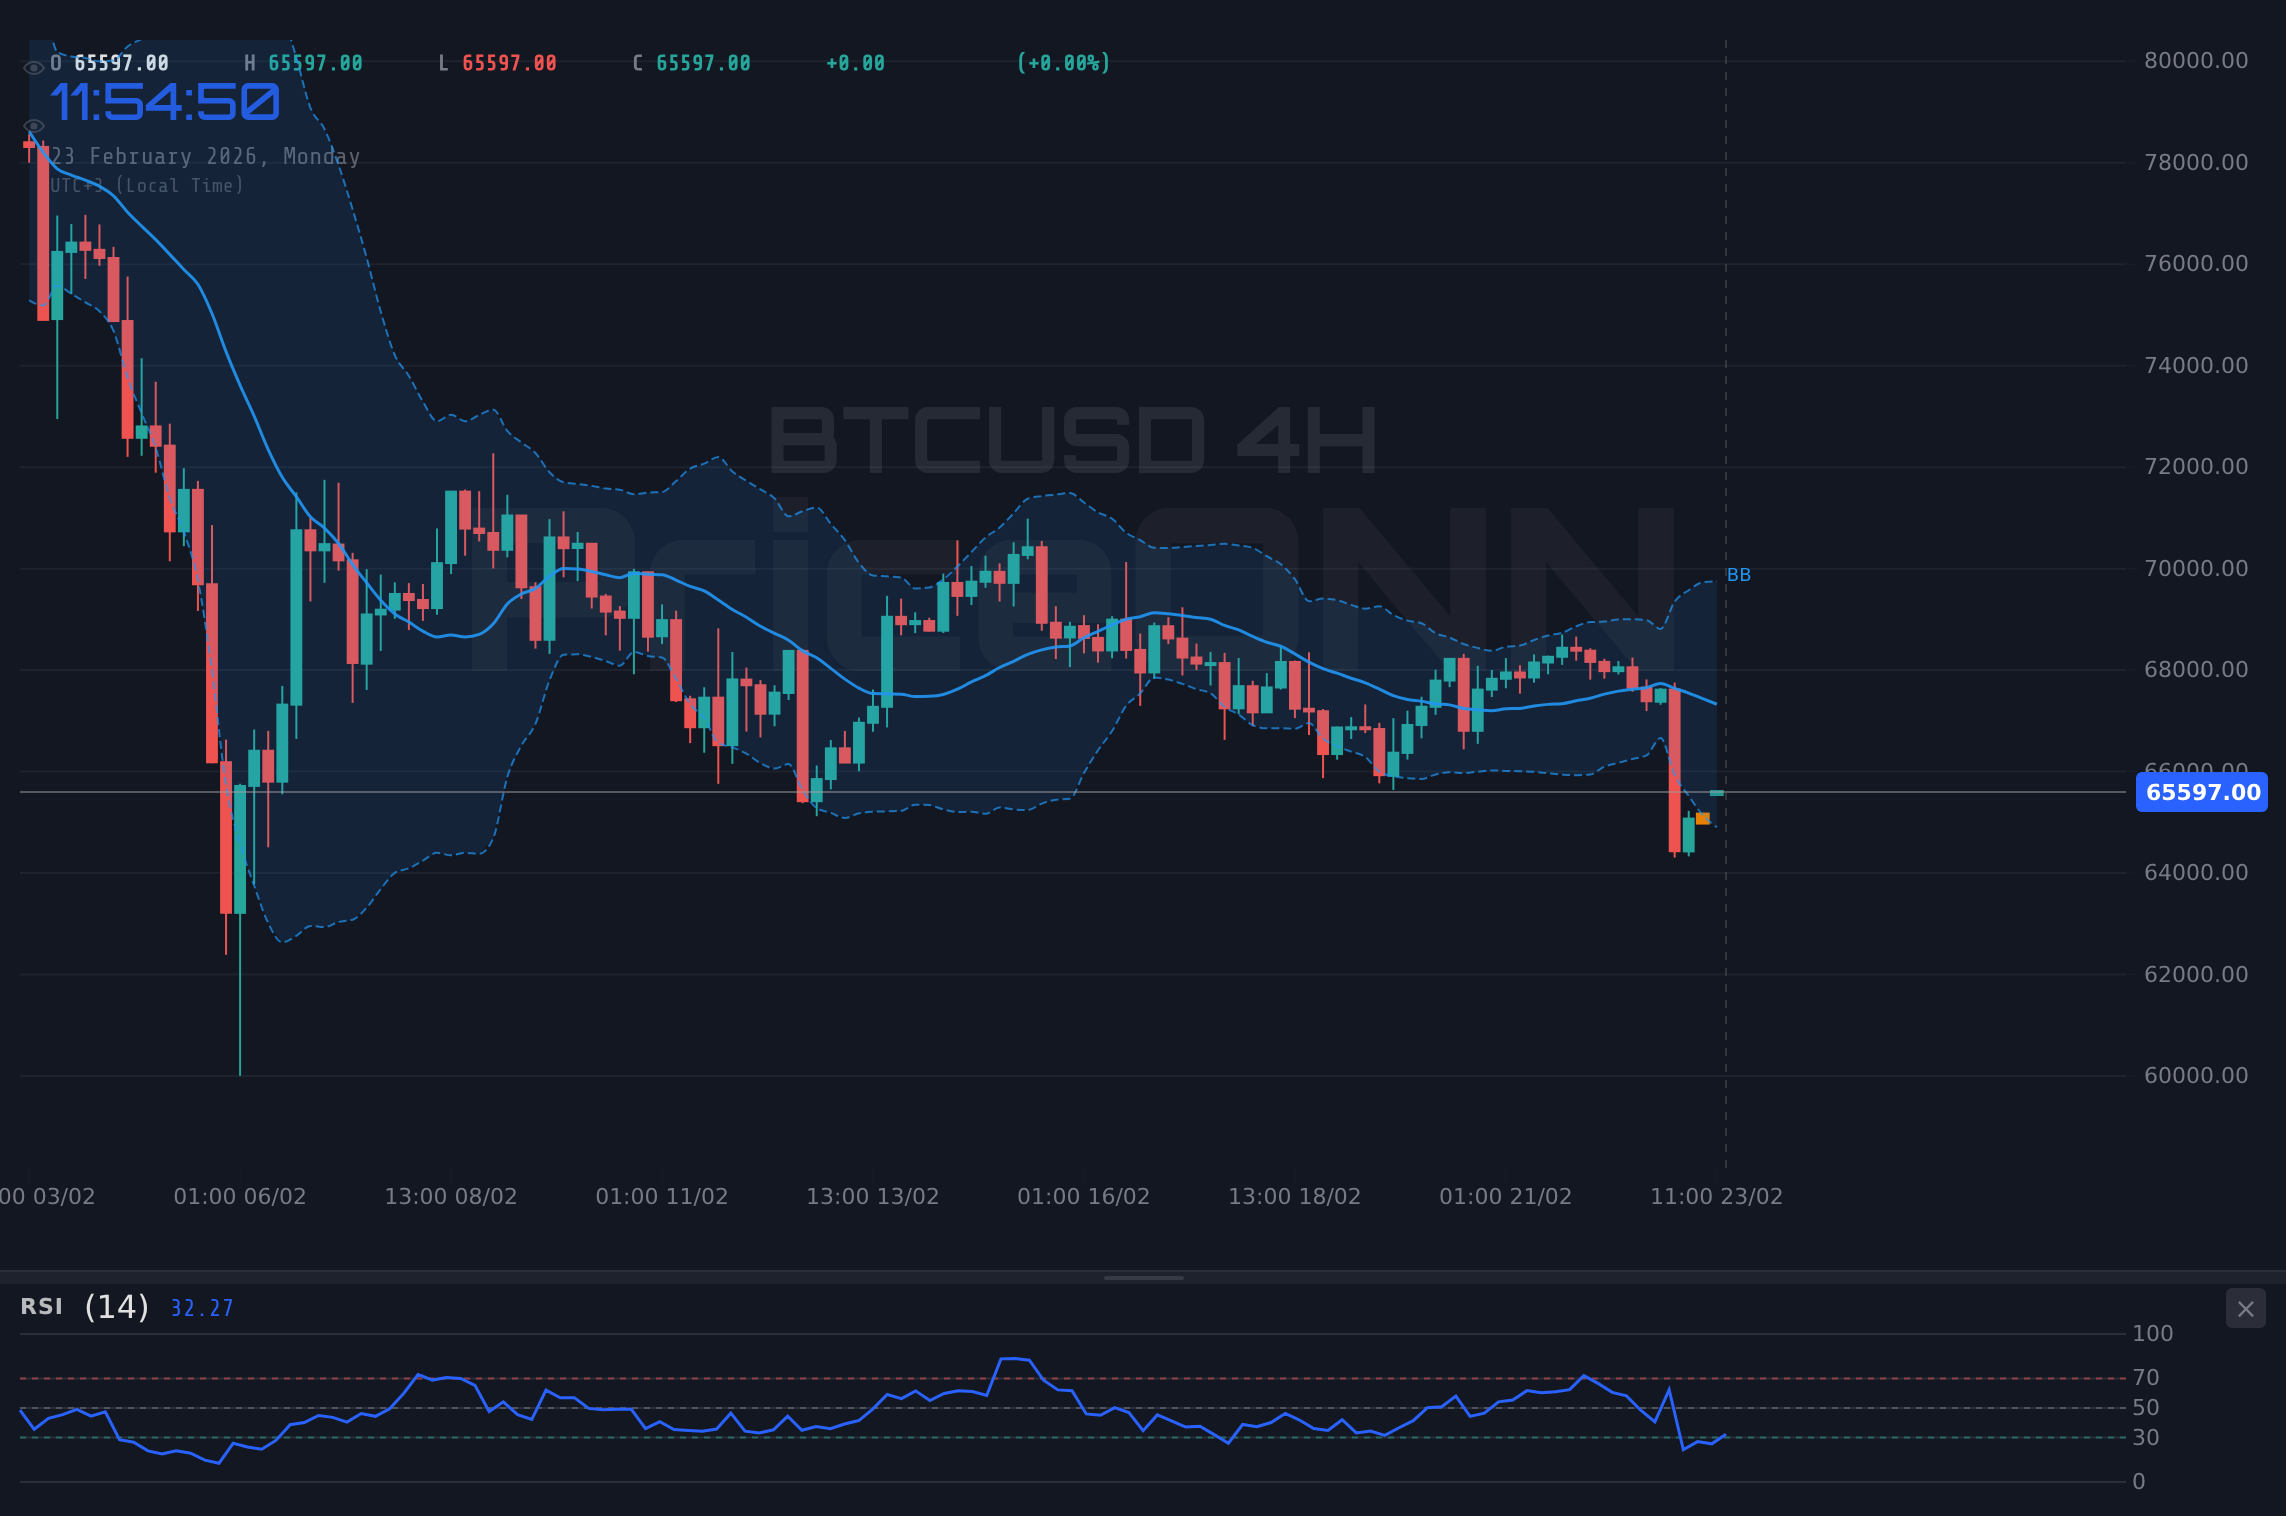
Bitcoin is currently facing a significant retreat, trading at $67,250.00. This decline below $68,000 has sparked discussions about the nature of this pullback. Is it a healthy correction or a harbinger of deeper issues within the cryptocurrency?
Investors should note that Bitcoin's current price action is crucial for determining future trends. Watch for key support and resistance levels as indicators.
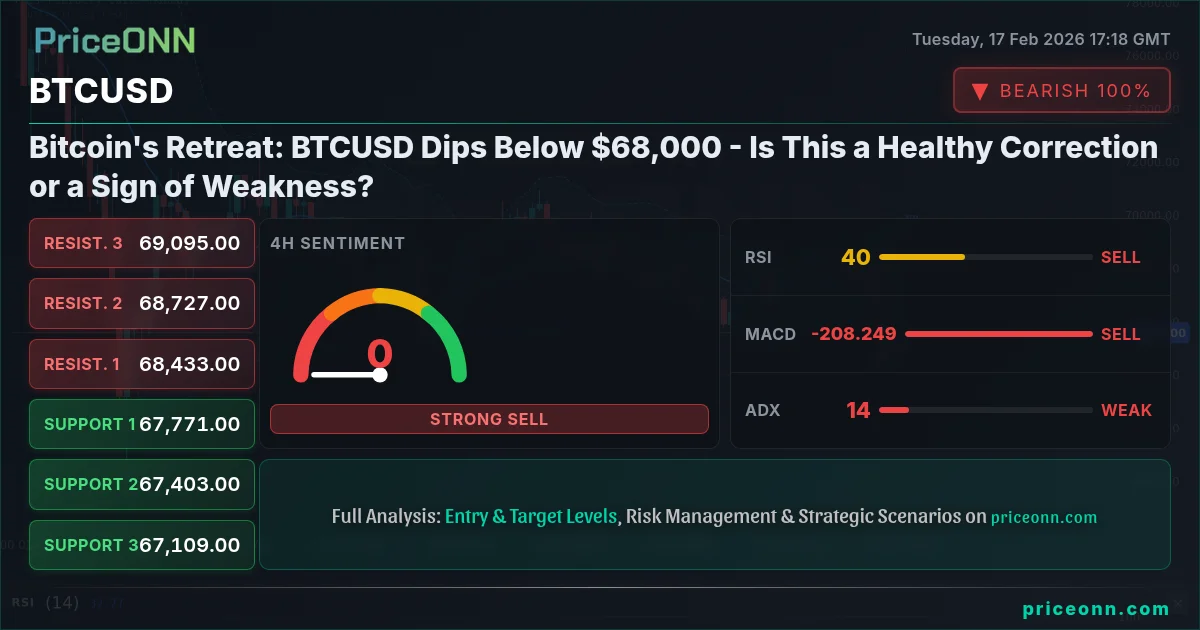
Current Market Overview
Bitcoin's most recent price point of $67,250.00 indicates a drop of 2.35% in a day, with a daily range of $66,625 to $69,238. This movement has led to a general sentiment of caution among traders.
Technical Indicators Analysis
Be cautious; with the current bearish indicators, a further decline could be on the horizon. Ensure to manage your risk effectively.
Support and Resistance Levels
If Bitcoin manages to break above $67,663, it could signal a potential recovery phase. Keep an eye on volume and market sentiment.
Upcoming Economic Events
Consider tightening your stop-loss as Bitcoin approaches key resistance levels to lock in gains.
Trade Plan
Trade Plan
Scenario A: Continued Decline
- Direction: Short
- Entry Trigger: Close below $66,875
- Target 1: $66,356 (~519 pip)
- Stop/Invalidation: Close above $67,663
Scenario B: Recovery Bounce
- Condition: Support holds at $66,875
- Entry Trigger: Close above $67,663
- Target: $68,451
- Invalidation: Close below $66,087
News Risk: Be cautious ahead of the upcoming CPI data release; volatility may increase.
Technical Summary
| Indicator | Value | Signal | Interpretation |
|---|---|---|---|
| RSI (14) | 38.19 | Bearish | Approaching oversold |
| MACD | -0.45 | Bearish | Below signal line |
| ADX | 17.7 | Weak | Trend is weak |
Bitcoin's current dip below $68,000 should be viewed with caution. The potential for recovery exists, but investors must remain vigilant and aware of the inherent risks in the market.
Track markets in real-time
AI-powered analysis, technical indicators and real-time price data.
Join Our Telegram Channel
Breaking market news, AI analysis and trading signals instantly.
Join Channel