

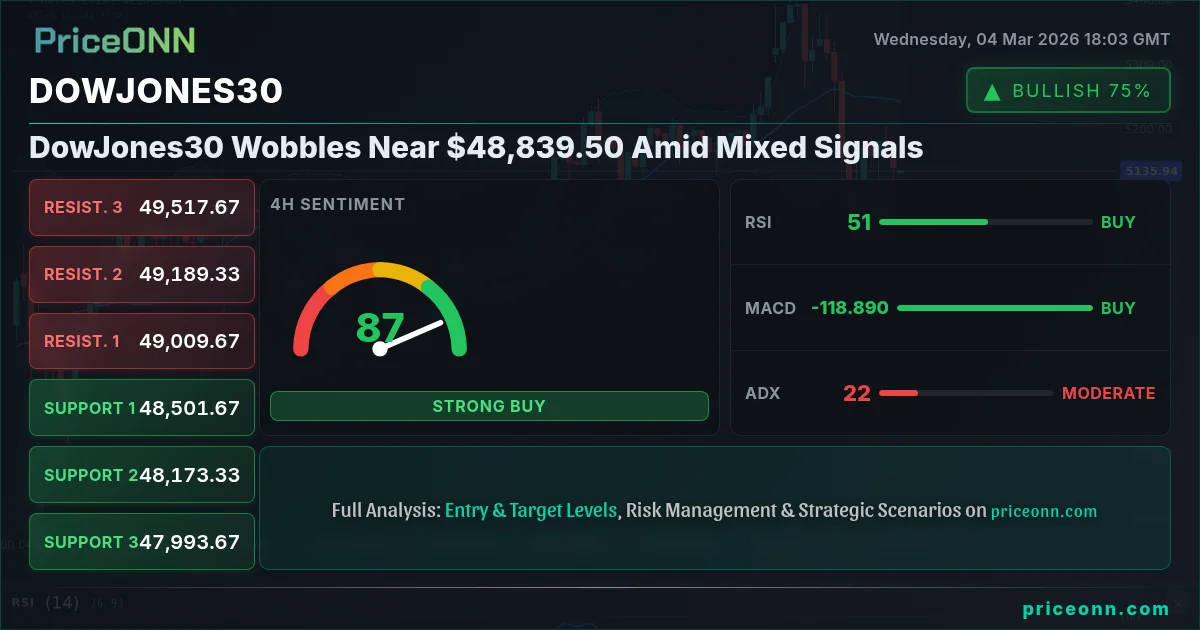
The DowJones30 is caught in a tug-of-war, trading near $48,839.50 as bulls and bears grapple for control. The index's direction hinges on a blend of technical signals and the upcoming PMI data, creating a volatile environment for traders.
- RSI at 63.89 indicates a possible overbought condition, suggesting potential for a pullback.
- Key support sits at $48,722.33, a level that needs to hold to prevent further declines.
- MACD histogram shows positive momentum, but Stochastic is signaling overbought conditions, creating a mixed signal.
- Upcoming PMI data this Wednesday could be a key catalyst, influencing the DowJones30 correlation with overall market sentiment.
The Bull Case: Momentum and Key Levels
The bullish argument for the DowJones30 centers on its underlying momentum and the ability to hold key support levels. The index is currently trading at $48,839.50, and a sustained move above near-term resistance could trigger further upside. The 1-hour chart indicates that the DowJones30 is exhibiting a neutral trend, but the RSI at 63.89, while not yet in overbought territory, is approaching levels where selling pressure could emerge. Positive momentum is also evident in the MACD, where the histogram is above the signal line, suggesting that buyers are still active.
Moreover, the recent performance of the Nasdaq 100, which has seen a significant increase of 1.87%, highlights a broader risk-on sentiment in the market. If this sentiment persists, it could provide a tailwind for the DowJones30. The key for the bulls is to maintain the price above the immediate support level of $48,722.33. A successful defense of this level would pave the way for a test of the next resistance at $48,875.33. The stochastic oscillator is also providing conflicting signals. The stochastic oscillator is currently signalling overbought conditions, with K=92.91 and D=76.68.
The Bear Case: Overbought Conditions and Data Risks
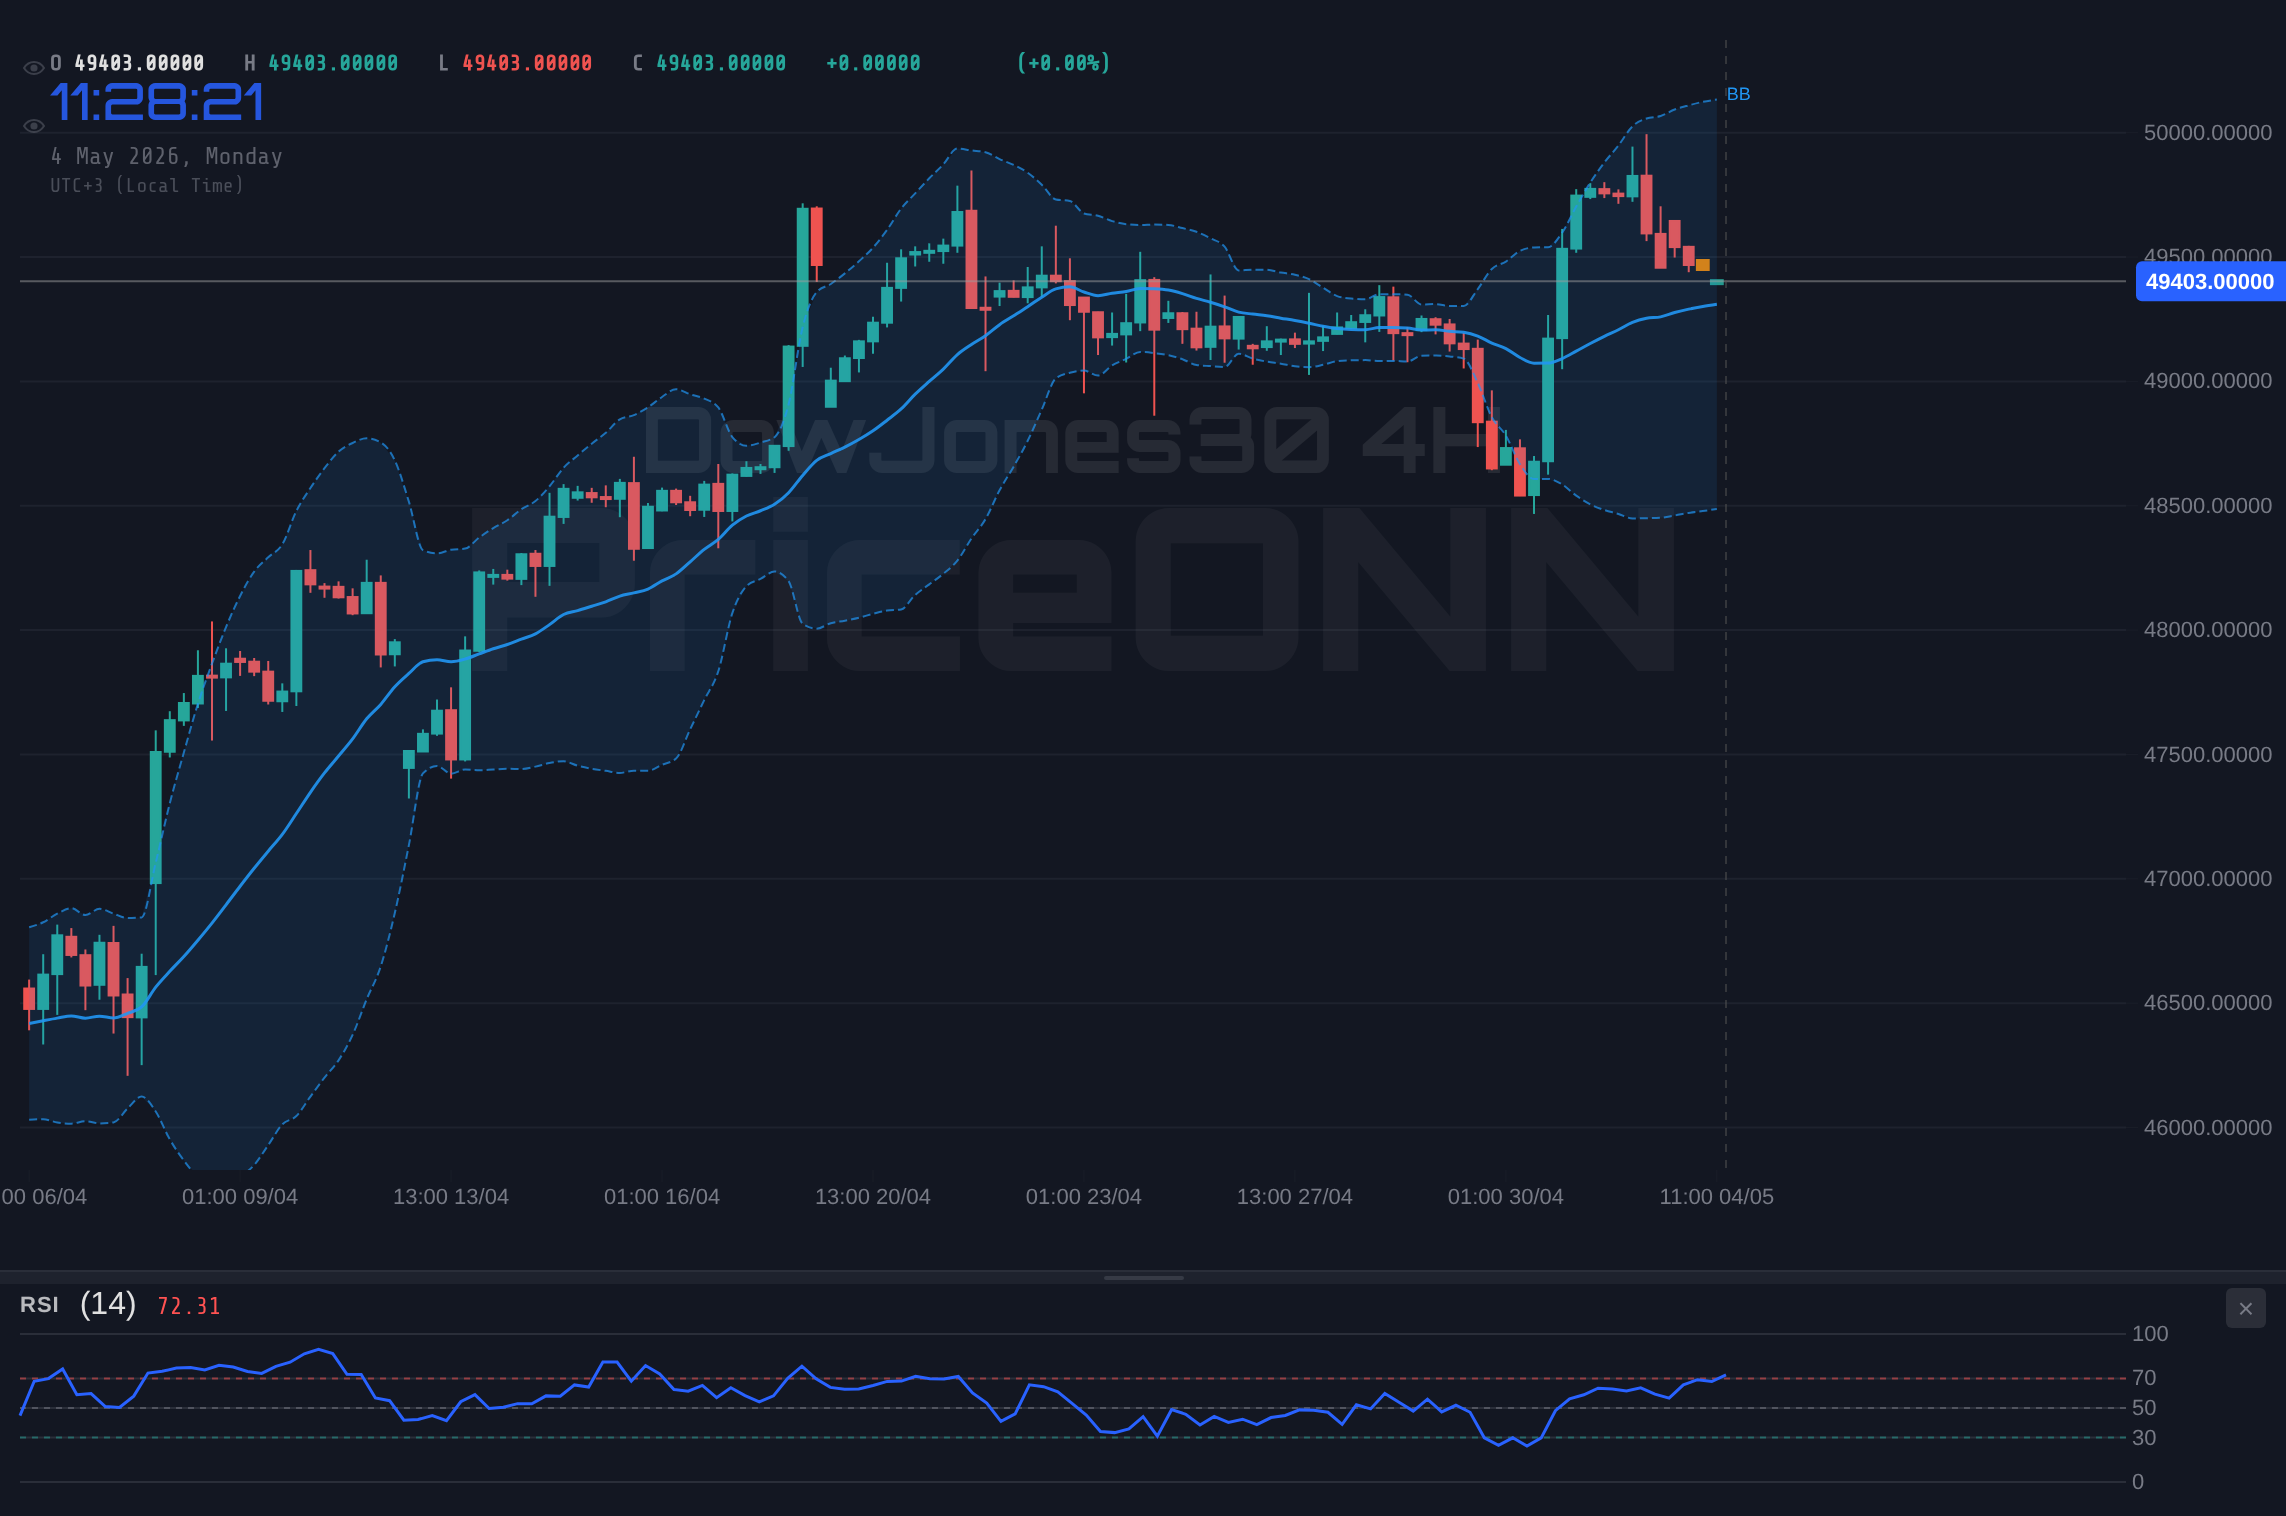
Conversely, the bearish scenario emphasizes potential overbought conditions and the risk posed by upcoming economic data releases. The DowJones30's 1-day chart shows a neutral trend, with the RSI at 45.64, indicating that the index is neither overbought nor oversold. However, the ADX is at 19.65, signalling a weak trend, which means that it could swing either way. The Stochastic oscillator is also displaying a potential downturn with K=44.84 and D=40.01.
The upcoming PMI data on Wednesday looms large. While the previous reading was positive, any significant deviation from expectations could trigger a sharp correction. As reported by Reuters, Fed officials are emphasizing that inflation remains 'sticky', suggesting a less dovish stance than previously anticipated. This could further weigh on the DowJones30, especially if PMI data disappoints. The bears are eyeing the immediate resistance at $48,875.33, and a failure to break this level could lead to a retest of the support at $48,722.33. If this support fails to hold, the next target would be $48,638.67.
Technical Indicators as a Tiebreaker
Analyzing the DowJones30 through a multi-timeframe lens reveals further insights. The 1-hour chart shows an ADX of 13.29, indicating a weak trend, while the 4-hour chart shows an ADX of 22.91, suggesting a moderate downtrend. However, the 1-day chart shows a weak trend. This divergence highlights the uncertainty in the market and the potential for volatility. The RSI on the 1-hour chart is at 63.89, approaching overbought conditions, while the 4-hour RSI is at 53.46, suggesting that there is still room for upside. The 1-day chart shows the RSI at 45.64, indicating that the market is neither overbought nor oversold.
Looking at the MACD, the 1-hour and 4-hour charts show positive momentum, while the 1-day chart shows negative momentum. This contradiction suggests that while the short-term trend may be bullish, the longer-term trend remains bearish. Furthermore, the Stochastic oscillator on the 1-hour chart is signalling overbought conditions, while the 4-hour and 1-day charts are signalling potential for a downturn. This further underscores the mixed signals in the market.
Economic Calendar Impact
The economic calendar is packed with high-impact events that could significantly influence the DowJones30. On Monday, the USD released data regarding manufacturing, inventories, and orders. On Wednesday, further data will be released regarding services, new home sales, and factory orders. These releases could provide further clarity on the strength of the US economy and the potential path of interest rate hikes, impacting the DowJones30's correlation with the DXY.
Trade Plan: Navigating the Uncertainty
Given the mixed signals, a cautious approach is warranted. A potential trade plan could involve waiting for a clear breakout above $48,875.33 or a breakdown below $48,722.33 before initiating a position. However, the signals are too mixed to make an informed decision, and it would be best to wait. WTI Crude is showing a strong uptrend, with the 1-day chart showing an ADX of 31.27. This could indicate a potential increase in inflation, which could impact the DowJones30.
A sustained break above $48,875.33 could trigger a rally towards $48,944.67, driven by continued risk-on sentiment and positive economic data. This scenario has a 40% probability.
A break below $48,722.33 could lead to a decline towards $48,638.67, fueled by disappointing PMI data and a stronger USD. This scenario has a 60% probability.
Technical Outlook Summary
| Indicator | Value | Signal |
|---|---|---|
| RSI (14) | 63.89 | Neutral |
| MACD Histogram | Positive | Bullish |
| Stochastic | 92.91/76.68 | Overbought |
| ADX | 13.29 | Weak Trend |
| Bollinger | Upper Band | Watch |
Key Levels
Support Levels
Resistance Levels
Frequently Asked Questions: DowJones30 Analysis
Is DowJones30 a good buy right now?
With the DowJones30 trading near $48,839.50, it's crucial to monitor the support level at $48,722.33. If this level holds, a long position could be considered; however, given the mixed signals, patience is key. A break above $48,875.33 is needed for confirmation.
What is the DowJones30 price forecast for this week?
The DowJones30 price forecast for this week hinges on the upcoming PMI data. A positive release could propel the index towards $48,944.67, while a negative surprise could trigger a decline towards $48,638.67. The probability of a significant move in either direction is high.
What are the key support and resistance levels for DowJones30?
Key support levels for the DowJones30 are $48,722.33, $48,638.67, and $48,569.33. Key resistance levels are $48,875.33, $48,944.67, and $49,028.33. These levels should be closely watched for potential breakout or breakdown opportunities.
Why is DowJones30 moving today?
DowJones30's movement today is influenced by a combination of factors, including mixed technical signals and anticipation of upcoming PMI data. The index is currently caught between bullish momentum and potential overbought conditions, creating a volatile environment.
Manage your risk, wait for your setup - the market always gives a second chance. With careful analysis and a disciplined approach, traders can navigate these choppy waters and capitalize on emerging opportunities. Mining stocks are recovering after Iran war fears triggered a commodity sell-off, which may push the DowJones30 up. Bitcoin is also outperforming stocks amidst market volatility, which may also be a factor.
Track markets in real-time
AI-powered analysis, technical indicators and real-time price data.
Join Our Telegram Channel
Breaking market news, AI analysis and trading signals instantly.
Join Channel