
ETHUSD Trades Near $1,789.62 Resistance: What's Next?
ETHUSD hovers near $1,789.62 resistance. With mixed signals and strong ADX, traders eye key levels for direction. Key Takeaways: RSI at 58.2 signals caution; critical support at $1766.05; MACD positive momentum; Fed expectations drive correlation.

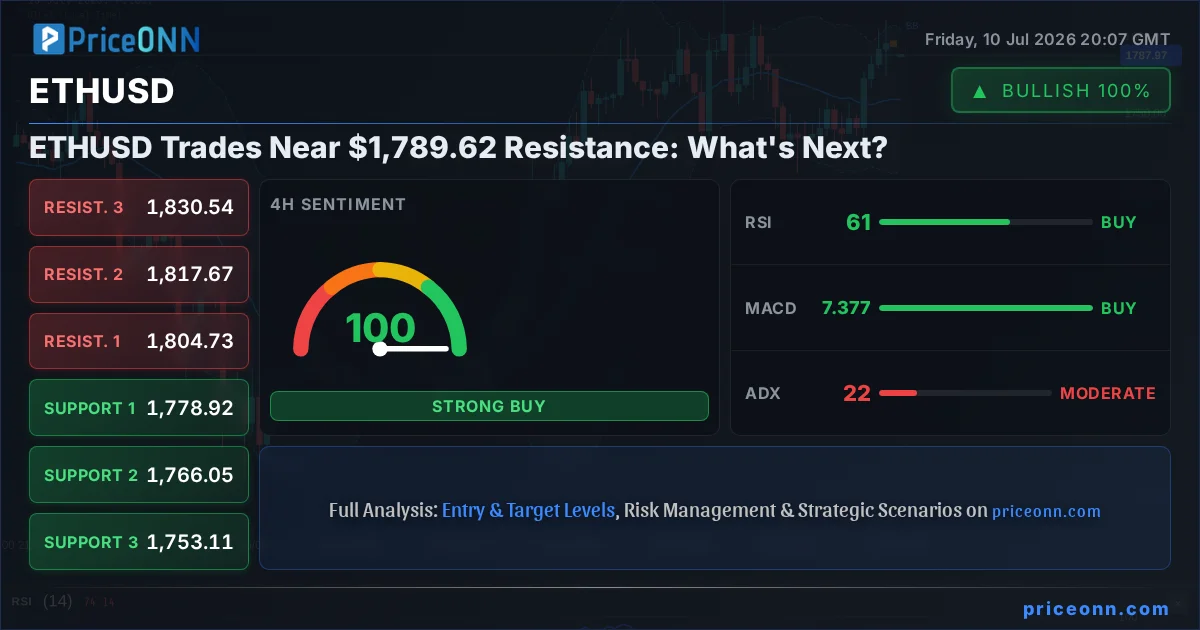
Now this is where it gets interesting! ETHUSD is bumping up against the $1,789.62 mark, and the technical picture is telling a complex story. Having navigated the choppy waters of 2024, where volatility has been the name of the game, observing Ethereum's current stance near resistance is crucial for any serious trader looking to capitalize on the next move. The market sentiment is leaning bullish, but not without its caveats. The ADX is showing a moderate trend strength at 21.01 on the 4-hour chart, while the daily chart exhibits a strong downtrend reading (ADX: 27.3), creating a bit of a tug-of-war that demands attention. This isn't a time for blind faith; it's a moment for calculated risk and precise analysis.
- RSI at 58.2 on the 4H chart signals a neutral-to-bullish leaning, but with caution as it's not yet overbought.
- Critical support for ETHUSD sits at $1766.05, a level that has held previously and is key to maintaining the current bullish momentum.
- The MACD histogram shows positive momentum on the 4H chart, indicating underlying buying pressure, but the 1H chart shows negative momentum.
- Fed rate expectations continue to drive ETHUSD correlation with the DXY, influencing its broader market moves.
Navigating the ETHUSD Resistance Zone
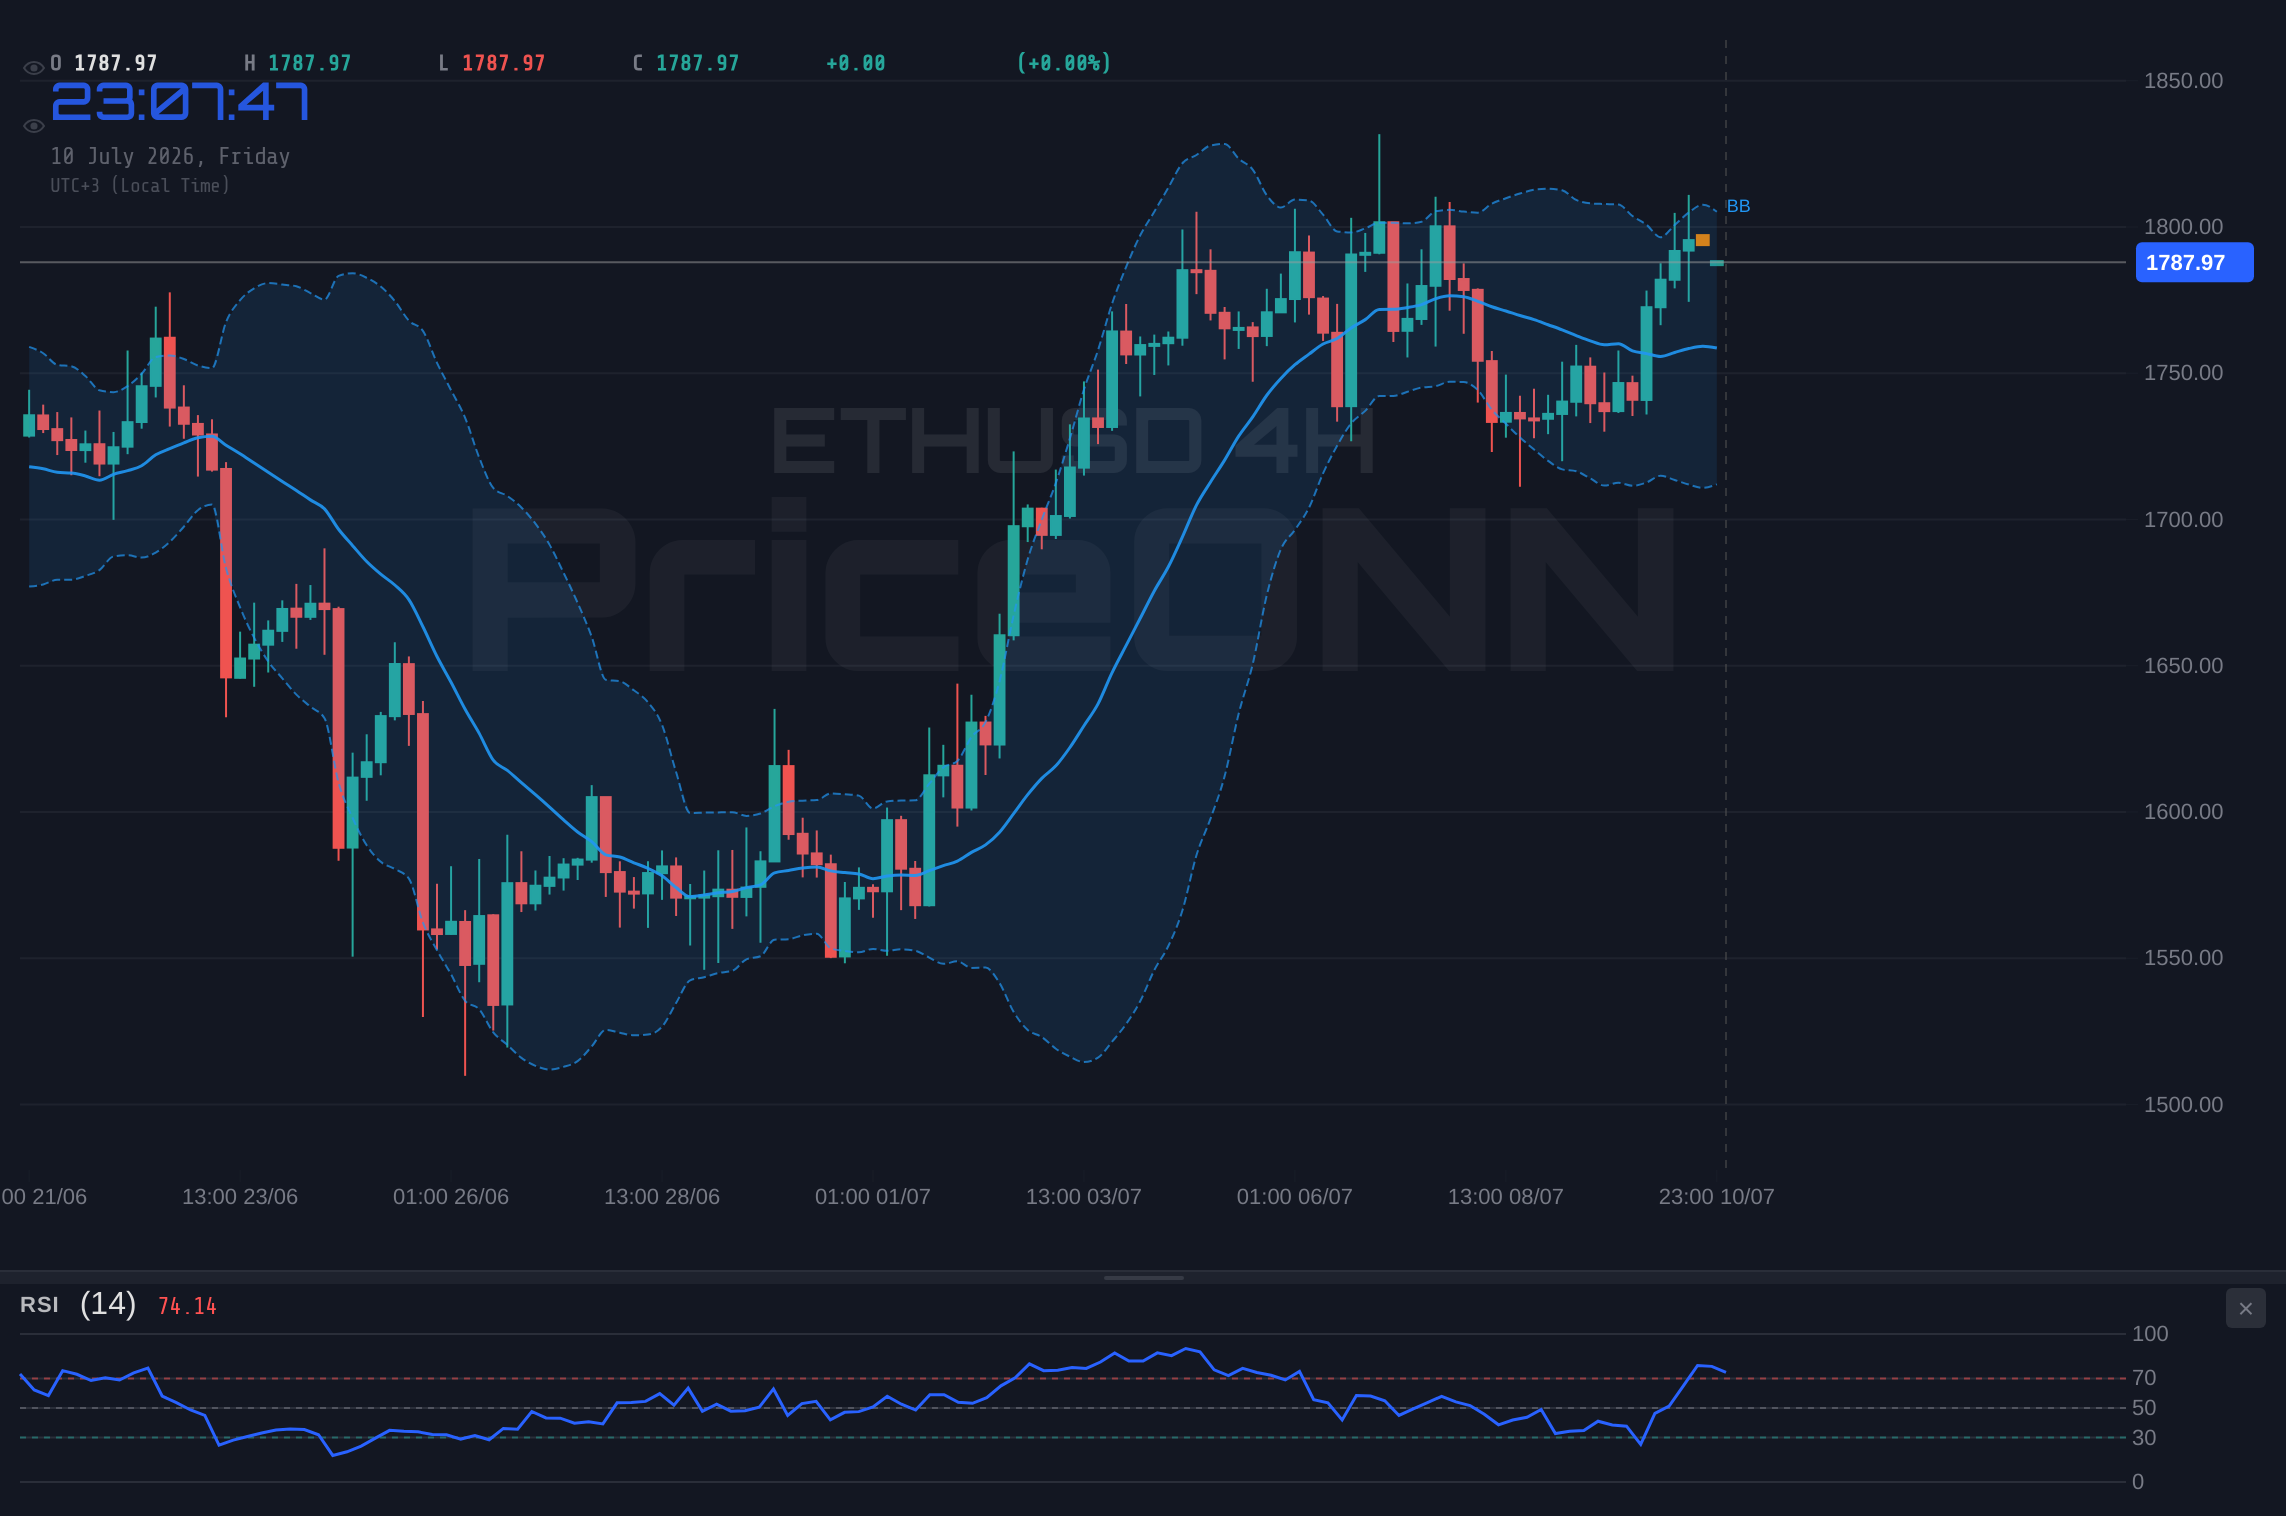
Ethereum's current price action around $1,789.62 presents a fascinating technical puzzle. On the 4-hour chart, ETHUSD is showing a generally bullish trend with a strength of 91%, supported by a positive MACD momentum and prices holding above the middle Bollinger Band. However, the shorter 1-hour timeframe paints a slightly more cautious picture, with negative MACD momentum and the price sitting below the middle Bollinger Band, despite a bullish ADX reading. This divergence across timeframes is exactly what seasoned traders watch for – it signals potential chop or a consolidation phase before a more decisive move. The Stochastic indicator on the 4H chart is entering overbought territory (K=83.33, D=74.48), suggesting that while the upward push has been strong, a pause or even a pullback could be on the cards before any significant breakout above $1,804.73.
The Influence of Macro Factors: DXY and Risk Appetite
It's impossible to analyze ETHUSD in a vacuum. The Dollar Index (DXY) is currently trading at 100.99, showing a mixed but generally upward trend across timeframes, with a strong daily trend reading (ADX: 33.38). Historically, a strengthening DXY often puts pressure on risk assets like Ethereum. However, the correlation isn't always direct. Today, SP500 is trading at 6572.87, showing strong upward momentum on the 1H and 4H charts, suggesting a healthy risk appetite in broader equity markets. This risk-on sentiment can provide a tailwind for cryptocurrencies, even if the dollar shows some resilience. The Nasdaq100 is also showing strong bullish signals across timeframes, reinforcing the idea that liquidity is flowing into riskier assets. This dichotomy between a firming dollar and rising equities creates an interesting backdrop for ETHUSD, potentially leading to a period of consolidation until one factor clearly dominates.
Diving Deeper into Technical Indicators
Let's break down what the indicators are telling us for ETHUSD. On the 1-hour chart, the RSI at 51.66 is firmly in neutral territory, leaning slightly towards bullish, but showing no signs of extreme overbought or oversold conditions. The MACD histogram, however, is negative, sitting below the signal line, which suggests that bearish momentum is currently in play on this very short-term timeframe. The Stochastic K line is at 7.37, deeply oversold, pointing to a potential bounce, but the D line is at 26.95, indicating that the downward pressure might still have some room to play out. The ADX at 28.84 suggests a strong trend, but the conflicting signals from MACD and Stochastic mean this trend could be susceptible to reversal or consolidation. On the 4-hour chart, the picture brightens considerably. RSI at 58.2 is in the healthy mid-range, indicating room for further upside. The MACD is positive, with the histogram above the signal line, confirming bullish momentum. Stochastic is in overbought territory (K=83.23, D=84.03), which usually signals a potential reversal, but given the overall trend strength, this could also indicate a strong uptrend where overbought conditions persist longer than usual.
Understanding the Daily Chart's Perspective
The daily chart for ETHUSD offers a longer-term perspective. The current price of $1,789.62 sits above the middle Bollinger Band, which is generally a bullish sign, indicating that the price is trading in the upper half of its recent range. The RSI at 52.49 is again in neutral territory, slightly above the 50 mark, confirming a lack of strong bearish conviction. The MACD is positive and above its signal line, reinforcing the bullish momentum on this timeframe. However, the Stochastic is showing a potential bearish divergence, with the K line at 75.05 and the D line at 84.86, suggesting a possible pullback from current levels. The ADX on the daily chart at 27.3 indicates a strong trend, but its directionality needs to be confirmed by other indicators. This daily view suggests that while the overall trend might be recovering, we are not out of the woods yet, and the $1,789.62 level represents a significant hurdle before a more sustained rally can be confirmed.
Key Levels and Potential Price Action
Looking at the immediate price action, the 1-hour resistance is at $1,789.49, followed by $1,796.13 and $1,801.10. A decisive break above $1,801.10 could signal a continuation of the bullish trend. On the downside, the 1-hour support levels are at $1777.88, $1772.91, and $1766.27. The 4-hour chart presents stronger levels: resistance at $1804.73, $1817.67, and $1830.54. Support on the 4-hour chart is found at $1778.92, $1766.05, and $1753.11. The daily support levels are more substantial, starting at $1724.48, then $1702.31, and $1684.71. These lower support levels are critical if the price fails to hold the $1766.05 area. The current price of $1,789.62 is hovering precariously close to the 1-hour resistance, making the next few hours pivotal. A failure to break through could lead to a retest of the $1777.88 or even the $1766.05 support levels.
Trade Scenarios for ETHUSD
Bearish Scenario: Consolidation and Retest
65% ProbabilityNeutral Scenario: Range-Bound Action
25% ProbabilityBullish Scenario: Breakout Above Resistance
10% ProbabilityWhat This Means for Traders Right Now
For scalpers, the immediate focus is on the $1,789.62 resistance. A rejection here could offer a short-term bearish opportunity targeting the $1777.88 support. Conversely, a confirmed break above $1,796.13 on the 1H chart might signal a quick scalp trade towards $1,801.10. For swing traders, the picture is more about patience. The 4-hour chart still shows bullish potential, but the overbought Stochastic and the proximity to resistance warrant caution. Waiting for a clear break above the $1,804.73 resistance on the 4H chart, or a confirmed bounce from the $1766.05 support, would provide a much clearer entry signal with a better risk-reward ratio. The ADX readings across timeframes are a key point here; while the 1H and 4H show strong trend potential, the daily ADX at 27.3 suggests that any breakout needs to be robust to be sustainable. It’s about waiting for confirmation rather than chasing the price.
Hedging Against Uncertainty: The Role of Correlation
As mentioned, the interplay between ETHUSD and macro indicators like DXY and SP500 is critical. With DXY at 100.99 showing strength, we need to monitor if it starts to weigh on risk assets. If the SP500 were to falter from its current levels around 6572.87, it would likely increase demand for safe havens and potentially put downward pressure on ETHUSD, especially if it fails to break its immediate resistance. Conversely, continued strength in equities, despite a firming dollar, could provide the necessary risk appetite to push ETHUSD higher. Traders should also keep an eye on oil prices. Brent crude is trading around $75.96, showing a neutral stance across timeframes but with a strong daily downtrend reading on ADX. Any significant move in oil could impact inflation expectations and, by extension, central bank policy, indirectly affecting ETHUSD. The current market environment demands a holistic view, integrating technical signals with these broader economic drivers.
Historical Context and Cycle Positioning
Looking back at Ethereum's performance in previous cycles, we often see periods of consolidation around key resistance levels before major moves. The current price action near $1,789.62, especially with the ADX suggesting a strong trend is forming (though conflicting across timeframes), is reminiscent of consolidation phases seen in late 2023. During those times, price would often test resistance multiple times before either breaking through or reversing. The fact that the daily chart shows a strong downtrend reading for ADX (37.3) while shorter timeframes show more bullish signals is a classic sign of a market in transition or potential range-bound chop. A sustained breakout above the daily resistance at $4156.42 for XAUUSD, for instance, could signal a broader risk-off shift that might not immediately benefit ETHUSD, even if it's a flight to perceived safe assets. Understanding where we are in the broader market cycle - whether it's a risk-on phase fueled by tech stocks or a risk-off shift driven by inflation fears - is paramount.
The Importance of Risk Management
Given the mixed signals and the critical resistance level at $1,789.62, risk management is paramount. For those looking to trade the immediate resistance, a tight stop-loss just above $1,796.13 would be prudent. If aiming for a bullish entry on a breakout, waiting for a confirmed 4-hour candle close above $1,804.73 is advisable, with a stop-loss placed below the breakout candle's low or the $1777.88 support. For bearish positions, a retest and failure of the $1777.88 support could offer an entry targeting $1766.05, with a stop-loss just above the entry point. The key takeaway is not to force trades but to wait for high-probability setups. The market is dynamic, and patience often yields better results than impulsive entries. The current ADX readings suggest that trend continuation is possible, but the conflicting short-term indicators mean that volatility could spike in either direction.
Final Thoughts: The Path Forward for ETHUSD
ETHUSD is at a critical juncture, trading near the $1,789.62 resistance level. The technical indicators present a mixed bag: bullish momentum on the 4-hour chart is tempered by negative signals on the 1-hour timeframe and potential overbought conditions on the Stochastic. The strong ADX readings across different timeframes suggest that a trend is developing, but its direction is yet to be decisively confirmed. Macro factors, particularly the strength of the DXY and the risk appetite shown in equities like SP500 and Nasdaq100, will play a significant role in dictating the next move. Traders should remain vigilant, focusing on the key support at $1766.05 and resistance at $1804.73. A decisive break above this resistance, confirmed by volume and other indicators, could open the door for further upside towards $1817.67. Conversely, a failure to break through and a subsequent drop below $1777.88 could signal a retracement towards $1766.05.
Frequently Asked Questions: ETHUSD Analysis
What happens if ETHUSD breaks above the $1,804.73 resistance level?
A confirmed break above $1,804.73 on the 4-hour chart, especially with strong volume, would invalidate the bearish scenario and likely target the next resistance at $1817.67. This would signal continued bullish momentum, supported by positive MACD and RSI readings.
Should I buy ETHUSD at current levels around $1,789.62, given the RSI at 58.2?
Buying at current levels carries risk due to the proximity of resistance. While the RSI at 58.2 is not overbought, the Stochastic on the 4H chart is nearing overbought territory, and the 1H MACD shows negative momentum. A more prudent approach might be to wait for a confirmed breakout above $1,804.73 or a bounce from the $1766.05 support.
Is the RSI at 58.2 a bullish signal for ETHUSD right now?
An RSI of 58.2 on the 4-hour chart is generally considered neutral to mildly bullish, indicating room for further upside without being overbought. However, it's crucial to consider other indicators like the MACD and Stochastic, which show mixed signals on shorter timeframes, suggesting caution is warranted.
How will the DXY's strength around 100.99 affect ETHUSD this week?
A strong DXY around 100.99 typically exerts downward pressure on risk assets like ETHUSD. However, if equity markets (SP500 at 6572.87) continue to show strong risk appetite, this correlation might weaken, allowing ETHUSD to potentially move higher despite dollar strength.
Track markets in real-time
AI-powered analysis, technical indicators and real-time price data.
Join Our Telegram Channel
Breaking market news, AI analysis and trading signals instantly.
Join Channel