

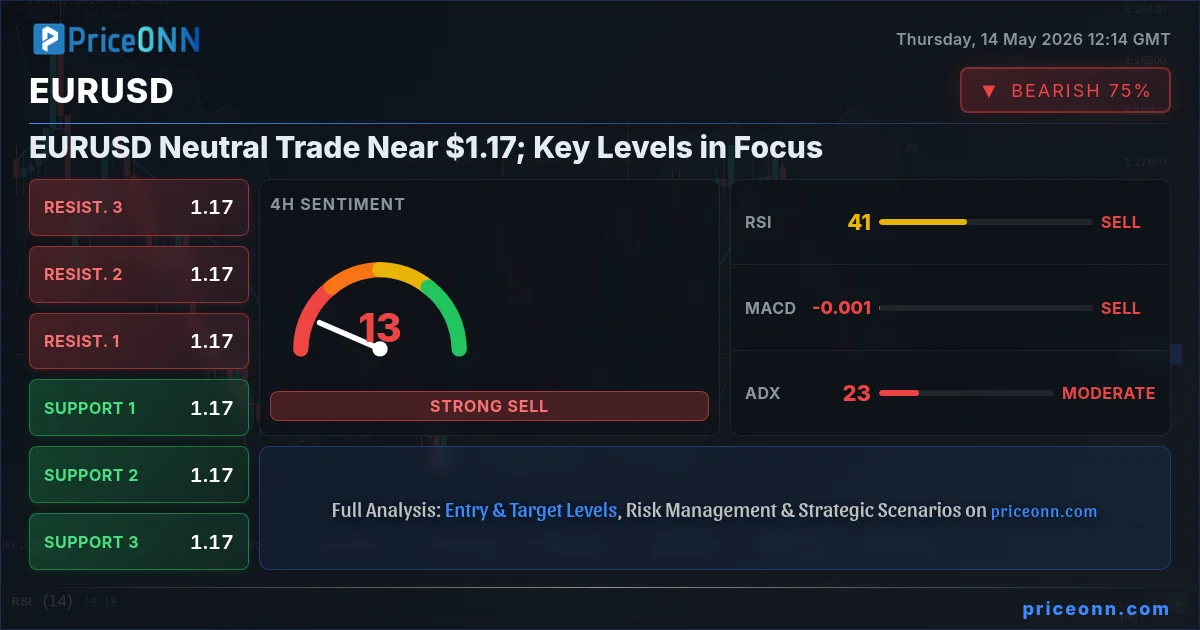
Now this is where it gets interesting! The EURUSD pair is currently locked in a tight range, dancing around the crucial $1.17 mark. It feels like the market's holding its breath, waiting for a catalyst, while the charts paint a picture of indecision. With the Dollar Index (DXY) showing a cautious upward bias, and a slew of economic data releases on the horizon, the path forward for this major currency pair hinges on a few critical levels. Let's dive into what the numbers are telling us right now.
- RSI at 49.12 signals neutral momentum on the daily chart, with a slight downward lean.
- Critical support sits at $1.16886, tested multiple times this week, while resistance is eyed at $1.17348.
- MACD histogram is negative, suggesting bearish momentum, but Bollinger Bands show an upward bias on the daily.
- Fed rate expectations and upcoming ECB commentary are key drivers, influencing EURUSD's correlation with the DXY.
The current technical setup for EURUSD is best described as a neutral tug-of-war. On the 1-hour chart, the trend is decisively bearish with a strength of 100%, but this is often followed by consolidation or a reversal. The ADX at 29.61 indicates a strong downtrend, yet the overall signal across timeframes is mixed, leaning towards selling on the 1-hour and 4-hour, but showing some buying interest on the daily. This divergence is precisely why traders are hesitant to commit. The price is currently hovering around $1.17033, a level that has seen significant back-and-forth action. We're seeing a strong sell signal on the 1H and 4H, but the 1D general signal shows a more balanced picture with 2 buys, 6 sells, and 0 neutral. This isn't a clear-cut direction, and that's the crux of the current market sentiment.
Navigating the Neutral Zone: What the Indicators Say
Let's break down the technical indicators to understand this neutral stance better. On the 1-hour chart, the RSI(14) is sitting at 37.18, firmly in neutral territory but trending downwards, suggesting sellers have a slight edge in intraday movements. The MACD is showing balanced momentum, not giving a strong directional cue. However, the Bollinger Bands are trading above the middle band, hinting at a potential upward bias, which contradicts the RSI's lean. Stochastic Oscillator is flashing a strong sell signal with %K at 12.94 and %D at 33.48, indicating oversold conditions could be approaching, but the strong ADX of 29.61 suggests that if a trend does form, it could be significant. This intraday picture is volatile and requires careful observation.
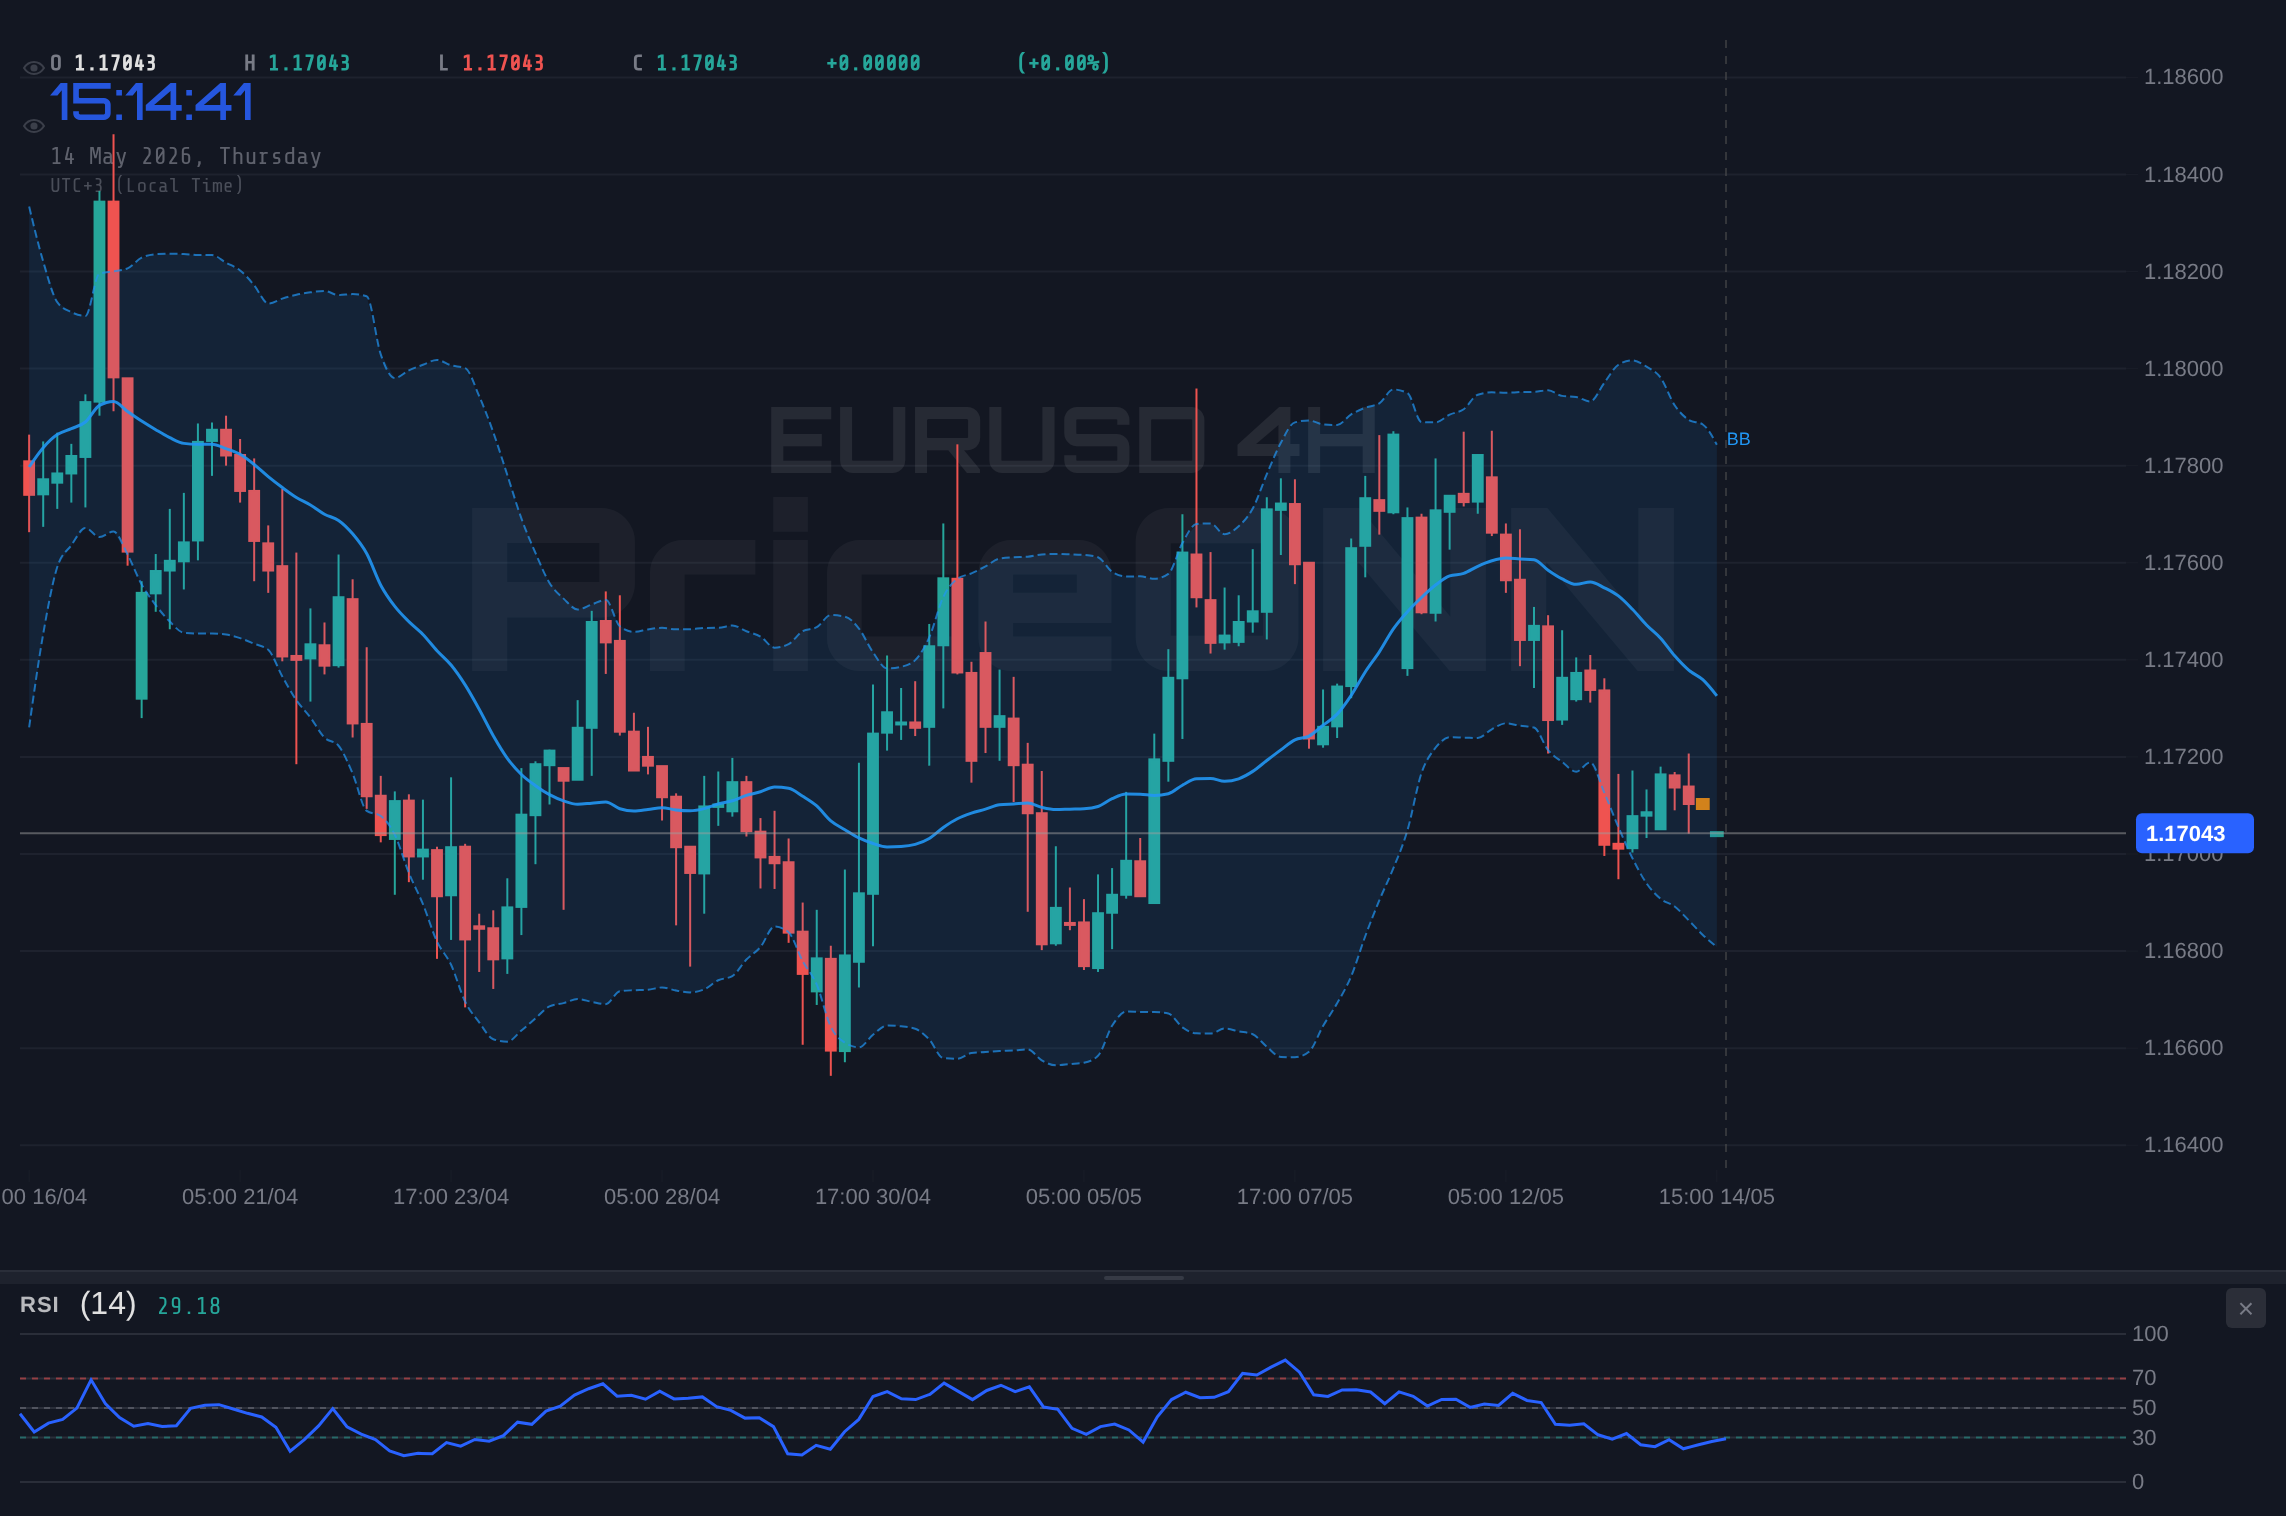
Moving to the 4-hour timeframe, the picture becomes slightly more nuanced. The trend is neutral with a 50% strength. RSI(14) at 40.64 continues to show a downward lean, still not indicating oversold conditions but certainly not bullish. MACD momentum is negative, aligning with the bearish undertones, and it's trading below the signal line. The Bollinger Bands, however, are above the middle band, suggesting a rising price action, while Stochastic is giving a buy signal with %K at 36.7 and %D at 22.5. The ADX here is 23.09, indicating a moderately strong downtrend, which is a significant factor. The overall signal is a mix, but the 4H chart leans towards selling opportunities, with 2 buys, 6 sells, and 0 neutral signals.
The daily chart provides the broadest perspective, and it's here that the neutrality is most pronounced. The trend is officially neutral (50% strength), with RSI(14) at 49.12, hovering just below the midpoint – a classic sign of indecision. The MACD indicator shows negative momentum, trading below its signal line, reinforcing the bearish sentiment seen on shorter timeframes. However, the Bollinger Bands are above the middle band, indicating an upward tendency, and the Stochastic Oscillator is giving a buy signal with %K at 35.89 and %D at 61.42, suggesting potential for a bounce. The ADX at 23.07 signifies a moderately strong uptrend, which is a stark contrast to the strong downtrend indicated on the 4H. This conflict between timeframes is why EURUSD is stuck in its current range. The daily signal is also split: 2 buys, 6 sells, and 0 neutral.
The Dollar's Shadow: DXY and Correlation
No analysis of EURUSD is complete without examining the Dollar Index (DXY). Currently trading at 98.29, the DXY is showing a bullish trend on the 1-hour chart (strength 97%) and a neutral stance on the 4-hour and daily charts (50% strength). This suggests underlying strength in the dollar, which typically puts pressure on EURUSD. When the DXY strengthens, it means the US dollar is gaining value against a basket of other major currencies, making it more expensive for holders of the Euro to buy dollars, and thus, potentially driving EURUSD lower. The current DXY levels, particularly the 1-hour bullish trend, reinforce the bearish signals seen on the shorter timeframes for EURUSD. However, the neutral daily trend for the DXY means this pressure might not be sustained, contributing to the overall indecision in the EURUSD pair.
The interplay between DXY and EURUSD is crucial. Historically, they have an inverse correlation, meaning when the DXY rises, EURUSD tends to fall, and vice versa. With the DXY showing strength in the short term, this reinforces the bearish bias on the 1-hour EURUSD chart. The DXY's RSI is at 61.01 on the 1H, indicating a bullish momentum, while the MACD is negative but above the signal line, suggesting a potential shift. The Stochastic is in the overbought zone, flashing a potential reversal signal for the dollar itself, which could offer some respite to EURUSD. This dynamic creates a complex environment where the dollar's strength is a significant, but not the sole, determinant of EURUSD's immediate direction.
Economic Calendar Whispers: What's Next for EURUSD?
Looking at the economic calendar, the upcoming days are packed with high-impact events that could easily shatter the current neutral stance of EURUSD. While specific data points for today (May 14th) are listed as '-' for Actual and Forecast, the previous readings give us context. For instance, the previous USD data showed figures like 3.98% and 0.6% for unspecified indicators, and GBP data showed 1% and 0.5%. The absence of today's actuals suggests we are either awaiting them or they were not significant enough to be detailed in this snapshot. However, the mention of potential ECB rate hikes in June, as signaled by ECB Chief Economist Philip Lane due to rising energy costs and inflation concerns, is a major factor. Lane indicated that the Iran-related oil shock might necessitate ECB tightening. This points to a potentially hawkish stance from the ECB, which could bolster the Euro.
Conversely, the US is also facing inflation surges, with Producer Price Index (PPI) jumping 6.0% year-over-year in April. This persistent inflation could derail rate cut expectations from the Federal Reserve, and some even suggest the Fed might consider hiking rates again. Such a move would significantly strengthen the USD, putting downward pressure on EURUSD. The conflicting pressures – a potentially hawkish ECB versus a potentially hawkish Fed – are creating a deadlock. Traders are caught between the possibility of Euro strength and Dollar strength, leading to the current consolidation around $1.17. The market is essentially waiting for clearer signals from these central banks and upcoming economic data, such as GDP figures and employment reports, to dictate the next directional move.
Geopolitical Ripples: Energy Prices and Risk Appetite
The geopolitical landscape is adding another layer of complexity. Rising crude oil prices, fueled by a plummeting US inventory and worsening Strait of Hormuz disruptions, are a significant concern for inflation globally. Brent crude is currently trading at $107.14, showing a bearish 1H and 4H trend but a neutral 1D outlook. WTI is at $99.80, also showing bearish short-term trends. Higher energy prices typically translate to higher inflation, which, as mentioned, could push central banks towards tighter monetary policy. For the Eurozone, heavily reliant on energy imports, this is a particularly sensitive issue. The ECB's consideration of a June rate hike is partly a response to these inflationary pressures.
The escalating Middle East conflict is also impacting global risk appetite. While not directly reflected in the provided data for SP500 and Nasdaq, news reports indicate that such conflicts can lead to supply chain fears and volatility. A decline in risk appetite usually benefits safe-haven assets like the US dollar and gold. However, the current market data shows SP500 at 6572.87 and Nasdaq at 29456.52, both with bullish trends on shorter timeframes, suggesting risk appetite is currently elevated, or at least not significantly dampened. This mixed picture adds to the EURUSD uncertainty. If risk aversion were to set in, we might see a stronger DXY and potentially a weaker EURUSD, but for now, the equity markets seem to be holding firm.
Trade Scenarios: Where Could EURUSD Go?
Given the current technical indecision, mixed signals across timeframes, and conflicting macroeconomic pressures, several scenarios are plausible for EURUSD. The $1.17 level is acting as a pivot point, with immediate support at $1.17039 and resistance at $1.17118 on the 1-hour chart. On the daily chart, support is more robust at $1.16886, and resistance is eyed at $1.17348. The direction will likely depend on which of the conflicting central bank narratives gains more traction or if a significant geopolitical event shifts market sentiment.
Bearish Scenario: Dollar Strength Prevails
60% ProbabilityNeutral Scenario: Range-Bound Consolidation
25% ProbabilityBullish Scenario: Euro Strength Emerges
15% ProbabilityThe Path Forward: What Traders Should Watch
For short-term traders, the $1.17039 support and $1.17118 resistance on the 1-hour chart are the immediate battlegrounds. A break below $1.17000, especially if coupled with dollar strength, could initiate a move towards the $1.16886 daily support. Conversely, a decisive break above $1.17118, possibly fueled by positive Eurozone economic news or a less hawkish Fed stance, could target the $1.17348 resistance. The ADX readings across timeframes suggest that if a breakout occurs, it could be significant, but the current weak trend signals mean we might see more chop before a clear move.
Longer-term, the narrative is heavily influenced by central bank policy. If the ECB indeed adopts a hawkish tone for June while the Fed signals a pause or even rate cuts, EURUSD could find sustained upward momentum. However, the current inflation data in the US suggests the Fed might be forced to remain tight, or even hike, which would cap any significant Euro gains. The $1.16886 support level is critical; a break below this could open up a much larger downside move towards $1.16424. On the upside, breaking convincingly above $1.17348 would be the first step towards testing higher resistance levels like $1.17610 and $1.17810. For now, patience appears to be the best strategy, waiting for clearer directional signals.
Frequently Asked Questions: EURUSD Analysis
What happens if EURUSD breaks below the $1.16886 support level?
A sustained break below the $1.16886 daily support level would invalidate the neutral outlook and signal a stronger bearish trend. This could lead to further downside pressure, potentially targeting the next support at $1.16424. Confirmation would require a clear candle close below this key level on the daily chart, especially if accompanied by dollar strength.
Should I trade EURUSD at current levels around $1.17033 given the mixed signals?
Trading EURUSD at current levels of $1.17033 is risky due to the mixed technical signals and central bank uncertainty. A high-probability setup would require waiting for a clear break above $1.17348 resistance or a decisive fall below $1.16886 support. For now, a 'wait-and-see' approach is advisable.
Is the RSI at 49.12 a sell signal for EURUSD on the daily chart?
An RSI reading of 49.12 is considered neutral, sitting just below the 50 mark, indicating a slight downward momentum but not a definitive sell signal. While it leans bearish, it needs confirmation from other indicators and price action, such as a break below key support levels, to be considered a strong sell signal.
How will the potential ECB rate hike affect EURUSD this week?
A hawkish stance from the ECB, signaling a potential June rate hike, could strengthen the Euro and push EURUSD higher, especially if the Fed maintains a dovish tone. However, if US inflation remains high and forces the Fed to signal further tightening, the dollar's strength could overwhelm any Euro gains, capping upside potential for EURUSD.
The EURUSD pair is currently navigating a critical juncture, caught between conflicting central bank policies and mixed technical signals. While the $1.17 level holds as a psychological pivot, the surrounding support at $1.16886 and resistance at $1.17348 are the key levels to watch. The market is clearly in a wait-and-see mode, and significant directional moves are unlikely until clearer fundamental catalysts emerge. Traders should remain disciplined, manage risk prudently, and wait for a decisive break from this consolidation phase. Patience is key; the market always provides another opportunity.
Track markets in real-time
AI-powered analysis, technical indicators and real-time price data.
Join Our Telegram Channel
Breaking market news, AI analysis and trading signals instantly.
Join Channel