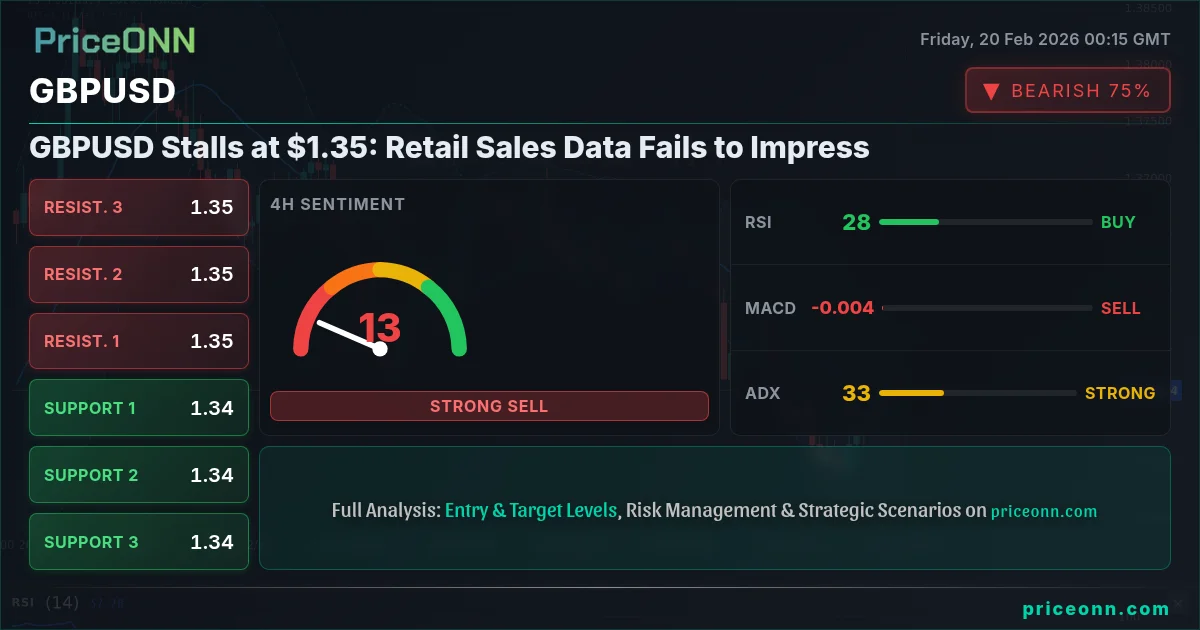
GBPUSD is currently trading at $1.35 following disappointing retail sales data, leaving traders questioning the next move.
Recent economic data has shown a lackluster performance, putting pressure on the British pound. With the latest retail sales figures failing to meet expectations, the market sentiment has turned cautious. As we dive deeper into the technicals, let’s explore the key support and resistance levels that traders should be aware of.
The retail sales data released recently did not impress, contributing to the current bearish sentiment in GBPUSD.
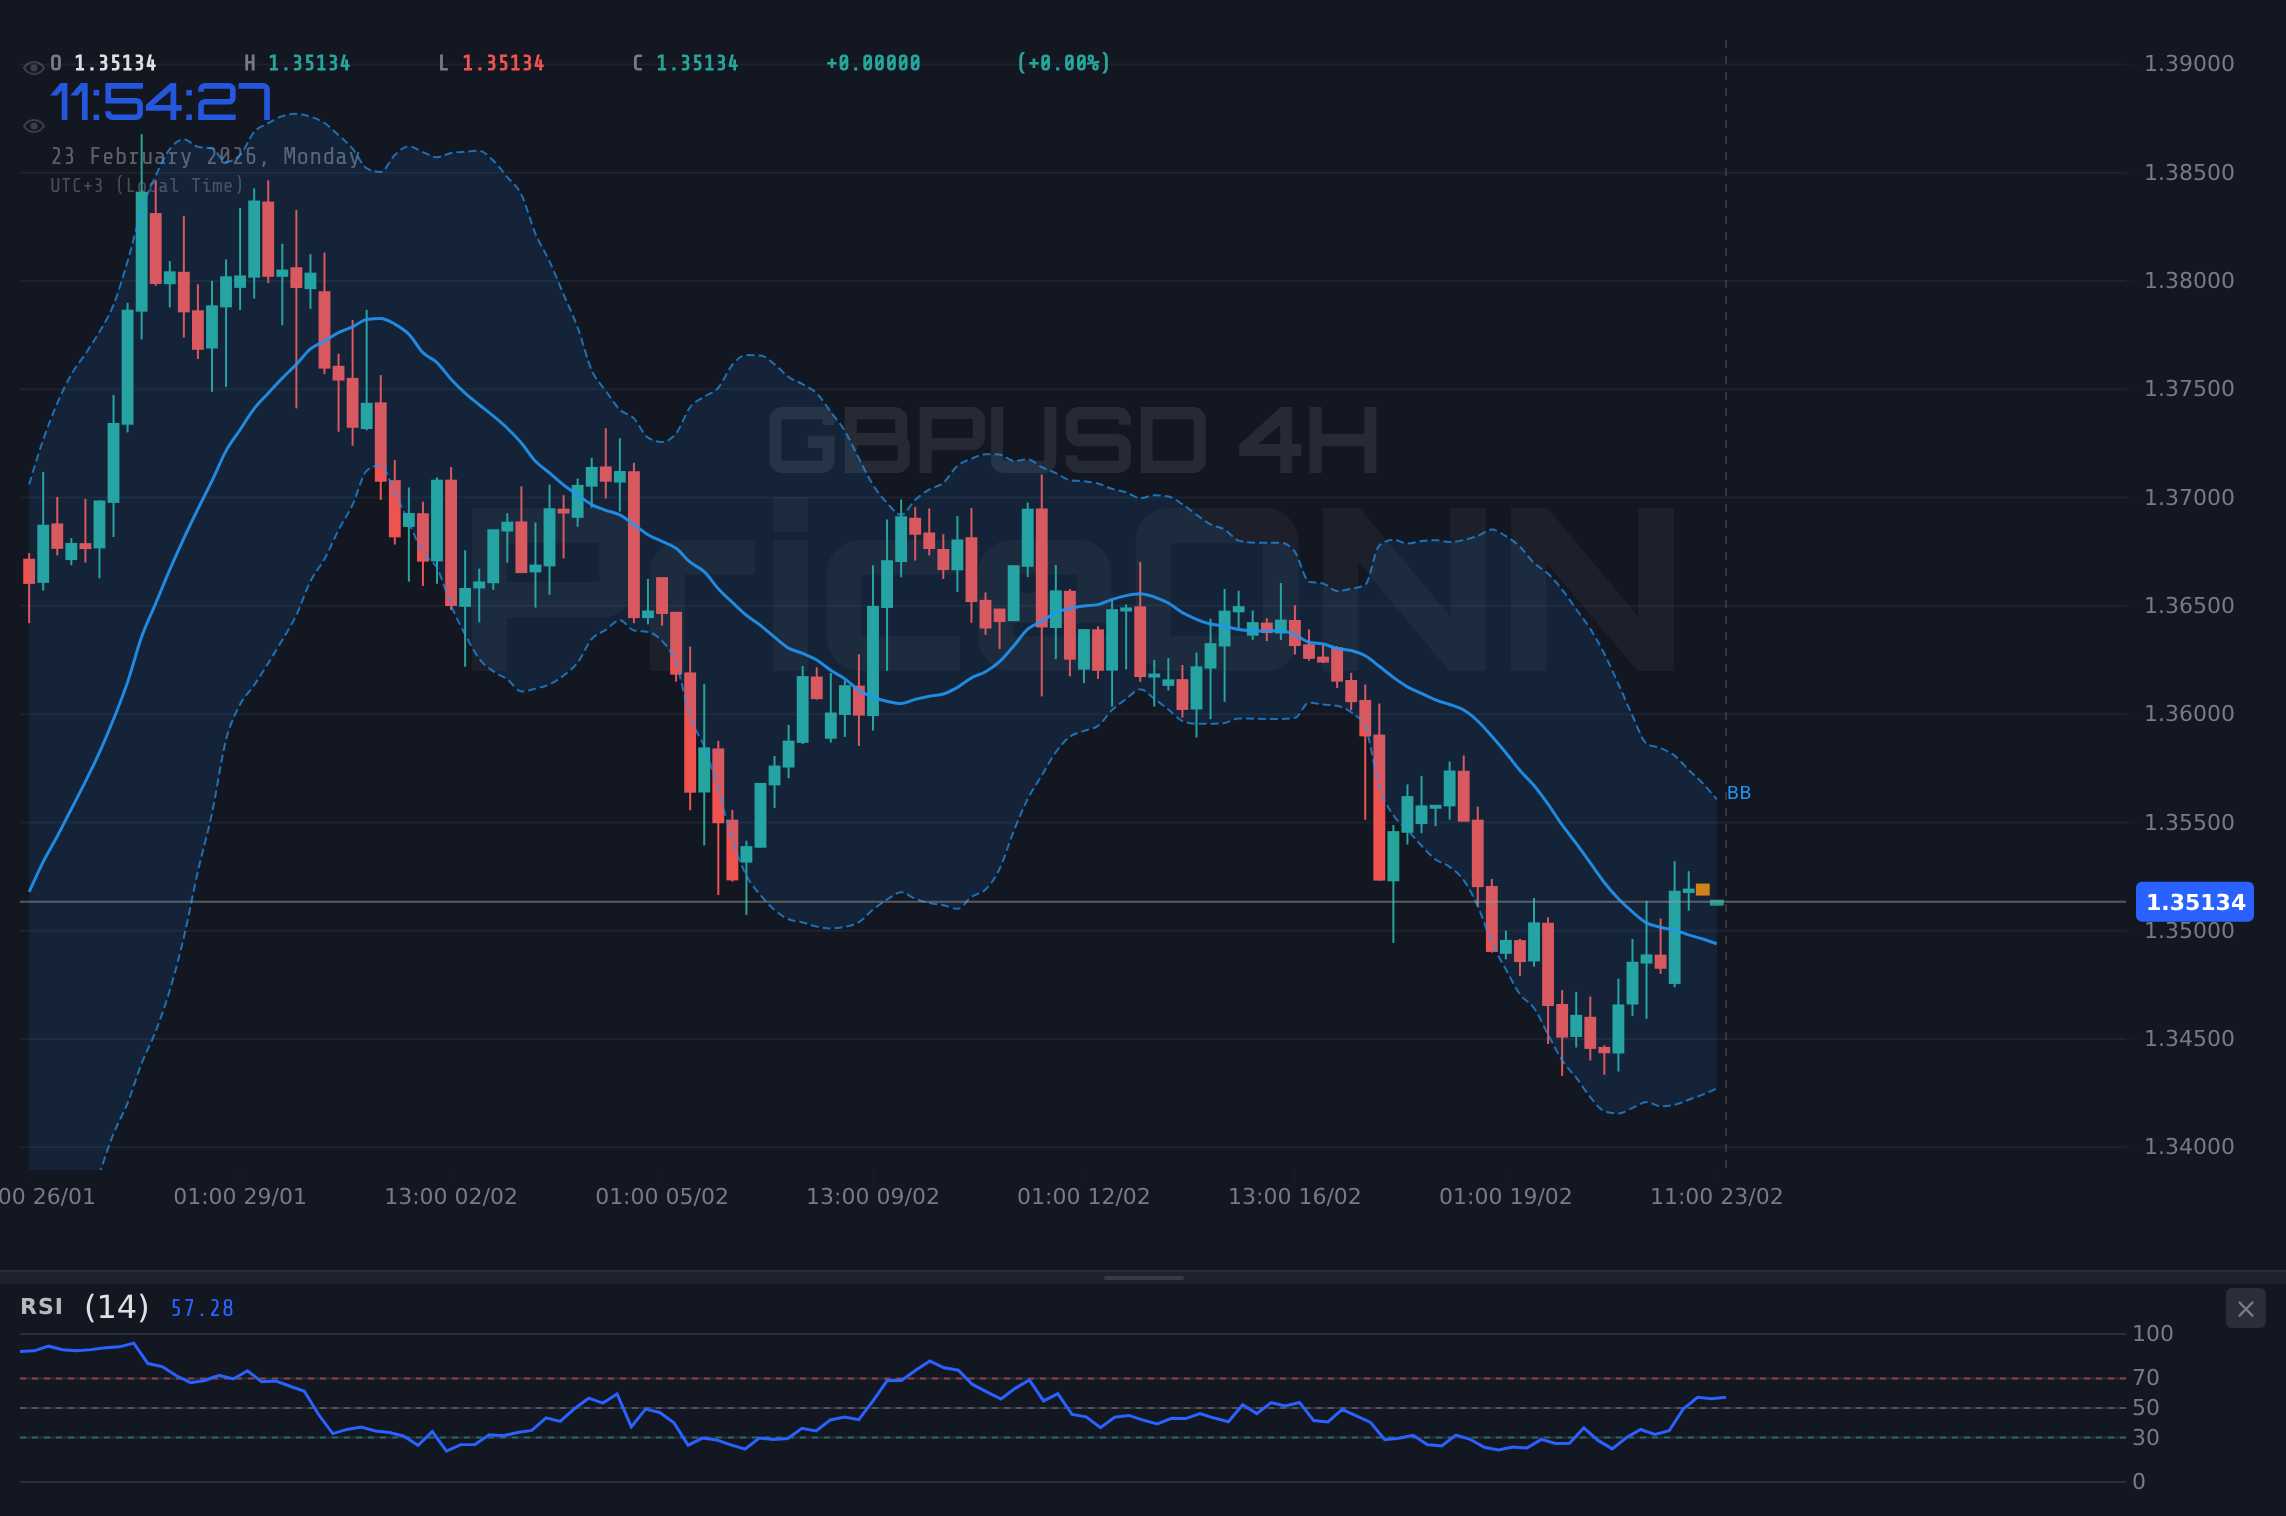
Technical Analysis
GBPUSD is now encountering significant technical levels. The current price of $1.35 is crucial as the market tests its resilience amidst economic uncertainties.
Trade Plan
Scenario A: Trend Continuation (Primary)
- Direction: Short
- Entry Trigger: H4 close below $1.3450
- Target 1: $1.3400 (~50 pips)
- Target 2: $1.3350 (~100 pips)
- Stop / Invalidation: H4 close above $1.3520
Scenario B: Pullback / Reversal (Alternative)
- Condition: $1.3450 support holds + RSI divergence
- Entry Trigger: H4 close above $1.3500 + volume increase
- Target: $1.3600 zone
- Invalidation: Close below $1.3400
News Risk: Volatility may increase ahead of the upcoming UK inflation data. Consider reducing position size.
Indicator Analysis
Indicator Note: RSI at 39.75 indicates oversold conditions, but ADX at 32.64 confirms a strong downtrend. Wait for RSI to climb above 40 before considering a bounce trade.
Support and Resistance Levels
Market Outlook
The outlook for GBPUSD remains uncertain as traders await more economic signals. The market's ability to hold above support levels will be crucial in determining the next move.
Technical Summary
| Indicator | Value | Signal | Interpretation |
|---|---|---|---|
| RSI (14) | 39.75 | Bearish | Approaching oversold |
| MACD | -0.0015 | Bearish | Below signal line |
| ADX | 32.64 | Strong Trend | Indicates strong downtrend |
Track markets in real-time
AI-powered analysis, technical indicators and real-time price data.
Join Our Telegram Channel
Breaking market news, AI analysis and trading signals instantly.
Join Channel