

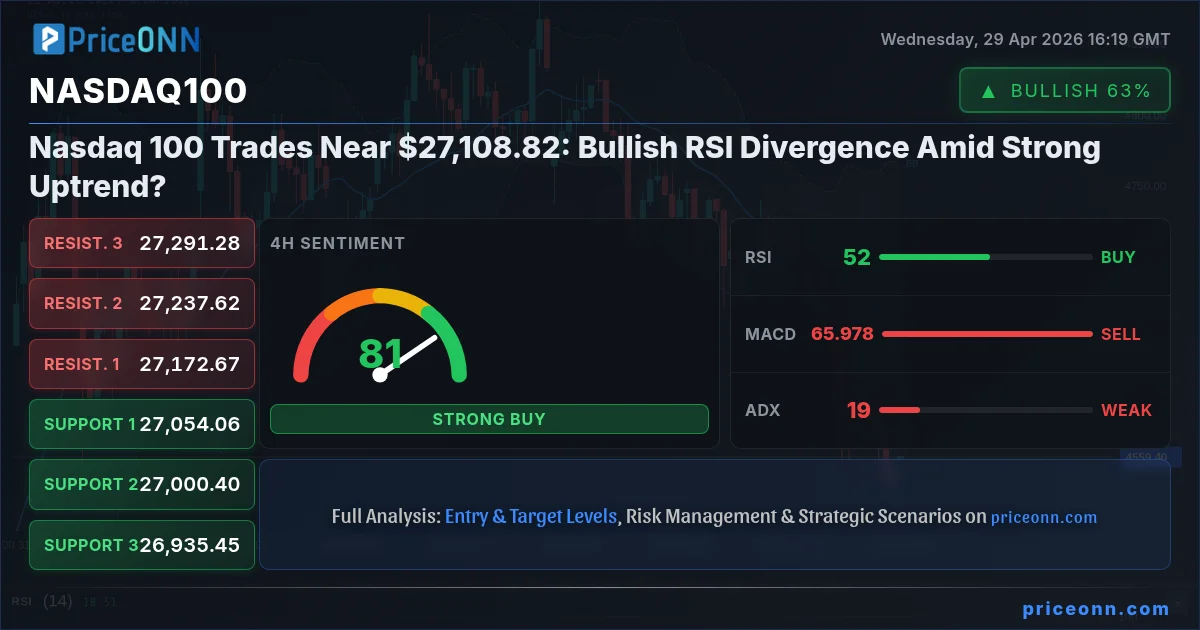
The Nasdaq 100, a barometer for tech-heavy growth, is currently finding itself at a critical juncture, trading near the $27,108.82 mark. This level, while not an immediate resistance from the data, represents a significant point where market participants are assessing the sustainability of the recent rally. The index has shown remarkable resilience, climbing higher even as some indicators flash cautionary signals. A key aspect of this market dynamic is the interplay between the persistent strength in the uptrend and the divergence starting to appear in momentum oscillators. Understanding this tension is paramount for navigating the choppy waters ahead.
- The Nasdaq 100 is trading near $27,108.82, showing a strong uptrend on daily charts with ADX at 31.82.
- RSI(14) at 71.07 on the daily chart signals overbought conditions, potentially indicating a need for consolidation or a pullback.
- The 1H chart shows negative momentum from MACD and a Stochastic crossover, suggesting short-term caution despite the broader bullish trend.
- Correlation analysis reveals DXY strength (98.56) and rising oil prices (Brent $116.47, WTI $108.26) add to the complex macroeconomic backdrop.
The Nasdaq 100's Ascent: A Technical Deep Dive
Navigating the Uptrend: Daily Chart Dynamics
On the daily timeframe, the Nasdaq 100 (NDX) presents a compelling picture of strength, currently valued at $27,108.82. The ADX indicator stands at a robust 31.82, confirming a strong prevailing trend. This suggests that the underlying momentum driving the index higher is significant and has been sustained over a period. The MACD also shows positive momentum, with its histogram above the signal line, reinforcing the bullish narrative. Furthermore, the Stochastic Oscillator on the daily chart, with K at 89.31 and D at 82.02, is firmly in overbought territory, indicating that the index has experienced a rapid price increase. This has been further supported by the price trading above the middle Bollinger Band, a classic sign of an ongoing uptrend. The general signal for the NDX on the daily chart is 'Buy' (5 Buy, 2 Sell, 0 Neutral), underscoring the dominant bullish sentiment from a longer-term perspective. This sustained upward trajectory is a testament to strong market participation and potential inflows into growth-oriented assets.
However, the bullish picture is not without its nuances. While the daily chart screams 'uptrend', the RSI(14) reading of 71.07 is a clear signal of overbought conditions. This doesn't necessarily mean an immediate reversal, but it does suggest that the market might be due for a period of consolidation or a healthy correction to digest the recent gains. Overbought RSI levels can persist in strong trends, but they also increase the probability of a pullback or a period of sideways movement as buyers pause and sellers find opportunities to enter the market.
Intraday Weakness: 1-Hour and 4-Hour Chart Signals
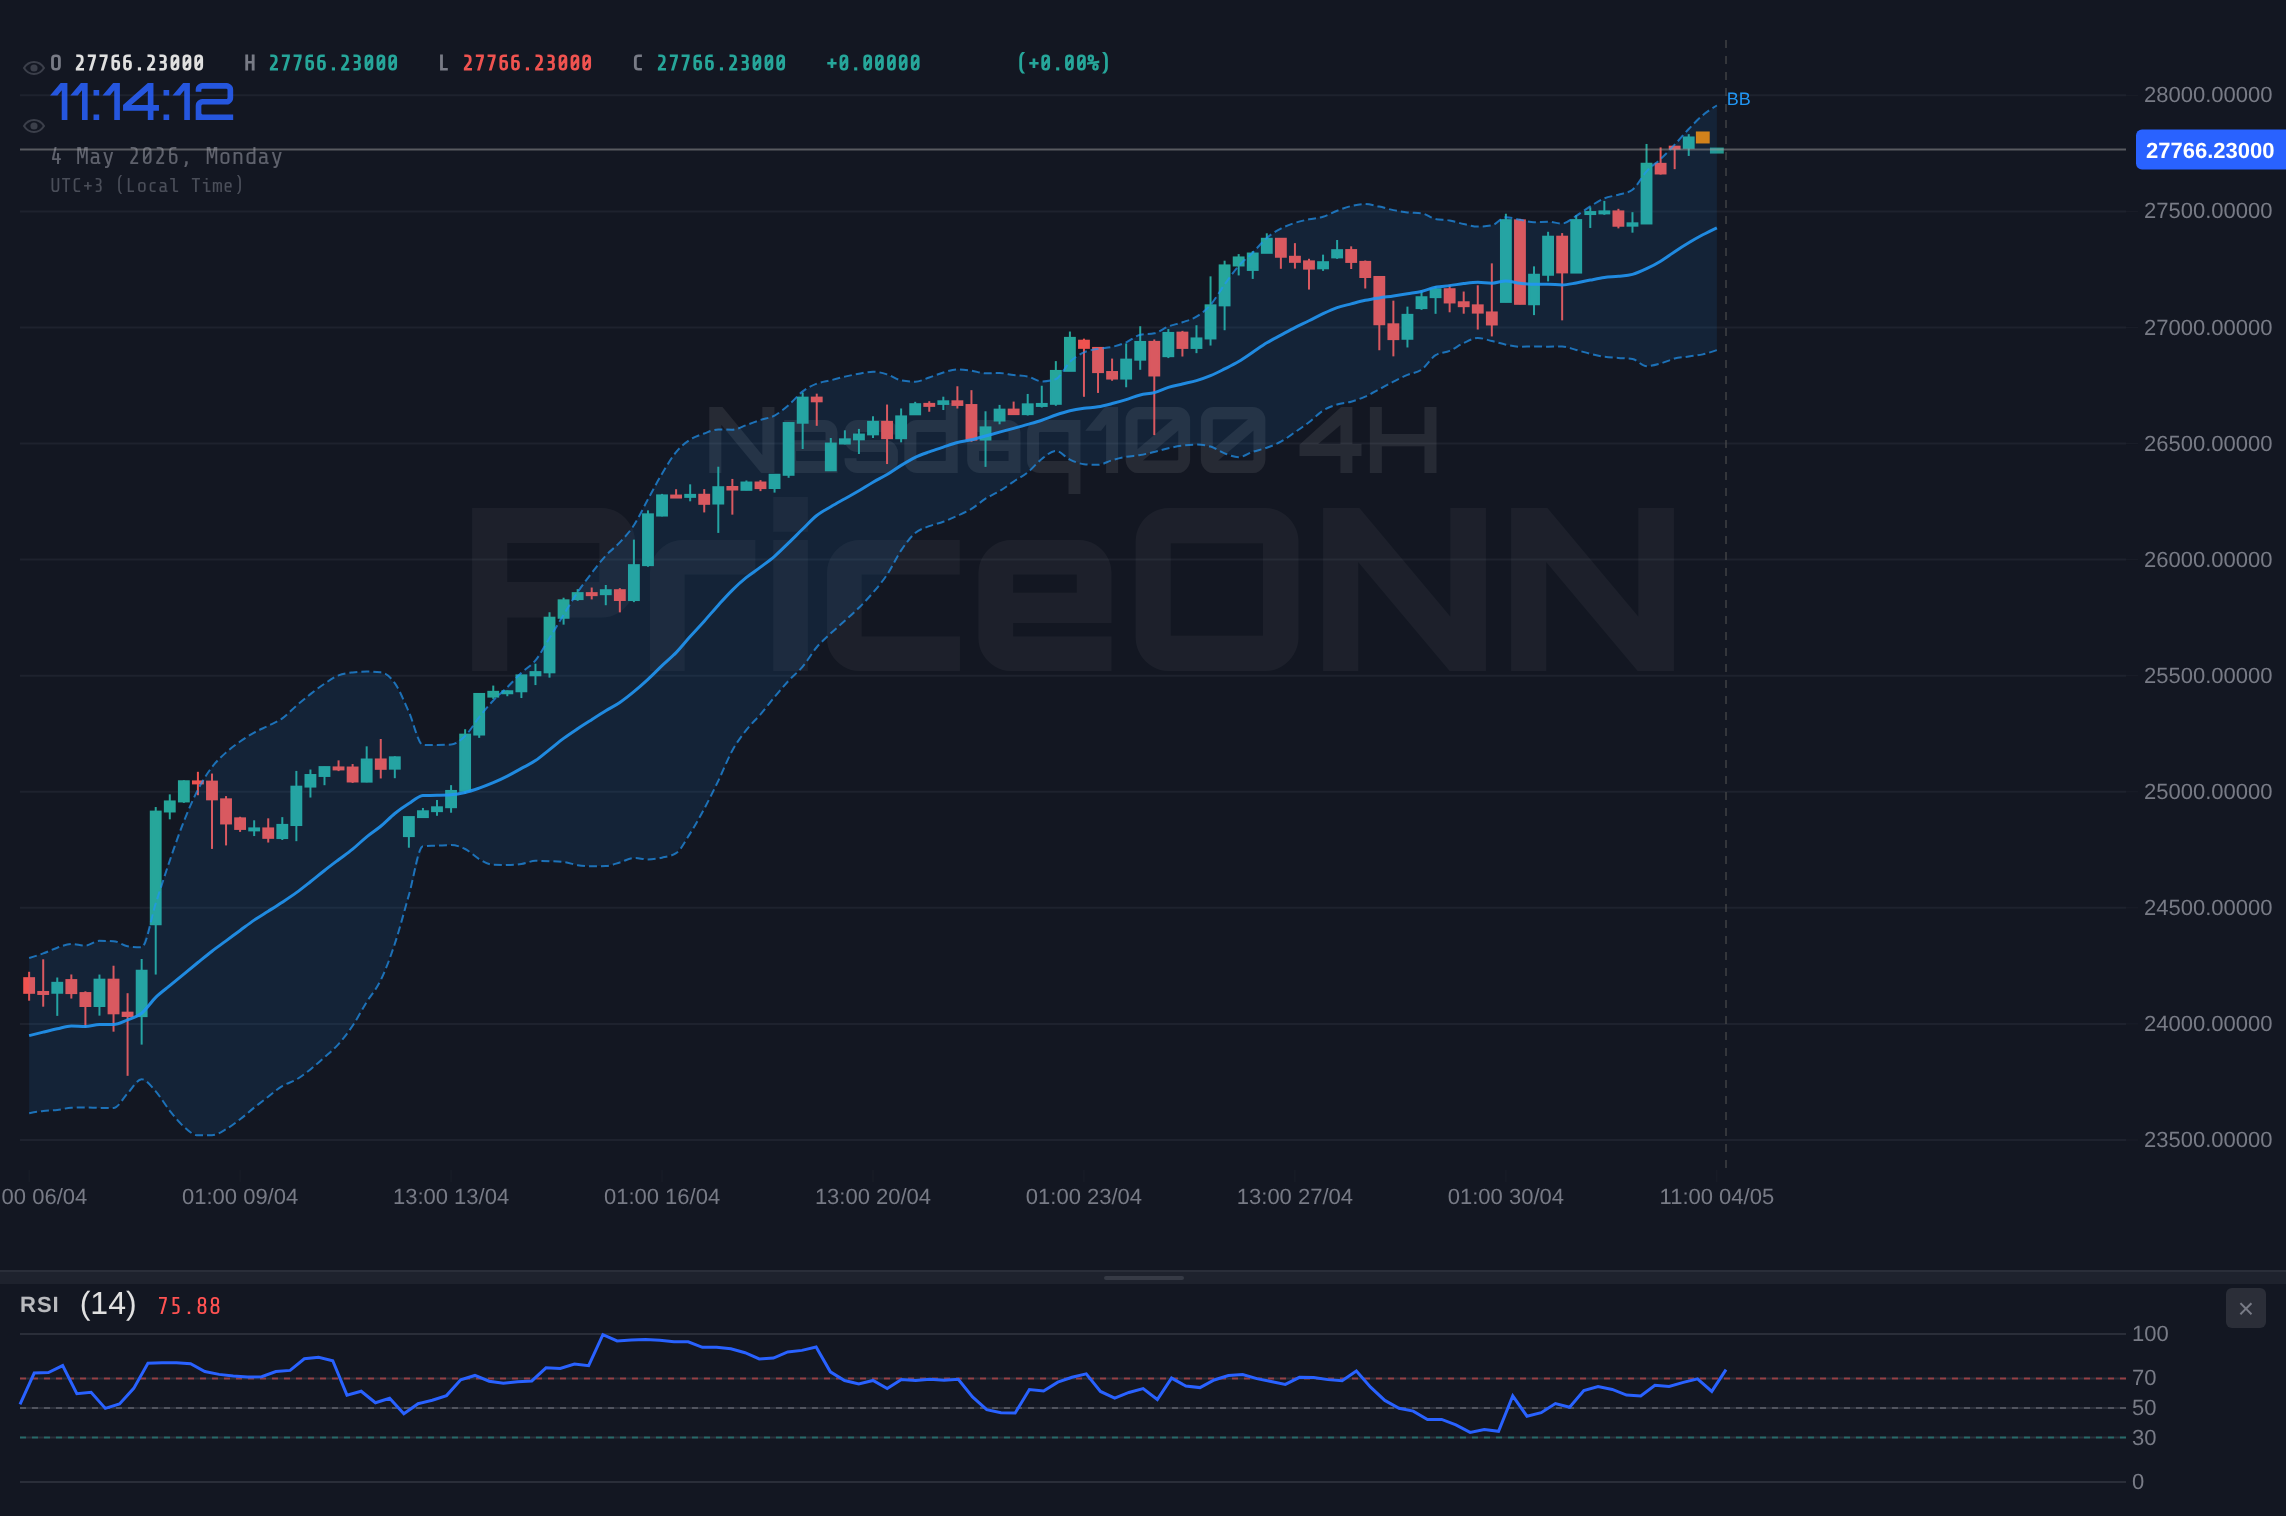
Shifting our focus to shorter timeframes, the narrative becomes more complex. On the 1-hour chart, the Nasdaq 100 exhibits a different personality. The trend is technically identified as 'Düşüş' (Down) with a strength of 82%, a stark contrast to the daily view. This immediate bearish signal is corroborated by a negative MACD histogram, indicating that bearish momentum is currently in play on this timeframe. The Stochastic Oscillator's K value (68.04) is above the D value (48.28), suggesting a potential for upward movement, but this is overshadowed by the negative MACD and the RSI(14) at 48.6, which sits in neutral territory but leans towards a bearish inclination. The ADX on this timeframe is a mere 14.73, signifying a weak trend, which implies choppy, range-bound conditions rather than a clear directional move. The general signal on the 1H chart is 'Sat' (Sell) with 3 Buy, 5 Sell, and 0 Neutral, highlighting the intraday selling pressure.
The 4-hour chart offers a middle ground, with a 'Nötr' (Neutral) trend strength of 50%. Here, the RSI(14) is at 53.1, indicating a balanced market sentiment leaning slightly bullish. The MACD shows negative momentum, though, which contradicts the slightly more optimistic RSI. The Stochastic Oscillator, with K at 51.08 and D at 38.05, is showing a bullish signal, suggesting potential upside. However, the ADX at 19.13 still points to a weak trend. The overall signal on the 4H is 'Al' (Buy) with 5 Buy, 3 Sell, and 0 Neutral. This mixed picture across intraday timeframes suggests that while the longer-term trend remains bullish, short-term traders might be facing headwinds and require more confirmation before committing to new positions.
Intermarket Analysis: The Broader Economic Landscape
The Dollar's Influence: DXY and its Ripple Effect
The Dollar Index (DXY) is currently trading at 98.56, showing a slight uptick of 0.08% on the day. This strengthening dollar is a critical factor influencing global markets, particularly commodities and major forex pairs. With the DXY at 98.56, we observe a strong uptrend on its 1-hour and 4-hour charts, supported by ADX values of 35.77 and 20.57 respectively. The daily chart shows a more neutral trend (ADX 21), but the overall positive momentum indicated by MACD and Stochastic suggests that the dollar is finding support. A stronger dollar typically puts downward pressure on assets priced in dollars, such as gold and silver, and can also weigh on currency pairs like EUR/USD and GBP/USD. For the Nasdaq 100, the relationship is often inverse; a strong dollar can sometimes signal risk-off sentiment, potentially leading investors to shift away from growth stocks towards safer assets. However, in periods of strong global growth, the dollar can strengthen alongside risk assets, making this correlation complex and highly dependent on underlying economic drivers.
The current DXY strength, though modest, is enough to warrant attention. It suggests that global investors might be seeking the perceived safety and yield of the US dollar, which could temper the appetite for riskier assets like tech stocks. This DXY movement, coupled with the fact that the Nasdaq 100 is showing signs of overbought conditions on daily charts, paints a picture where a short-term correction in the index is plausible. The dollar's continued strength could be a key catalyst for such a move, as it makes US equities relatively more expensive for international buyers and can signal tighter global liquidity conditions.
Commodities and Inflation: Oil's Price Surge
The energy markets are currently ablaze, with Brent Crude Oil trading at $116.47 and WTI Crude Oil at $108.26. Both benchmarks have experienced significant gains, with WTI showing a remarkable 6.86% increase and Brent up 5.95% on the day. These sharp rises are indicative of strong bullish momentum, with ADX values on daily charts supporting this trend (Brent: 25.41, WTI: 25.95). The RSI readings for both are in the overbought territory (Brent: 66.17, WTI: 63.25), suggesting that while the trend is strongly upwards, the pace of gains might be unsustainable in the very short term without consolidation. This surge in oil prices has significant implications for inflation expectations globally. Higher energy costs directly translate into increased transportation and production costs for businesses, which can then be passed on to consumers, fueling inflationary pressures.
The correlation between rising oil prices and inflation is well-established. As energy costs climb, the overall cost of living and doing business increases, prompting central banks to potentially adopt more hawkish monetary policies. This, in turn, can impact interest rate expectations and affect the valuation of growth stocks like those in the Nasdaq 100. If the Federal Reserve feels compelled to tighten policy more aggressively due to oil-driven inflation, it could create headwinds for the tech sector. Therefore, the persistent strength in oil prices is not just a commodity market story; it's a significant macro-economic factor that could influence the Nasdaq 100's future trajectory. The current environment suggests a delicate balancing act for policymakers: taming inflation without stifling economic growth.
Equity Market Correlations: SP500 and Nasdaq100 Dynamics
The S&P 500 (SP500) is currently trading at 6572.87, up 0.74% for the day, while the Nasdaq 100 is showing a more modest 0.2% gain to 27108.82. The S&P 500's daily chart indicates a strong downtrend with an ADX of 47.51, despite its intraday gains. This suggests that the broader market, represented by the S&P 500, is facing significant selling pressure, even if pockets of strength emerge. The Nasdaq 100, on the other hand, shows a strong daily uptrend (ADX 31.82) and a daily RSI of 71.07, indicating it's in overbought territory. This divergence between the broader market and the tech-heavy Nasdaq 100 is noteworthy. Typically, the Nasdaq 100 tends to move in tandem with the S&P 500, reflecting overall market sentiment. However, when the Nasdaq 100 shows more resilience or even outperforms during periods of broader market weakness, it can signal a 'flight to quality' within equities, where investors favor the perceived stability and growth potential of mega-cap tech companies over the wider market.
The fact that the S&P 500 is in a daily downtrend while the Nasdaq 100 is in a daily uptrend (albeit with overbought daily RSI) creates an interesting dichotomy. This could suggest that market leadership is narrowing, concentrating in a few large-cap tech names that are driving the Nasdaq 100 higher, while the rest of the market struggles. This concentration risk is something investors need to monitor closely. If the broader economic concerns that are weighing on the S&P 500 begin to impact the underlying fundamentals of these mega-cap tech companies, the Nasdaq 100's rally could be vulnerable. The current intraday signals on the Nasdaq 100, particularly the negative MACD and Stochastic crossover on the 1-hour chart, hint at this potential vulnerability, suggesting that the rally might be losing steam.
Fundamental Drivers and Geopolitical Undercurrents
Central Bank Watch: Fed's Tightrope Walk
The current market environment is heavily influenced by expectations surrounding central bank policies, particularly the US Federal Reserve. While the provided economic calendar doesn't detail specific upcoming Fed events or recent data releases like CPI or NFP, market sentiment often hinges on forward guidance and the perceived path of interest rates. The DXY's current strength at 98.56, along with the robust trend indicators, suggests that the market may be pricing in a relatively hawkish stance from the Fed or at least a reluctance to cut rates prematurely. The fact that the Nasdaq 100 is showing overbought daily RSI (71.07) while the S&P 500 is in a daily downtrend could indicate that investors are becoming increasingly selective, favoring companies with strong balance sheets and consistent earnings, often found within the Nasdaq 100's largest constituents.
If inflation concerns, particularly those exacerbated by rising oil prices, lead to a perception that the Fed might need to maintain higher rates for longer, it could create a headwind for growth stocks. Higher interest rates increase the cost of capital for companies, reduce the present value of future earnings (a key valuation metric for tech stocks), and make safer assets like bonds more attractive. The current 'Buy' signals on the daily Nasdaq 100 are strong, but the overbought RSI and the conflicting intraday signals suggest that this bullish thesis is sensitive to shifts in monetary policy expectations. Traders will be keenly watching any hints from Fed officials or upcoming economic data that could sway the rate outlook. For instance, if upcoming employment figures were to show surprising strength, it might reinforce expectations of a hawkish Fed, potentially leading to a reassessment of Nasdaq 100 valuations.
Geopolitical Tensions and Risk Sentiment
Geopolitical developments continue to cast a long shadow over financial markets, influencing risk appetite and driving flows into safe-haven assets. While specific geopolitical events are not detailed in the provided data, the general context of global uncertainty often plays a crucial role. Rising oil prices, as seen with Brent and WTI crude, can sometimes be linked to geopolitical instability in energy-producing regions. This, in turn, can dampen overall market sentiment. When geopolitical risks escalate, investors tend to move away from riskier assets like equities, particularly growth stocks in the Nasdaq 100, and seek refuge in assets like gold, US Treasuries, or even the US dollar itself (as indicated by the current DXY strength). The divergence between the Nasdaq 100's strong uptrend and the S&P 500's daily downtrend might also reflect a market grappling with these risks, with investors perhaps consolidating their exposure into perceived 'safer' large-cap tech names.
The correlation between risk sentiment and the Nasdaq 100 is undeniable. A 'risk-on' environment typically fuels rallies in growth stocks, while a 'risk-off' environment can lead to sharp sell-offs. The current mixed signals - a strong daily uptrend for the NDX versus bearish intraday indicators and a struggling S&P 500 - suggest a market on edge. The resilience shown by the Nasdaq 100 around the $27,108.82 level could be interpreted in multiple ways: either as a sign of underlying strength and conviction in the tech sector, or as a temporary pause before a potential reassessment of risks. Any escalation in geopolitical tensions could quickly shift the market's sentiment, leading to a re-evaluation of the current bullish stance on the Nasdaq 100.
Trading Scenarios and Forward-Looking Insights
The Bullish Case: Sustaining the Momentum
For the bulls to maintain control, the Nasdaq 100 needs to consolidate or push through the immediate selling pressure indicated by the 1-hour and 4-hour charts. The primary trigger for a continuation of the bullish trend would be holding the current price levels, ideally finding support around the $27,083.15 mark. A decisive close above the 1-hour resistance at $27,218.88 would signal that the intraday weakness is being overcome. If this breakout occurs, the next logical target would be the $27,354.61 resistance level. Further upside could see the index testing higher grounds, potentially aiming for levels not seen before in this cycle, especially if broader market sentiment remains positive and inflation concerns do not force a hawkish central bank response. The daily chart's strong uptrend and 'Buy' signals provide the underlying foundation for this scenario, suggesting that any short-term dips could be buying opportunities for longer-term investors.
Bullish Scenario: Consolidation and Continuation
45% ProbabilityThe Bearish Case: Overbought Signals and Risk Aversion
Conversely, the bearish scenario hinges on the overbought daily RSI (71.07) and the negative momentum observed on the shorter timeframes. If the Nasdaq 100 fails to hold the $27,083.15 support level on the 1-hour chart, it could trigger a sell-off. The immediate invalidation for this bullish thesis would be a break below the 1-hour support at $26,996.69. Should this level give way, the index could rapidly fall towards the next significant support at $26,947.42. A more substantial breakdown, potentially driven by renewed risk aversion or hawkish central bank signals, could see the Nasdaq 100 retesting the daily support levels, with the first major one identified at $26,827.56. This scenario would be amplified if the DXY continues its ascent and oil prices remain elevated, contributing to inflation fears and potentially prompting a 'risk-off' move across financial markets.
Bearish Scenario: Overbought Conditions Trigger Correction
50% ProbabilityThe Neutral Scenario: Consolidation and Wait-and-See
A neutral scenario involves the Nasdaq 100 trading within a defined range, reflecting the conflicting signals from different timeframes and the broader economic uncertainty. In this case, the index might hover around the current $27,108.82 level, potentially consolidating between the intraday support at $27,083.15 and resistance at $27,218.88. This would occur if neither the bulls nor the bears can gain decisive control, perhaps awaiting clearer signals from upcoming economic data or central bank commentary. The ADX values across timeframes (14.73 on 1H, 19.13 on 4H, 31.82 on 1D) suggest that a strong, directional trend might not be fully established across all durations, leaving room for ranging behavior. This consolidation phase would allow the RSI to cool down from its overbought daily levels, potentially setting the stage for a more sustainable move once clearer directional cues emerge.
Neutral Scenario: Range-Bound Consolidation
5% ProbabilityWhat's Next for the Nasdaq 100?
The Nasdaq 100 stands at a pivotal point, trading near $27,108.82. The daily chart paints a bullish picture with strong uptrend indicators, but the overbought RSI (71.07) and conflicting intraday signals demand caution. The persistent strength in the dollar (DXY at 98.56) and surging oil prices (Brent $116.47, WTI $108.26) add layers of complexity, potentially fueling inflation fears and influencing central bank policy expectations. The divergence with the S&P 500, which is in a daily downtrend, further highlights the selective nature of the current market rally. For traders, the key levels to watch are immediate support around $27,083.15 and resistance at $27,218.88. A decisive move above resistance could signal a continuation of the bullish trend, targeting $27,354.61 and beyond. Conversely, a break below support, especially on increasing volume and negative news flow, could initiate a correction towards $26,996.69 and potentially lower daily support levels. The market is clearly at a crossroads, and upcoming economic data, central bank commentary, and geopolitical developments will be crucial in determining the next decisive direction.
Frequently Asked Questions: Nasdaq100 Analysis
What happens if the Nasdaq 100 breaks above $27,218.88 resistance?
A decisive break above $27,218.88 on the 1-hour chart, supported by strong volume, would invalidate the short-term bearish signals. This could trigger a continuation of the bullish trend, with the next likely target being the resistance level at $27,354.61, suggesting further upside potential.
Is the daily RSI at 71.07 a sell signal for the Nasdaq 100 right now?
An RSI of 71.07 on the daily chart indicates overbought conditions, which historically suggests a potential for consolidation or a pullback. While not an immediate sell signal in a strong uptrend, it warrants caution and suggests that further significant gains might be challenging without a period of price digestion.
How will the current DXY strength at 98.56 affect the Nasdaq 100?
The strength in the Dollar Index (DXY) to 98.56 typically puts pressure on dollar-denominated assets like the Nasdaq 100. A stronger dollar can signal risk aversion or tighter liquidity, potentially leading investors to reduce exposure to growth stocks. This correlation suggests that sustained dollar strength could act as a headwind for the Nasdaq 100.
Should traders consider buying the Nasdaq 100 at current levels around $27,108.82?
Buying at current levels around $27,108.82 carries risk due to the overbought daily RSI and conflicting intraday signals. A more prudent approach might be to wait for confirmation, such as a hold of intraday support at $27,083.15 or a clear breakout above $27,218.88, before initiating new long positions.
Track markets in real-time
AI-powered analysis, technical indicators and real-time price data.
Join Our Telegram Channel
Breaking market news, AI analysis and trading signals instantly.
Join Channel