Silver (XAGUSD) is currently trading near $83.03, facing a confluence of factors including geopolitical risks and upcoming commentary from Federal Reserve officials. The metal's price action reflects a market grappling with uncertainty, as traders weigh safe-haven demand against potential headwinds from a stronger dollar and rising interest rates. The near-term outlook hinges on whether silver can maintain its footing above key support levels or succumb to renewed selling pressure.
The immediate focus for XAGUSD is the interplay between safe-haven demand stemming from geopolitical instability and the impact of a potentially hawkish Federal Reserve. Recent news highlights escalating tensions in the Middle East, as Japan's Refiners Request Strategic Oil Release Amid Middle East Tensions. Such events often trigger a flight to safety, benefiting precious metals like silver. However, the strengthening US dollar, with the DXY currently at 98.77, presents a countervailing force. Historically, a stronger dollar exerts downward pressure on silver prices, as it makes the metal more expensive for holders of other currencies.
From a technical perspective, the one-hour chart reveals a neutral trend, with the ADX at 37.67 indicating a strong downtrend. The RSI(14) is hovering around 49.89, suggesting neither overbought nor oversold conditions. The MACD histogram indicates negative momentum, further reinforcing the bearish sentiment. However, the Stochastic oscillator, with K=56.56 and D=24.73, signals a potential bullish reversal, adding a layer of complexity to the near-term outlook. Silver needs to overcome the immediate resistance at $82.36 to confirm this bullish signal.
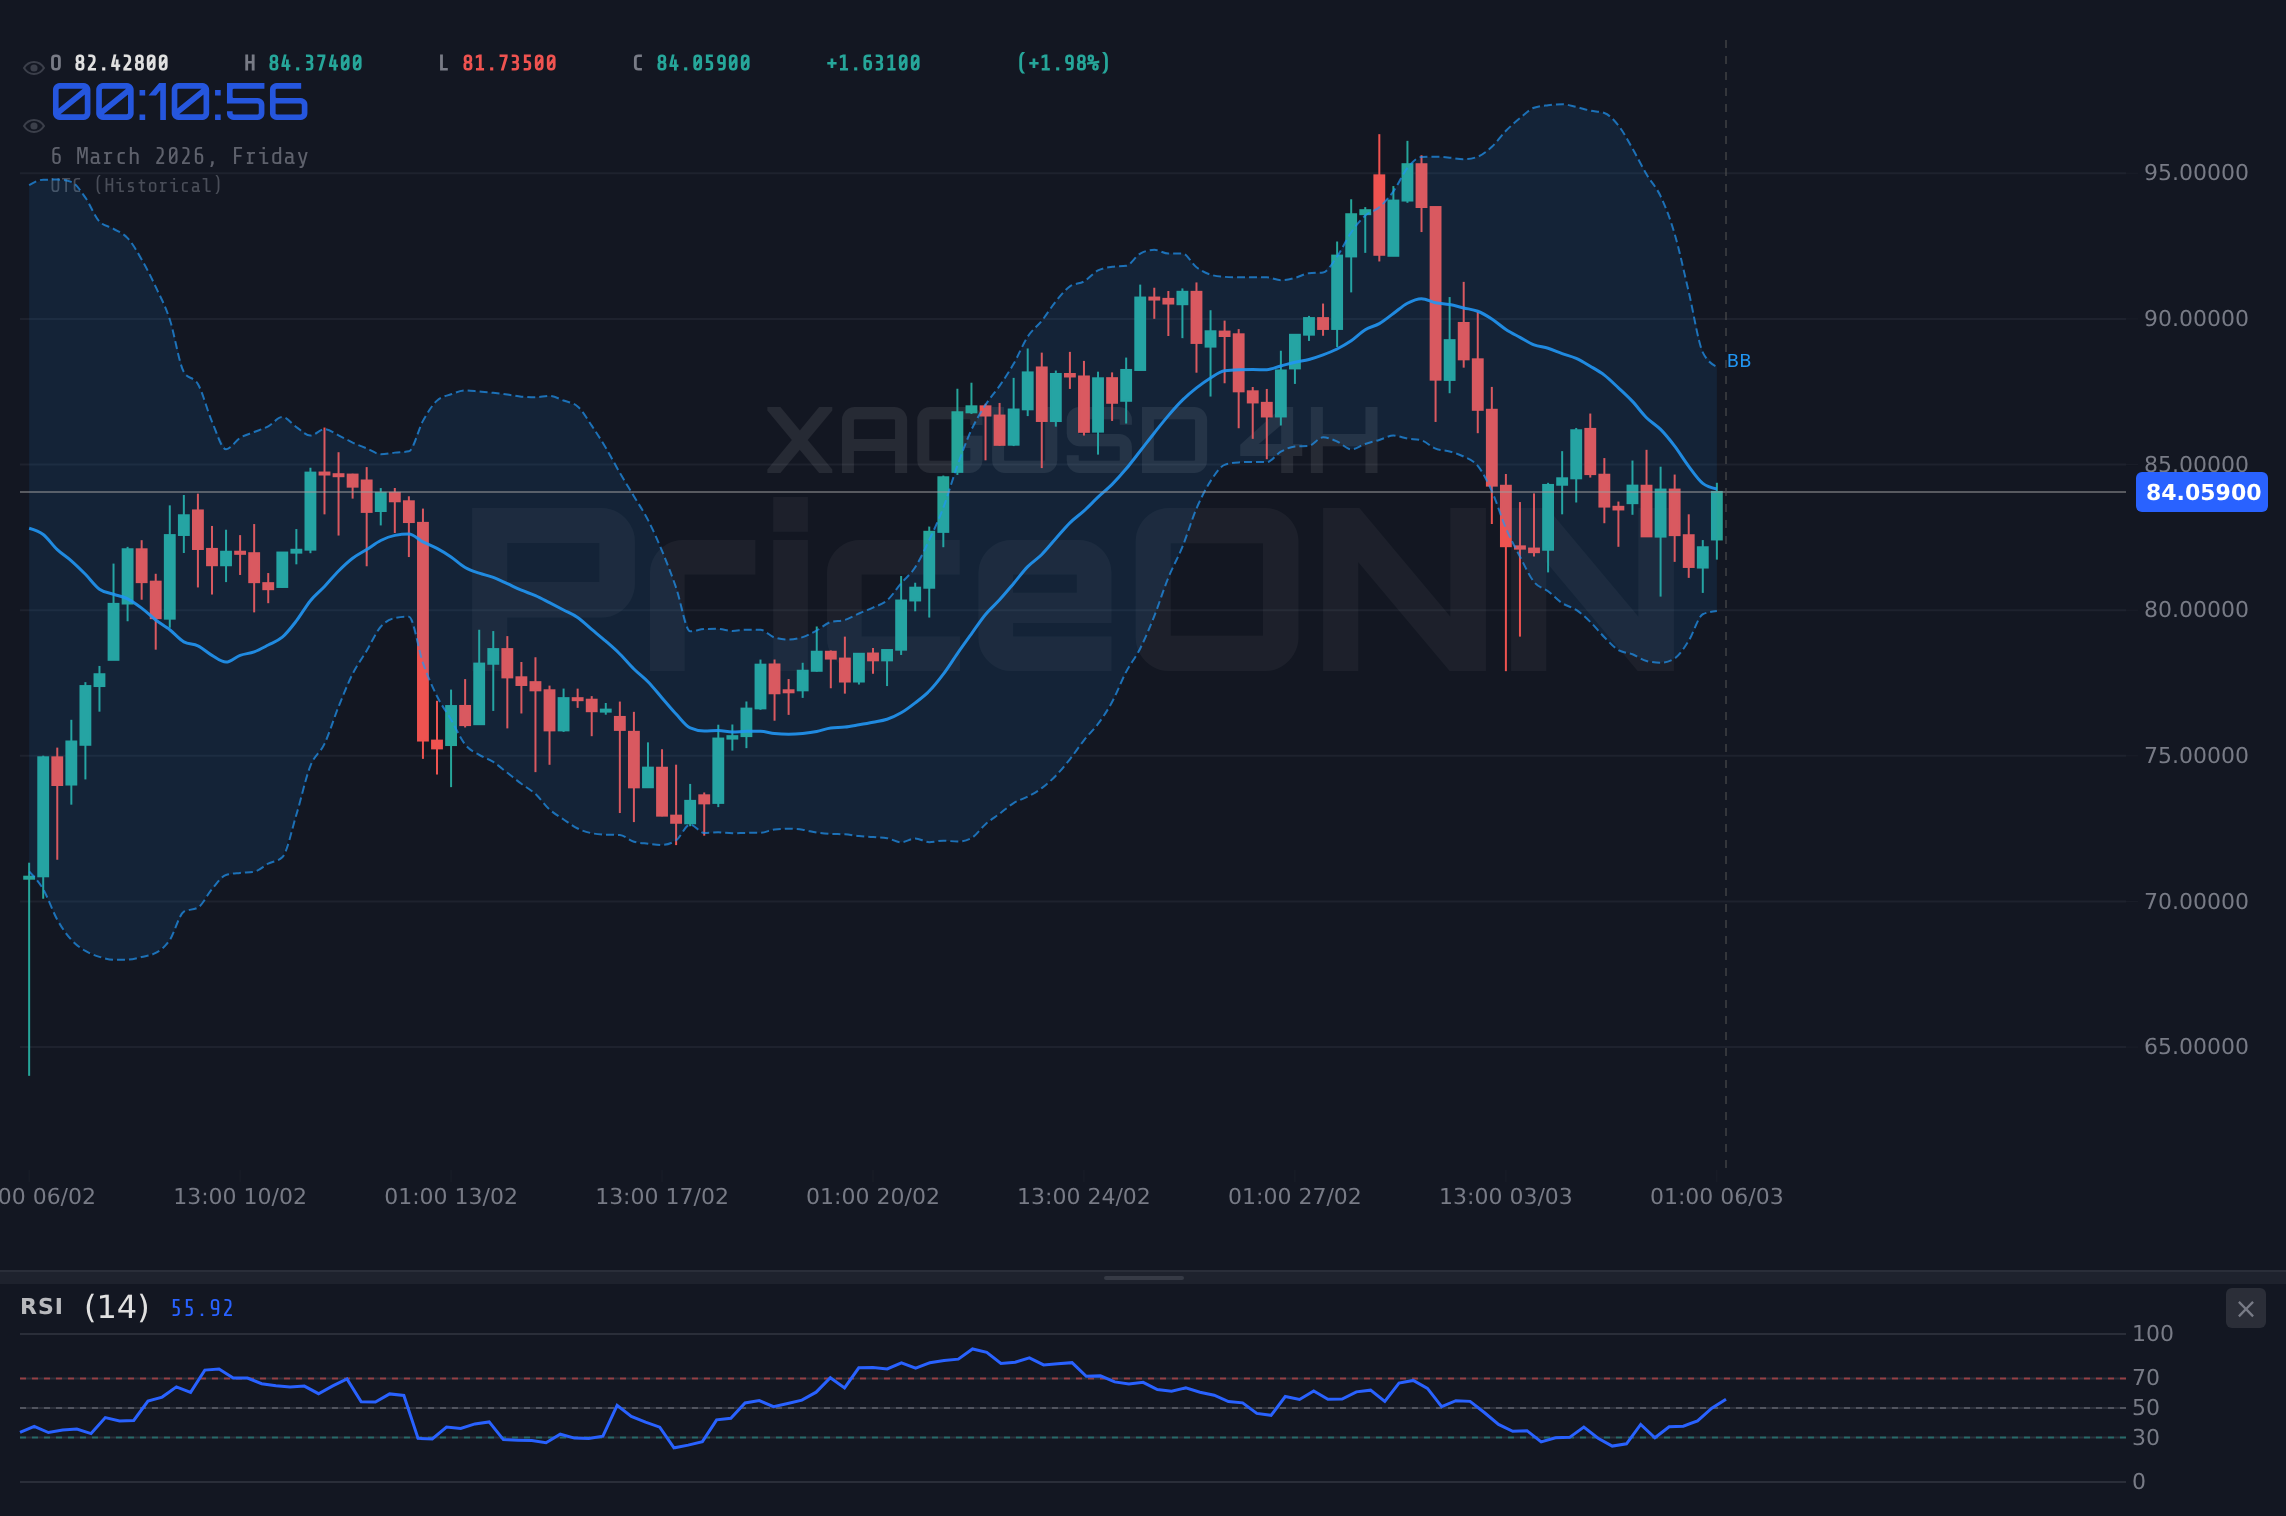
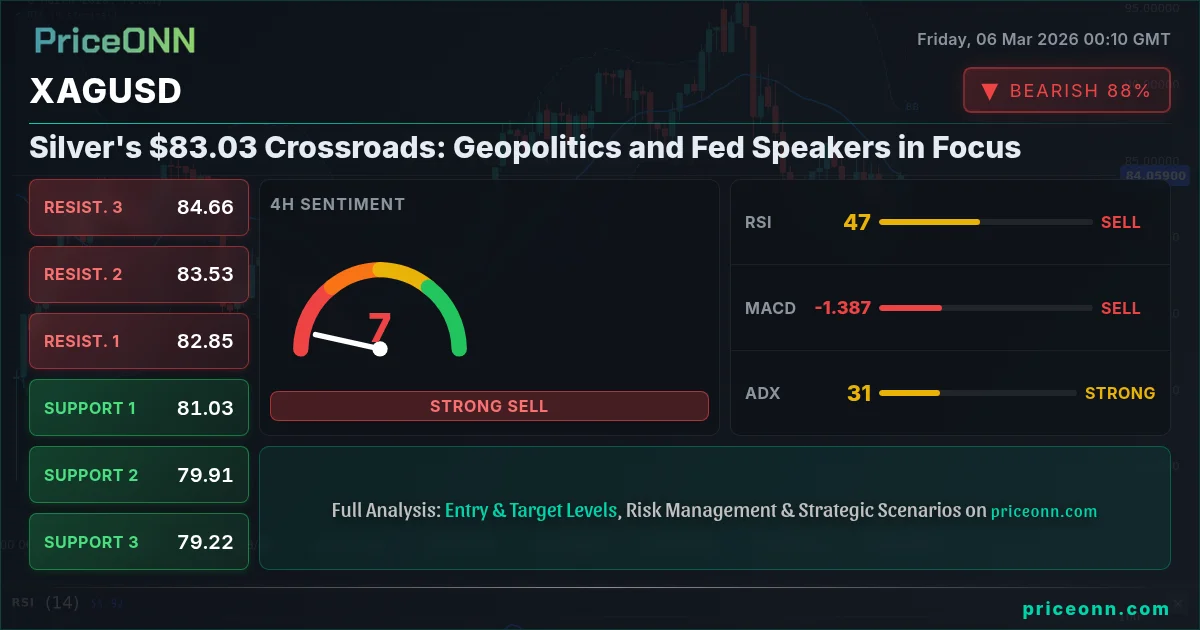
Stepping back to the four-hour timeframe, the bearish picture becomes clearer. The ADX strengthens to 31.64, confirming a strong downtrend. The RSI(14) is at 43.6, further supporting the bearish sentiment. The MACD remains in negative territory, reinforcing the downward momentum. The Stochastic oscillator, with K=30.19 and D=44.66, confirms the bearish signal. Key support to watch on this timeframe is $80.63. A break below this level could open the door for a test of $79.78.
Looking at the daily chart provides a broader perspective. While the trend is neutral, the ADX is weak at 19.28, suggesting a lack of strong directional conviction. The RSI(14) is at 48.44, indicating neutral momentum. The MACD histogram is positive, providing a glimmer of hope for the bulls. However, the Stochastic oscillator, with K=29.27 and D=66.85, signals a bearish crossover. The daily chart highlights the importance of the $80.92 support level. A break below this level would likely embolden the bears and trigger a more sustained selloff.
Given the conflicting signals across different timeframes, a cautious approach is warranted. The near-term outlook hinges on the interplay between geopolitical risks, Fed policy expectations, and technical factors. Traders should closely monitor the DXY and Treasury yields for clues about the direction of the dollar and interest rates. Any hawkish signals from Fed speakers could put downward pressure on silver prices, while escalating geopolitical tensions could provide a boost.
The recent forex market reaction to geopolitical tensions and inflation data underscores the sensitivity of silver to broader market dynamics. The US Dollar is gaining strength amid rising oil prices due to geopolitical tensions, while the British Pound faces pre. This dynamic directly impacts silver, as a stronger dollar makes the metal less attractive to international buyers. The surge in WTI crude oil prices above $80, fueled by geopolitical tensions, is another factor to consider. Rising oil prices can contribute to inflationary pressures, which, in turn, can support silver prices as a hedge against inflation.
The silver gold ratio analysis 2026 reveals a complex interplay of factors affecting the relative value of the two precious metals. Industrial demand is a key driver for silver, with a significant percentage of silver demand stemming from industrial applications. The percentage of silver demand that is industrial vs gold is a crucial factor in determining the long-term outlook for the metal. Any slowdown in global economic growth could negatively impact industrial demand for silver, while increased adoption of silver in renewable energy technologies could provide a boost.
From a trading perspective, the current environment presents both opportunities and risks. Scalpers may find short-term trading opportunities based on intraday price fluctuations. Swing traders should focus on identifying clear breakout or breakdown patterns, while long-term investors should consider the broader macroeconomic backdrop and the long-term outlook for industrial demand. The key is to manage risk effectively and avoid getting caught on the wrong side of a sudden market move.
Considering the technical picture, a short trade appears favorable. The ADX at 31.64 across the 4H timeframe signals a strong downtrend, while the RSI and MACD histogram align to confirm the directional signal. The Stochastic indicator is currently in a tradeable zone, not signaling extreme overbought or oversold conditions, giving further confidence to the trade.
XAGUSD breaks below the support level of $81.91, confirming the downtrend. The price then targets $80.63, and if that level is breached, the next target is $79.78. This scenario has a 60% probability.
XAGUSD bounces from the $81.91 support and breaks above the resistance at $82.36. The price then targets $82.81, and if that level is breached, the next target is $84.14. This scenario has a 40% probability.
Frequently Asked Questions: XAGUSD Analysis
Is XAGUSD a good buy right now?
Currently trading at $83.03, XAGUSD faces strong downtrend pressure. Given the bearish technical signals and a strengthening dollar, it may not be a good buy right now unless it breaks resistance at $82.36.
What is the XAGUSD price forecast for this week?
XAGUSD price forecast for this week is bearish, with potential targets at $80.63 and $79.78, if the price breaks below $81.91. The probability of this scenario is estimated at 60%.
What are the key support and resistance levels for XAGUSD?
Key support levels for XAGUSD are at $81.91, $80.63, and $79.78. Key resistance levels are at $82.36, $82.81, and $84.14, according to the current market data.
Why is XAGUSD moving today?
XAGUSD is moving today due to a combination of factors, including a strengthening US dollar (DXY at 98.77) and negative momentum indicated by MACD and RSI across multiple timeframes.
Key Levels
Support Levels
Resistance Levels
Technical Outlook Summary
| Indicator | Value | Signal |
|---|---|---|
| RSI (14) | 49.89 | Neutral |
| MACD Histogram | Negative | Bearish |
| Stochastic | 56.56/24.73 | Bullish |
| ADX | 37.67 | Strong Downtrend |
| Bollinger | Middle Band | Watch |
Track markets in real-time
AI-powered analysis, technical indicators and real-time price data.
Join Our Telegram Channel
Breaking market news, AI analysis and trading signals instantly.
Join Channel