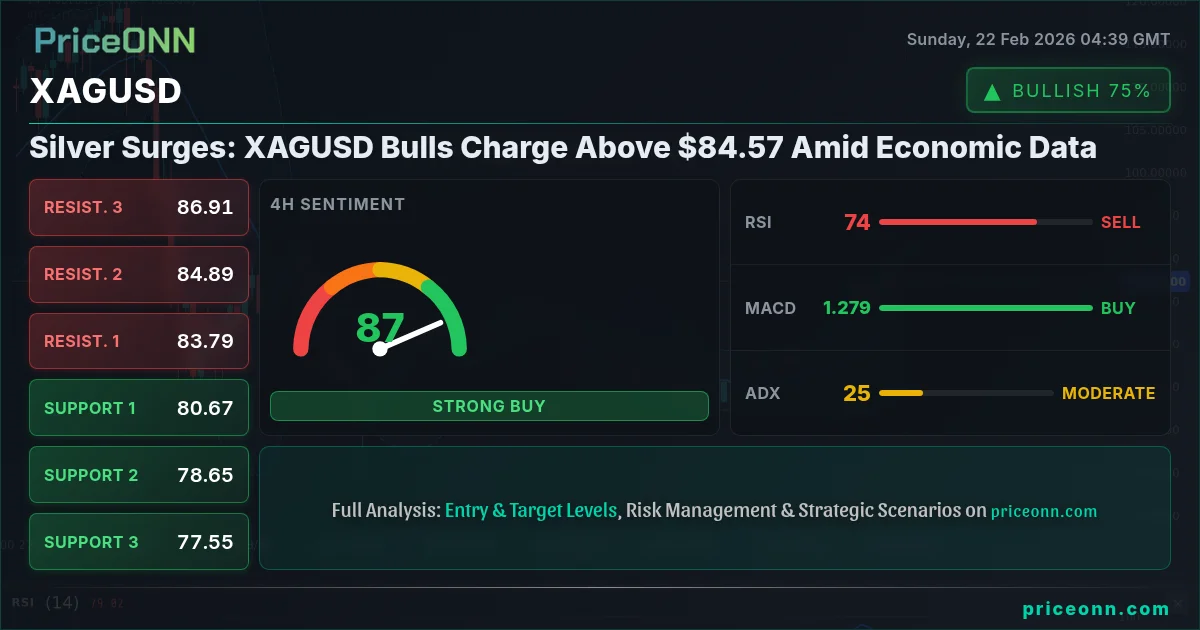
Amid growing concerns about global inflation and a flight to safe-haven assets, silver is experiencing a significant surge. XAGUSD, the silver-to-dollar pairing, is currently trading above $84.57, marking a substantial increase and attracting the attention of traders and investors alike. The question now is whether this rally is sustainable or a temporary phenomenon driven by short-term market sentiment.
- RSI at 84.29 on the 1H timeframe signals overbought conditions, suggesting potential for a pullback.
- Key resistance is at $84.62, the high of the day. A break above this level could signal further upside.
- ADX at 29.93 on the 1H chart indicates a strong uptrend, supporting the bullish momentum.
- Global inflation concerns and safe-haven demand are driving XAGUSD's correlation with broader market uncertainty.
The Flight to Safety: Why Silver is Shining
Silver, often referred to as "poor man's gold," tends to benefit during periods of economic uncertainty and inflation. With the global economy facing numerous challenges, including rising inflation, geopolitical tensions, and supply chain disruptions, investors are increasingly seeking refuge in precious metals. This demand is a key factor driving XAGUSD's recent performance. The rise in XAGUSD price reflects investor anxiety about the stability of traditional assets and fiat currencies.
Furthermore, silver has industrial applications that are not shared by gold. This dual demand driver can lead to outperformance during periods of economic growth and technological innovation. The increasing use of silver in solar panels, electric vehicles, and other green technologies is contributing to its long-term bullish outlook. Therefore, the recent price surge may be more than just a short-term reaction to market volatility.
Technical Overview: XAGUSD at a Critical Juncture
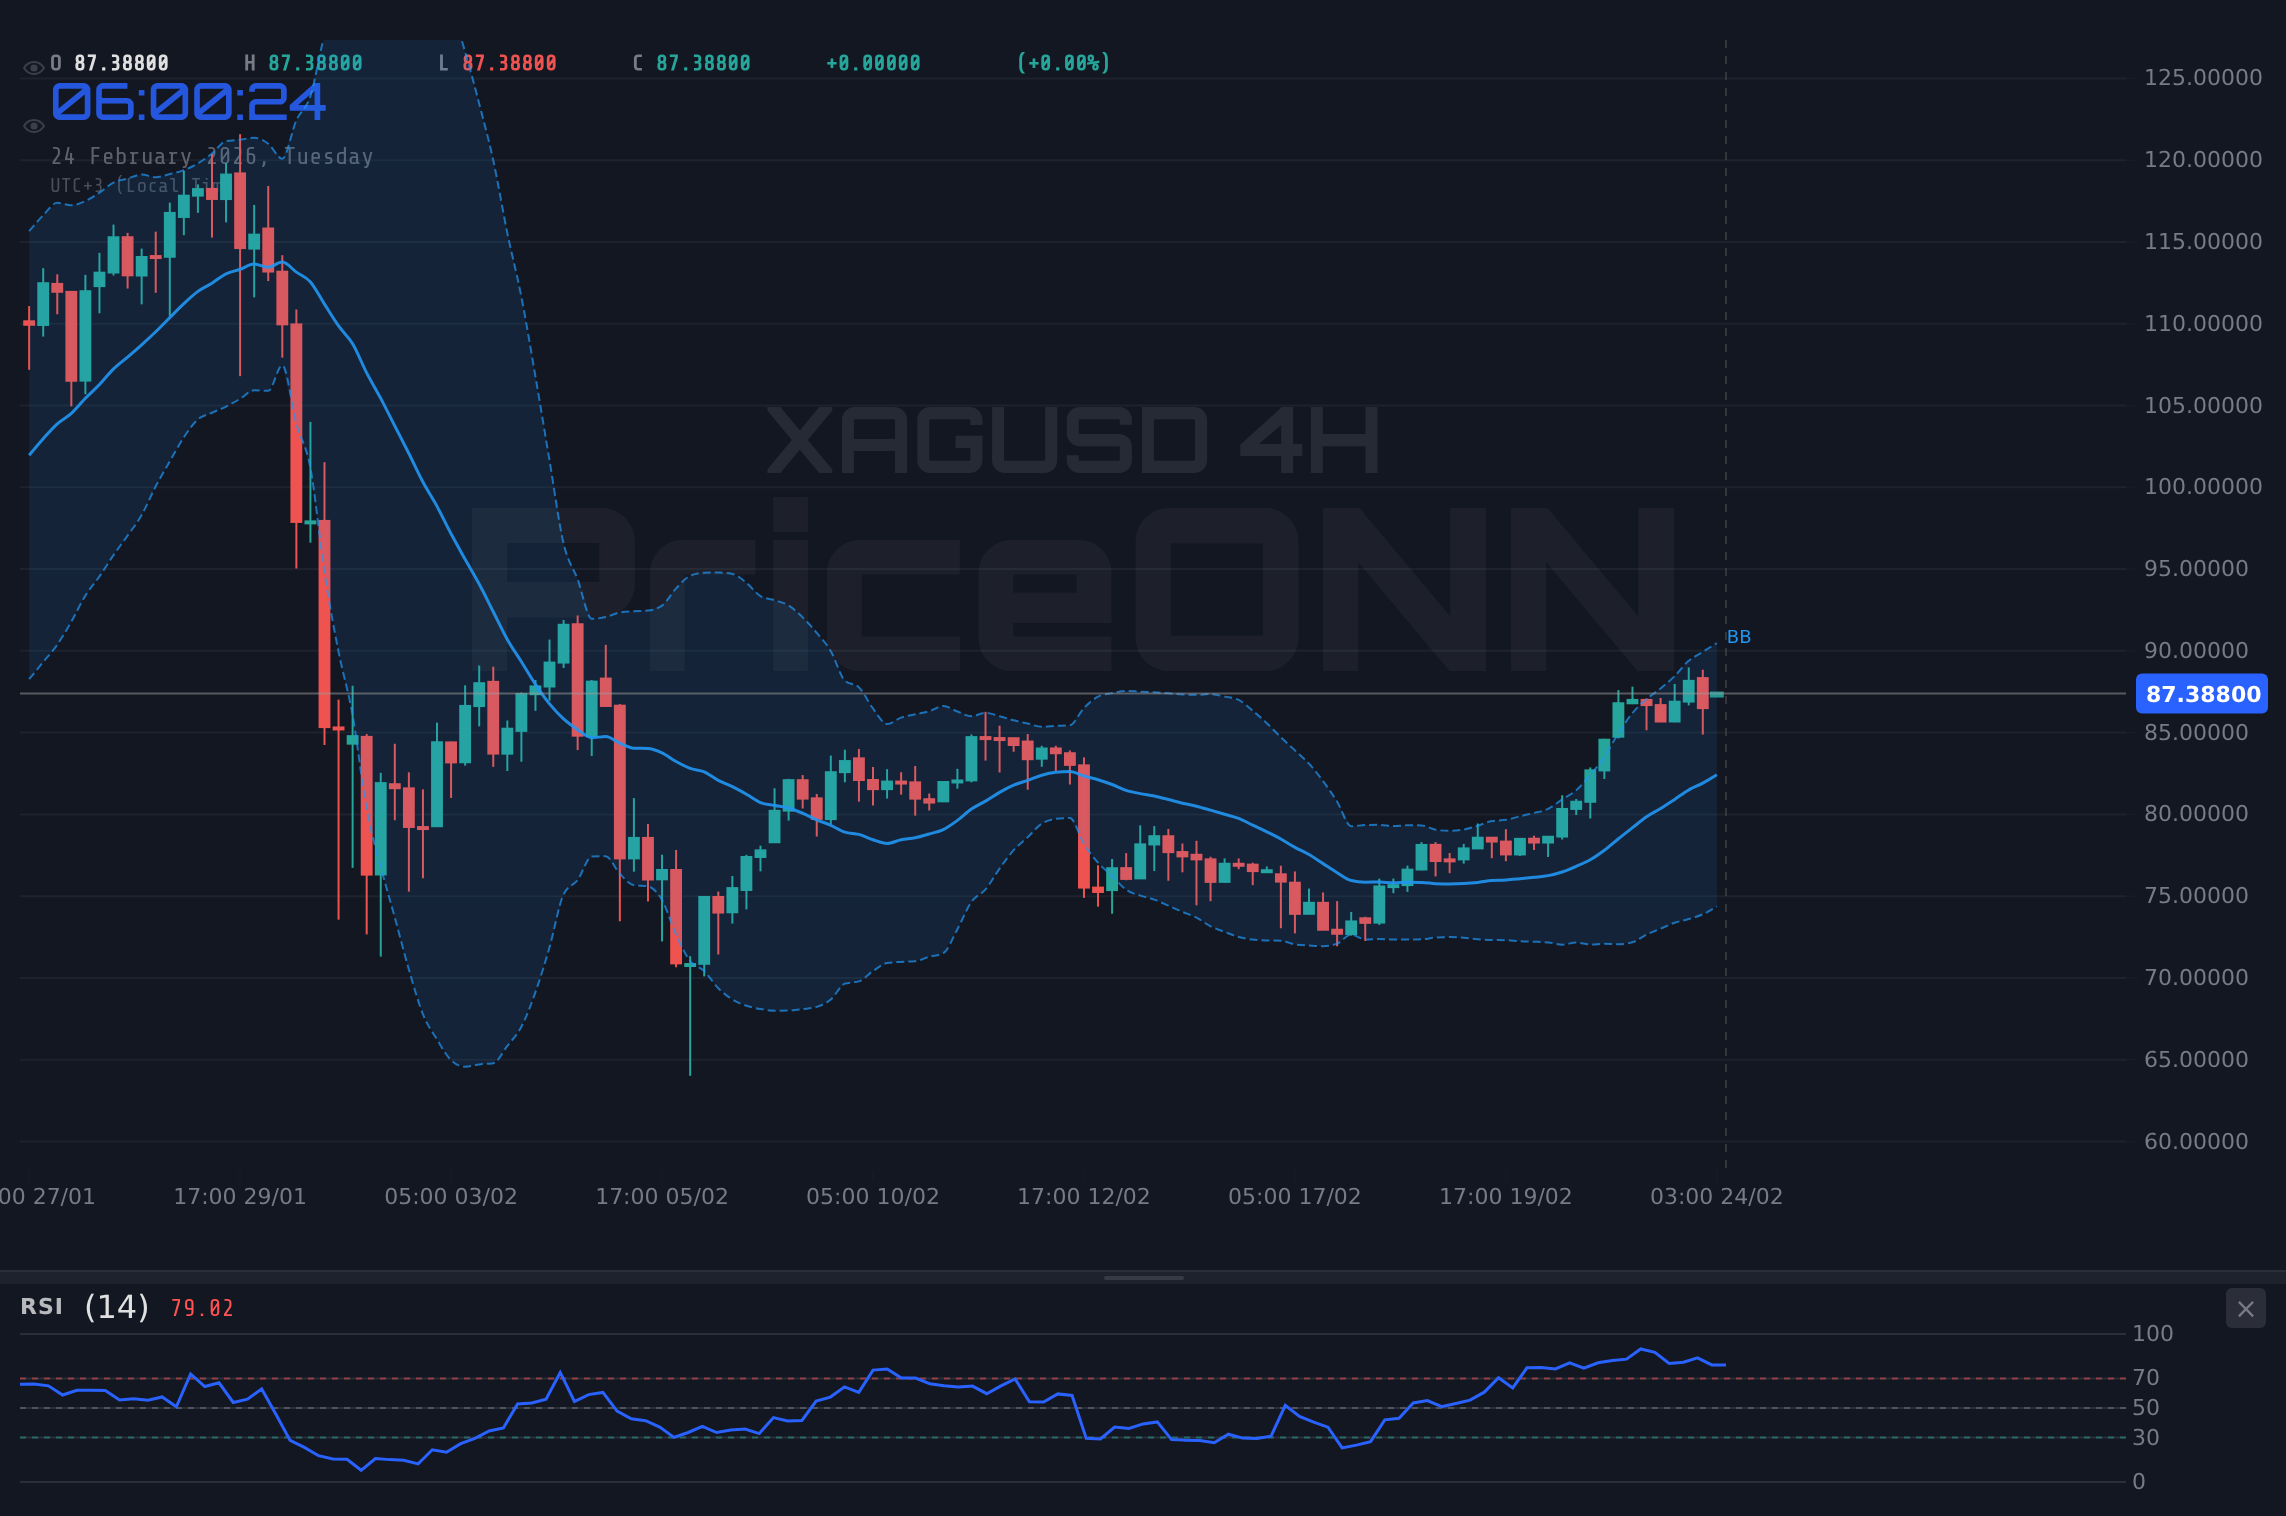
From a technical perspective, XAGUSD is currently testing a critical resistance level. The 1-hour chart shows a strong uptrend with the ADX at 29.93, indicating significant momentum. However, the RSI at 84.29 suggests that the asset is overbought and may be due for a pullback. The Stochastic oscillator, with K=98.49 and D=93.01, further confirms the overbought conditions. Now this is where it gets interesting! The indicators are suggesting a potential reversal or consolidation phase.
On the 4-hour chart, the trend is neutral, but the RSI is still in overbought territory at 73.45. The MACD shows positive momentum, but the Stochastic oscillator signals a potential pullback. This mixed picture suggests that the market is at a crossroads, and the next move will depend on whether the bulls can maintain their momentum or the bears can capitalize on the overbought conditions. Look, this level is absolutely critical - it could determine the short-term direction of XAGUSD.
Looking at the daily chart, the trend is bullish, but the RSI is at 51.57, indicating room for further upside. However, the MACD shows negative momentum, suggesting that the bullish trend may be losing steam. The ADX is at 31.12, indicating a strong downtrend. This divergence between the daily and shorter-term charts highlights the complexity of the current situation. Patience looks like it will be rewarded here.
Key Levels to Watch: Support and Resistance
Identifying key support and resistance levels is crucial for making informed trading decisions. On the 1-hour chart, immediate support lies at 82.83, followed by 82.42 and 82.18. Resistance is at 83.48, 83.73 and 84.13. These levels could act as potential entry or exit points for short-term traders.
On the 4-hour chart, support is at 80.18, 79.58, and 79.19. Resistance is at 81.16, 81.54, and 82.14. A break above resistance could signal a continuation of the bullish trend, while a break below support could lead to further downside. These are the key levels for swing traders to watch. Manage your risk, wait for your setup - the market always gives a second chance.
On the daily chart, support is at 76.79, 75.08, and 73.76. Resistance is at 79.83, 81.15, and 82.86. These levels are important for long-term investors to monitor, as they could indicate potential trend reversals or consolidations. If this condition plays out, we could see a great setup!
🎯 Critical Seviyeler
Support Levels
Resistance Levels
Trade Plan: Riding the Silver Wave
Given the current technical picture, a potential trade plan for XAGUSD could involve a bullish strategy, but with careful risk management. The strong uptrend on the 1-hour chart suggests that the bulls are in control, but the overbought conditions warrant caution. Therefore, a conservative approach would be to wait for a pullback before entering a long position.
Enter long at 83.00 after a pullback, targeting a move towards 83.73 initially, then 84.13 if momentum sustains. This scenario assumes continued safe-haven demand and positive sentiment towards silver.
If price breaks below 82.42, look for a move towards 81.54. This scenario assumes a correction due to overbought conditions and a shift in market sentiment.
Economic Data and Geopolitical Factors
While technical analysis provides valuable insights, it's crucial to consider the broader economic and geopolitical context. The economic calendar is relatively light today, but upcoming inflation data and central bank decisions could significantly impact XAGUSD. Any signs of rising inflation could further fuel demand for silver as a hedge, while hawkish comments from central bankers could dampen risk appetite and support safe-haven assets.
Geopolitical tensions, such as the ongoing conflict in Ukraine and rising tensions between the U.S. and China, could also contribute to safe-haven demand. Investors should closely monitor these developments and adjust their trading strategies accordingly. This is exactly where you need to pay attention - geopolitics can change the picture quickly.
Frequently Asked Questions: XAGUSD Analysis
Is XAGUSD a good buy right now?
XAGUSD is showing strong bullish momentum, currently trading at $84.57. However, the RSI indicates overbought conditions, so a pullback to the 83.00 level could present a better entry point for a long position, assuming the uptrend remains intact.
What is the XAGUSD price forecast for this week?
The XAGUSD price forecast for this week depends on whether the bulls can break above the 84.62 resistance. If they succeed, a move towards 85.00 is possible. However, a failure to break resistance could lead to a pullback towards the 82.00 support level.
What are the key support and resistance levels for XAGUSD?
Key support levels for XAGUSD are at 82.83, 82.42 and 82.18 on the 1-hour chart. Key resistance levels are at 83.48, 83.73 and 84.13. These levels will likely act as pivot points for price action in the short term.
Why is XAGUSD moving today?
XAGUSD is moving higher today due to a combination of factors, including rising inflation concerns and increased safe-haven demand. The strong uptrend on the 1-hour chart also suggests that technical factors are playing a role.
Technical Summary: A Balanced Outlook
Overall, the technical picture for XAGUSD is balanced, with both bullish and bearish signals. The strong uptrend on the 1-hour chart suggests that the bulls are in control, but the overbought conditions warrant caution. Therefore, traders should closely monitor key support and resistance levels and adjust their strategies accordingly. This is the opportunity that traders are waiting for. Don't miss out!
📊 Technical Outlook Summaryi
| Gösterge | Değer | Sinyal |
|---|---|---|
| RSI (14) | 84.29 | Aşırı Alım |
| MACD Histogram | Pozitif | Yükseliş |
| Stochastic | 98.49/93.01 | Aşırı Alım |
| ADX | 29.93 | Güçlü Trend |
| Bollinger | Üst Bant | Dikkat |
Track markets in real-time
AI-powered analysis, technical indicators and real-time price data.
Join Our Telegram Channel
Breaking market news, AI analysis and trading signals instantly.
Join Channel